
Key Insights
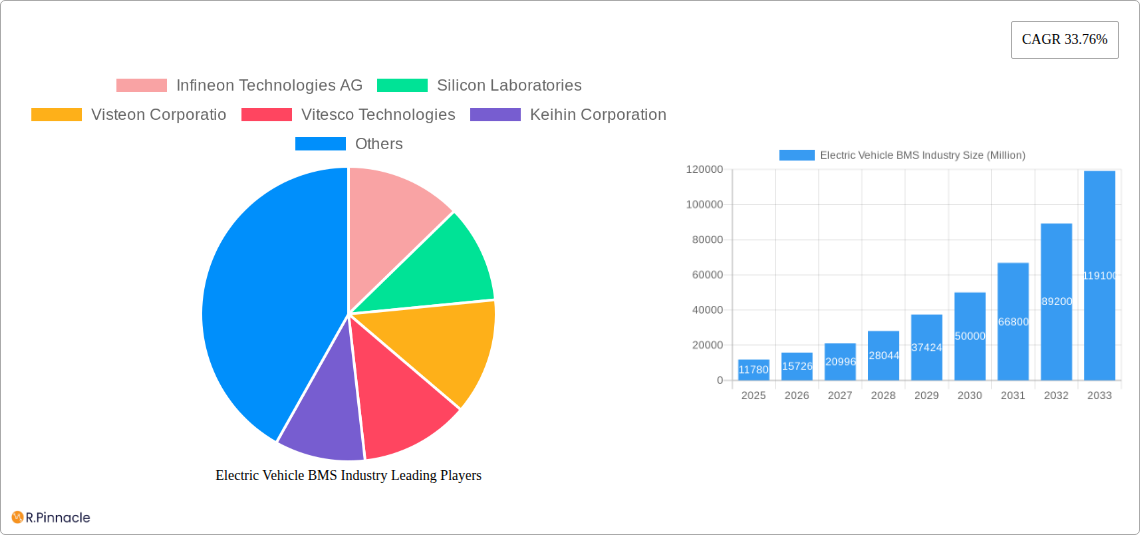
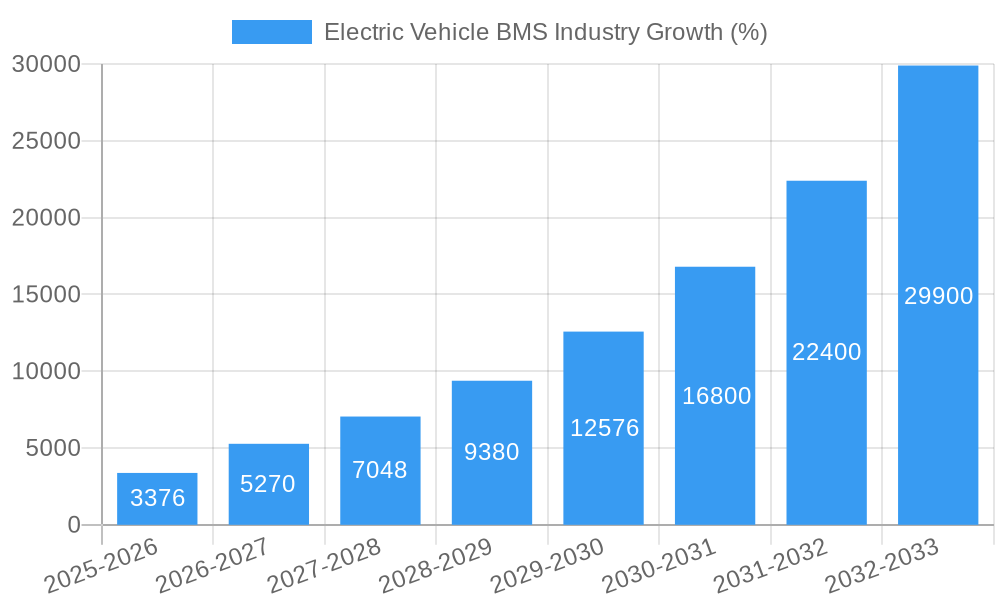
The Electric Vehicle Battery Management System (EV BMS) market is experiencing rapid growth, projected to reach a substantial size driven by the burgeoning electric vehicle (EV) industry. The market's Compound Annual Growth Rate (CAGR) of 33.76% from 2019-2024 indicates significant momentum, a trend expected to continue through 2033. This expansion is fueled by several key factors. Increasing adoption of EVs globally, stringent emission regulations promoting EV adoption, and advancements in battery technology leading to improved energy density and performance are all contributing to heightened demand for sophisticated BMS solutions. The market segmentation reveals significant opportunities across vehicle types (passenger cars and commercial vehicles), components (integrated circuits, FETs, sensors, microcontrollers, etc.), and propulsion types (BEVs and HEVs). Competition among established players like Infineon, Texas Instruments, and NXP, alongside emerging companies, is driving innovation and price optimization, making EV BMS technology more accessible and integrated. The Asia-Pacific region, particularly China, is expected to remain a dominant market force due to high EV production and government support, although North America and Europe are also experiencing significant growth.
The continued growth of the EV BMS market hinges on several factors. The development of next-generation batteries with higher energy densities will require more advanced BMS solutions. Furthermore, increasing focus on safety and reliability features, coupled with ongoing developments in connected car technologies, will drive demand for more sophisticated BMS functionalities, including predictive maintenance capabilities and remote diagnostics. The integration of artificial intelligence (AI) and machine learning (ML) into BMS is also anticipated to further improve battery performance, range, and lifespan, contributing to higher market value. However, potential challenges include the high initial cost of implementing advanced BMS systems and ensuring consistent supply chain stability for crucial components. Addressing these challenges will be crucial to sustaining the remarkable growth trajectory of the EV BMS market.
Electric Vehicle BMS Industry Report: 2019-2033
This comprehensive report provides a detailed analysis of the Electric Vehicle Battery Management System (BMS) industry, offering invaluable insights for industry professionals, investors, and strategists. With a study period spanning 2019-2033, a base year of 2025, and a forecast period of 2025-2033, this report leverages extensive market research to deliver actionable intelligence. The market is expected to reach xx Million by 2033, exhibiting a robust CAGR of xx% during the forecast period.
Electric Vehicle BMS Industry Market Structure & Innovation Trends
The Electric Vehicle BMS market is characterized by a moderately consolidated structure, with key players such as Infineon Technologies AG, Silicon Laboratories, Visteon Corporation, Vitesco Technologies, Keihin Corporation, TE Connectivity, NXP Semiconductors, Renesas Electronics Corporation, Texas Instruments Incorporated, and Analog Devices Inc. holding significant market share. While precise market share figures for each player are proprietary, the competitive landscape is dynamic, driven by continuous innovation and strategic mergers and acquisitions (M&A). The total value of M&A deals in the sector between 2019 and 2024 is estimated to be around xx Million.
- Market Concentration: Moderately consolidated, with top 10 players accounting for approximately xx% of the market.
- Innovation Drivers: Stringent emission regulations, increasing demand for EVs, advancements in battery technology, and the need for enhanced safety and performance.
- Regulatory Frameworks: Government incentives and regulations promoting EV adoption significantly influence market growth.
- Product Substitutes: Currently, there are limited direct substitutes for EV BMS, but improvements in other areas such as battery technology could indirectly reduce reliance on certain BMS features.
- End-User Demographics: The primary end users are EV manufacturers (both passenger car and commercial vehicle segments), with a growing emphasis on large commercial vehicle applications.
- M&A Activities: Strategic acquisitions and partnerships are common, aimed at expanding product portfolios, acquiring technology, and accessing new markets.
Electric Vehicle BMS Industry Market Dynamics & Trends
The EV BMS market is experiencing substantial growth driven by the global surge in electric vehicle adoption. Several factors contribute to this expansion, including stringent government regulations aimed at reducing carbon emissions, increasing consumer preference for eco-friendly vehicles, and ongoing advancements in battery technology. The market is witnessing technological disruptions in areas such as improved power electronics, sophisticated algorithms for battery management, and integration with other vehicle systems. This leads to enhanced efficiency, safety, and extended battery life. The competitive landscape is intensely competitive, with existing players and new entrants vying for market share through product innovation, cost optimization, and strategic partnerships.
The market exhibits a strong correlation between EV sales and BMS demand. As EV sales are projected to reach xx Million units globally by 2033, the demand for BMS is expected to follow suit. This translates to a substantial market opportunity for manufacturers. The market penetration of advanced BMS features such as predictive maintenance and over-the-air updates is also steadily increasing, driving further growth.
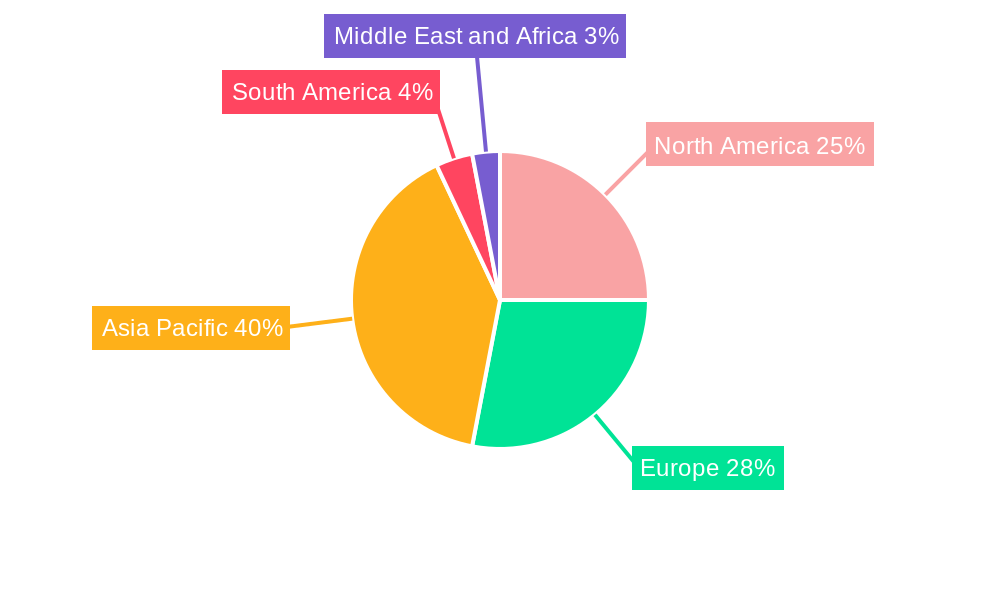
Dominant Regions & Segments in Electric Vehicle BMS Industry
The EV BMS market is geographically diverse, with significant growth potential across various regions. However, currently, [mention the leading region, e.g., Asia-Pacific] is the dominant region due to the high concentration of EV manufacturing and strong government support for EV adoption. Within segments:
- By Vehicle Type: The passenger car segment currently holds the largest market share, but the commercial vehicle segment is projected to exhibit faster growth due to increasing demand for electric buses, trucks, and other commercial vehicles.
- By Components: Integrated circuits are the largest component segment, followed by cutoff FETs and FET drivers, reflecting the complex electronic architecture of BMS.
- By Propulsion Type: Battery Electric Vehicles (BEVs) currently dominate the market, although Hybrid Electric Vehicles (HEVs) continue to contribute significantly.
Key Drivers for Dominant Regions/Segments:
- Asia-Pacific: Strong government policies promoting electric vehicles, robust manufacturing base, and a large consumer market.
- North America/Europe: Growing consumer awareness of environmental concerns, supportive government regulations, and robust charging infrastructure.
- Integrated Circuits: High functionality, integration of various sensing and control features, and technological advancements.
Electric Vehicle BMS Industry Product Innovations
Recent innovations in EV BMS focus on improving safety, extending battery life, enhancing efficiency, and optimizing charging times. Manufacturers are incorporating advanced algorithms for predictive maintenance, over-the-air updates, and improved thermal management systems. The market is witnessing a trend toward miniaturization and cost reduction, enabling broader adoption across various EV segments. The integration of BMS with other vehicle systems, such as infotainment and driver-assistance systems, is another key area of innovation.
Report Scope & Segmentation Analysis
This report offers a comprehensive segmentation analysis of the Electric Vehicle BMS market across several key parameters:
- By Vehicle Type: Passenger Cars and Commercial Vehicles, each with detailed growth projections and market size estimations, highlighting differences in technological requirements and market dynamics.
- By Components: Integrated Circuits, Cutoff FETs and FET Drivers, Temperature Sensors, Fuel Gauge/Current Measurement Devices, Microcontrollers, and Other Components, providing a granular view of the component landscape and individual market potential.
- By Propulsion Type: Battery Electric Vehicles (BEVs) and Hybrid Electric Vehicles (HEVs), showcasing differing BMS requirements and anticipated growth trajectories. The report analyzes the competitive landscape within each segment, identifying key players and their strategies.
Key Drivers of Electric Vehicle BMS Industry Growth
Several factors drive the growth of the Electric Vehicle BMS industry. These include stringent government regulations on vehicle emissions, increasing consumer demand for eco-friendly transportation, substantial investments in research and development for improved battery technologies and more efficient BMS systems, and the ongoing expansion of charging infrastructure. The increasing adoption of electric vehicles globally further accelerates market growth.
Challenges in the Electric Vehicle BMS Industry Sector
The EV BMS industry faces several challenges, including the high cost of BMS components, concerns about battery safety and reliability, the complexity of BMS design and integration, the need for robust thermal management solutions, and potential supply chain disruptions. These factors influence production costs and affect the overall market growth. Addressing these concerns is crucial for industry players to achieve sustainable growth.
Emerging Opportunities in Electric Vehicle BMS Industry
The EV BMS market presents numerous emerging opportunities, including the development of advanced BMS features such as predictive maintenance and AI-powered diagnostics, the integration of BMS with vehicle-to-grid (V2G) technology, the expansion into new markets like commercial vehicles and two-wheelers, and the emergence of solid-state batteries which will change BMS designs and require new components.
Leading Players in the Electric Vehicle BMS Industry Market
- Infineon Technologies AG
- Silicon Laboratories
- Visteon Corporation
- Vitesco Technologies
- Keihin Corporation
- TE Connectivity
- NXP Semiconductors
- Renesas Electronics Corporation
- Texas Instruments Incorporated
- Analog Devices Inc
Key Developments in Electric Vehicle BMS Industry
- October 2022: Sensata introduced the Lithium Balance n3-BMS, a new battery management system designed for large commercial vehicles (up to 1000 volts/2000 amps).
- January 2023: Modine Manufacturing Co. launched the EVantage Battery Thermal Management System for on- and off-road electric vehicles.
- March 2023: TBK Co., Ltd. and Mikuni Corporation signed a joint development agreement for commercial vehicle thermal management systems.
Future Outlook for Electric Vehicle BMS Industry Market
The future of the EV BMS market is bright, driven by the continued global shift towards electric mobility. Technological advancements, coupled with supportive government policies and growing consumer demand, will fuel market expansion. Strategic partnerships, collaborations, and product innovations will further enhance market growth, and the development of advanced BMS features will drive increased market penetration. The market is expected to witness significant growth in the coming years.
Electric Vehicle BMS Industry Segmentation
-
1. Components
- 1.1. Integrated Circuits
- 1.2. Cutoff FETs and FET Driver
- 1.3. Temperature Sensor
- 1.4. Fuel Gauge/Current Measurement Devices
- 1.5. Microcontroller
- 1.6. Other Components
-
2. Propulsion Type
- 2.1. Battery Electric Vehicles
- 2.2. Hybrid Electric Vehicles
-
3. Vehicle Type
- 3.1. Passenger Car
- 3.2. Commercial Vehicles
Electric Vehicle BMS Industry Segmentation By Geography
-
1. North America
- 1.1. United States
- 1.2. Canada
- 1.3. Rest of North America
-
2. Europe
- 2.1. Germany
- 2.2. United Kingdom
- 2.3. France
- 2.4. Russia
- 2.5. Spain
- 2.6. Rest of Europe
-
3. Asia Pacific
- 3.1. China
- 3.2. India
- 3.3. Japan
- 3.4. South Korea
- 3.5. Rest of Asia Pacific
-
4. South America
- 4.1. Brazil
- 4.2. Argentina
- 4.3. Rest of South America
-
5. Middle East and Africa
- 5.1. United Arab Emirates
- 5.2. Saudi Arabia
- 5.3. Rest of Middle East and Africa
Electric Vehicle BMS Industry REPORT HIGHLIGHTS
| Aspects | Details |
|---|---|
| Study Period | 2019-2033 |
| Base Year | 2024 |
| Estimated Year | 2025 |
| Forecast Period | 2025-2033 |
| Historical Period | 2019-2024 |
| Growth Rate | CAGR of 33.76% from 2019-2033 |
| Segmentation |
|
Table of Contents
- 1. Introduction
- 1.1. Research Scope
- 1.2. Market Segmentation
- 1.3. Research Methodology
- 1.4. Definitions and Assumptions
- 2. Executive Summary
- 2.1. Introduction
- 3. Market Dynamics
- 3.1. Introduction
- 3.2. Market Drivers
- 3.2.1. Potential Shift Toward Adoption of Electric Buses to Drive the Market
- 3.3. Market Restrains
- 3.3.1. Lack of Electric Charging Infrastructure May Hamper the Growth of the Market
- 3.4. Market Trends
- 3.4.1. Battery Electric Vehicle Segment Anticipated to Dominate the Market
- 4. Market Factor Analysis
- 4.1. Porters Five Forces
- 4.2. Supply/Value Chain
- 4.3. PESTEL analysis
- 4.4. Market Entropy
- 4.5. Patent/Trademark Analysis
- 5. Global Electric Vehicle BMS Industry Analysis, Insights and Forecast, 2019-2031
- 5.1. Market Analysis, Insights and Forecast - by Components
- 5.1.1. Integrated Circuits
- 5.1.2. Cutoff FETs and FET Driver
- 5.1.3. Temperature Sensor
- 5.1.4. Fuel Gauge/Current Measurement Devices
- 5.1.5. Microcontroller
- 5.1.6. Other Components
- 5.2. Market Analysis, Insights and Forecast - by Propulsion Type
- 5.2.1. Battery Electric Vehicles
- 5.2.2. Hybrid Electric Vehicles
- 5.3. Market Analysis, Insights and Forecast - by Vehicle Type
- 5.3.1. Passenger Car
- 5.3.2. Commercial Vehicles
- 5.4. Market Analysis, Insights and Forecast - by Region
- 5.4.1. North America
- 5.4.2. Europe
- 5.4.3. Asia Pacific
- 5.4.4. South America
- 5.4.5. Middle East and Africa
- 5.1. Market Analysis, Insights and Forecast - by Components
- 6. North America Electric Vehicle BMS Industry Analysis, Insights and Forecast, 2019-2031
- 6.1. Market Analysis, Insights and Forecast - by Components
- 6.1.1. Integrated Circuits
- 6.1.2. Cutoff FETs and FET Driver
- 6.1.3. Temperature Sensor
- 6.1.4. Fuel Gauge/Current Measurement Devices
- 6.1.5. Microcontroller
- 6.1.6. Other Components
- 6.2. Market Analysis, Insights and Forecast - by Propulsion Type
- 6.2.1. Battery Electric Vehicles
- 6.2.2. Hybrid Electric Vehicles
- 6.3. Market Analysis, Insights and Forecast - by Vehicle Type
- 6.3.1. Passenger Car
- 6.3.2. Commercial Vehicles
- 6.1. Market Analysis, Insights and Forecast - by Components
- 7. Europe Electric Vehicle BMS Industry Analysis, Insights and Forecast, 2019-2031
- 7.1. Market Analysis, Insights and Forecast - by Components
- 7.1.1. Integrated Circuits
- 7.1.2. Cutoff FETs and FET Driver
- 7.1.3. Temperature Sensor
- 7.1.4. Fuel Gauge/Current Measurement Devices
- 7.1.5. Microcontroller
- 7.1.6. Other Components
- 7.2. Market Analysis, Insights and Forecast - by Propulsion Type
- 7.2.1. Battery Electric Vehicles
- 7.2.2. Hybrid Electric Vehicles
- 7.3. Market Analysis, Insights and Forecast - by Vehicle Type
- 7.3.1. Passenger Car
- 7.3.2. Commercial Vehicles
- 7.1. Market Analysis, Insights and Forecast - by Components
- 8. Asia Pacific Electric Vehicle BMS Industry Analysis, Insights and Forecast, 2019-2031
- 8.1. Market Analysis, Insights and Forecast - by Components
- 8.1.1. Integrated Circuits
- 8.1.2. Cutoff FETs and FET Driver
- 8.1.3. Temperature Sensor
- 8.1.4. Fuel Gauge/Current Measurement Devices
- 8.1.5. Microcontroller
- 8.1.6. Other Components
- 8.2. Market Analysis, Insights and Forecast - by Propulsion Type
- 8.2.1. Battery Electric Vehicles
- 8.2.2. Hybrid Electric Vehicles
- 8.3. Market Analysis, Insights and Forecast - by Vehicle Type
- 8.3.1. Passenger Car
- 8.3.2. Commercial Vehicles
- 8.1. Market Analysis, Insights and Forecast - by Components
- 9. South America Electric Vehicle BMS Industry Analysis, Insights and Forecast, 2019-2031
- 9.1. Market Analysis, Insights and Forecast - by Components
- 9.1.1. Integrated Circuits
- 9.1.2. Cutoff FETs and FET Driver
- 9.1.3. Temperature Sensor
- 9.1.4. Fuel Gauge/Current Measurement Devices
- 9.1.5. Microcontroller
- 9.1.6. Other Components
- 9.2. Market Analysis, Insights and Forecast - by Propulsion Type
- 9.2.1. Battery Electric Vehicles
- 9.2.2. Hybrid Electric Vehicles
- 9.3. Market Analysis, Insights and Forecast - by Vehicle Type
- 9.3.1. Passenger Car
- 9.3.2. Commercial Vehicles
- 9.1. Market Analysis, Insights and Forecast - by Components
- 10. Middle East and Africa Electric Vehicle BMS Industry Analysis, Insights and Forecast, 2019-2031
- 10.1. Market Analysis, Insights and Forecast - by Components
- 10.1.1. Integrated Circuits
- 10.1.2. Cutoff FETs and FET Driver
- 10.1.3. Temperature Sensor
- 10.1.4. Fuel Gauge/Current Measurement Devices
- 10.1.5. Microcontroller
- 10.1.6. Other Components
- 10.2. Market Analysis, Insights and Forecast - by Propulsion Type
- 10.2.1. Battery Electric Vehicles
- 10.2.2. Hybrid Electric Vehicles
- 10.3. Market Analysis, Insights and Forecast - by Vehicle Type
- 10.3.1. Passenger Car
- 10.3.2. Commercial Vehicles
- 10.1. Market Analysis, Insights and Forecast - by Components
- 11. North America Electric Vehicle BMS Industry Analysis, Insights and Forecast, 2019-2031
- 11.1. Market Analysis, Insights and Forecast - By Country/Sub-region
- 11.1.1 United States
- 11.1.2 Canada
- 11.1.3 Rest of North America
- 12. Europe Electric Vehicle BMS Industry Analysis, Insights and Forecast, 2019-2031
- 12.1. Market Analysis, Insights and Forecast - By Country/Sub-region
- 12.1.1 Germany
- 12.1.2 United Kingdom
- 12.1.3 France
- 12.1.4 Russia
- 12.1.5 Spain
- 12.1.6 Rest of Europe
- 13. Asia Pacific Electric Vehicle BMS Industry Analysis, Insights and Forecast, 2019-2031
- 13.1. Market Analysis, Insights and Forecast - By Country/Sub-region
- 13.1.1 China
- 13.1.2 India
- 13.1.3 Japan
- 13.1.4 South Korea
- 13.1.5 Rest of Asia Pacific
- 14. South America Electric Vehicle BMS Industry Analysis, Insights and Forecast, 2019-2031
- 14.1. Market Analysis, Insights and Forecast - By Country/Sub-region
- 14.1.1 Brazil
- 14.1.2 Argentina
- 14.1.3 Rest of South America
- 15. Middle East and Africa Electric Vehicle BMS Industry Analysis, Insights and Forecast, 2019-2031
- 15.1. Market Analysis, Insights and Forecast - By Country/Sub-region
- 15.1.1 United Arab Emirates
- 15.1.2 Saudi Arabia
- 15.1.3 Rest of Middle East and Africa
- 16. Competitive Analysis
- 16.1. Global Market Share Analysis 2024
- 16.2. Company Profiles
- 16.2.1 Infineon Technologies AG
- 16.2.1.1. Overview
- 16.2.1.2. Products
- 16.2.1.3. SWOT Analysis
- 16.2.1.4. Recent Developments
- 16.2.1.5. Financials (Based on Availability)
- 16.2.2 Silicon Laboratories
- 16.2.2.1. Overview
- 16.2.2.2. Products
- 16.2.2.3. SWOT Analysis
- 16.2.2.4. Recent Developments
- 16.2.2.5. Financials (Based on Availability)
- 16.2.3 Visteon Corporatio
- 16.2.3.1. Overview
- 16.2.3.2. Products
- 16.2.3.3. SWOT Analysis
- 16.2.3.4. Recent Developments
- 16.2.3.5. Financials (Based on Availability)
- 16.2.4 Vitesco Technologies
- 16.2.4.1. Overview
- 16.2.4.2. Products
- 16.2.4.3. SWOT Analysis
- 16.2.4.4. Recent Developments
- 16.2.4.5. Financials (Based on Availability)
- 16.2.5 Keihin Corporation
- 16.2.5.1. Overview
- 16.2.5.2. Products
- 16.2.5.3. SWOT Analysis
- 16.2.5.4. Recent Developments
- 16.2.5.5. Financials (Based on Availability)
- 16.2.6 TE Connectivity
- 16.2.6.1. Overview
- 16.2.6.2. Products
- 16.2.6.3. SWOT Analysis
- 16.2.6.4. Recent Developments
- 16.2.6.5. Financials (Based on Availability)
- 16.2.7 NXP Semiconductors
- 16.2.7.1. Overview
- 16.2.7.2. Products
- 16.2.7.3. SWOT Analysis
- 16.2.7.4. Recent Developments
- 16.2.7.5. Financials (Based on Availability)
- 16.2.8 Renesas Electronics Corporation
- 16.2.8.1. Overview
- 16.2.8.2. Products
- 16.2.8.3. SWOT Analysis
- 16.2.8.4. Recent Developments
- 16.2.8.5. Financials (Based on Availability)
- 16.2.9 Texas Instruments Incorporated
- 16.2.9.1. Overview
- 16.2.9.2. Products
- 16.2.9.3. SWOT Analysis
- 16.2.9.4. Recent Developments
- 16.2.9.5. Financials (Based on Availability)
- 16.2.10 Analog Devices Inc
- 16.2.10.1. Overview
- 16.2.10.2. Products
- 16.2.10.3. SWOT Analysis
- 16.2.10.4. Recent Developments
- 16.2.10.5. Financials (Based on Availability)
- 16.2.1 Infineon Technologies AG
List of Figures
- Figure 1: Global Electric Vehicle BMS Industry Revenue Breakdown (Million, %) by Region 2024 & 2032
- Figure 2: North America Electric Vehicle BMS Industry Revenue (Million), by Country 2024 & 2032
- Figure 3: North America Electric Vehicle BMS Industry Revenue Share (%), by Country 2024 & 2032
- Figure 4: Europe Electric Vehicle BMS Industry Revenue (Million), by Country 2024 & 2032
- Figure 5: Europe Electric Vehicle BMS Industry Revenue Share (%), by Country 2024 & 2032
- Figure 6: Asia Pacific Electric Vehicle BMS Industry Revenue (Million), by Country 2024 & 2032
- Figure 7: Asia Pacific Electric Vehicle BMS Industry Revenue Share (%), by Country 2024 & 2032
- Figure 8: South America Electric Vehicle BMS Industry Revenue (Million), by Country 2024 & 2032
- Figure 9: South America Electric Vehicle BMS Industry Revenue Share (%), by Country 2024 & 2032
- Figure 10: Middle East and Africa Electric Vehicle BMS Industry Revenue (Million), by Country 2024 & 2032
- Figure 11: Middle East and Africa Electric Vehicle BMS Industry Revenue Share (%), by Country 2024 & 2032
- Figure 12: North America Electric Vehicle BMS Industry Revenue (Million), by Components 2024 & 2032
- Figure 13: North America Electric Vehicle BMS Industry Revenue Share (%), by Components 2024 & 2032
- Figure 14: North America Electric Vehicle BMS Industry Revenue (Million), by Propulsion Type 2024 & 2032
- Figure 15: North America Electric Vehicle BMS Industry Revenue Share (%), by Propulsion Type 2024 & 2032
- Figure 16: North America Electric Vehicle BMS Industry Revenue (Million), by Vehicle Type 2024 & 2032
- Figure 17: North America Electric Vehicle BMS Industry Revenue Share (%), by Vehicle Type 2024 & 2032
- Figure 18: North America Electric Vehicle BMS Industry Revenue (Million), by Country 2024 & 2032
- Figure 19: North America Electric Vehicle BMS Industry Revenue Share (%), by Country 2024 & 2032
- Figure 20: Europe Electric Vehicle BMS Industry Revenue (Million), by Components 2024 & 2032
- Figure 21: Europe Electric Vehicle BMS Industry Revenue Share (%), by Components 2024 & 2032
- Figure 22: Europe Electric Vehicle BMS Industry Revenue (Million), by Propulsion Type 2024 & 2032
- Figure 23: Europe Electric Vehicle BMS Industry Revenue Share (%), by Propulsion Type 2024 & 2032
- Figure 24: Europe Electric Vehicle BMS Industry Revenue (Million), by Vehicle Type 2024 & 2032
- Figure 25: Europe Electric Vehicle BMS Industry Revenue Share (%), by Vehicle Type 2024 & 2032
- Figure 26: Europe Electric Vehicle BMS Industry Revenue (Million), by Country 2024 & 2032
- Figure 27: Europe Electric Vehicle BMS Industry Revenue Share (%), by Country 2024 & 2032
- Figure 28: Asia Pacific Electric Vehicle BMS Industry Revenue (Million), by Components 2024 & 2032
- Figure 29: Asia Pacific Electric Vehicle BMS Industry Revenue Share (%), by Components 2024 & 2032
- Figure 30: Asia Pacific Electric Vehicle BMS Industry Revenue (Million), by Propulsion Type 2024 & 2032
- Figure 31: Asia Pacific Electric Vehicle BMS Industry Revenue Share (%), by Propulsion Type 2024 & 2032
- Figure 32: Asia Pacific Electric Vehicle BMS Industry Revenue (Million), by Vehicle Type 2024 & 2032
- Figure 33: Asia Pacific Electric Vehicle BMS Industry Revenue Share (%), by Vehicle Type 2024 & 2032
- Figure 34: Asia Pacific Electric Vehicle BMS Industry Revenue (Million), by Country 2024 & 2032
- Figure 35: Asia Pacific Electric Vehicle BMS Industry Revenue Share (%), by Country 2024 & 2032
- Figure 36: South America Electric Vehicle BMS Industry Revenue (Million), by Components 2024 & 2032
- Figure 37: South America Electric Vehicle BMS Industry Revenue Share (%), by Components 2024 & 2032
- Figure 38: South America Electric Vehicle BMS Industry Revenue (Million), by Propulsion Type 2024 & 2032
- Figure 39: South America Electric Vehicle BMS Industry Revenue Share (%), by Propulsion Type 2024 & 2032
- Figure 40: South America Electric Vehicle BMS Industry Revenue (Million), by Vehicle Type 2024 & 2032
- Figure 41: South America Electric Vehicle BMS Industry Revenue Share (%), by Vehicle Type 2024 & 2032
- Figure 42: South America Electric Vehicle BMS Industry Revenue (Million), by Country 2024 & 2032
- Figure 43: South America Electric Vehicle BMS Industry Revenue Share (%), by Country 2024 & 2032
- Figure 44: Middle East and Africa Electric Vehicle BMS Industry Revenue (Million), by Components 2024 & 2032
- Figure 45: Middle East and Africa Electric Vehicle BMS Industry Revenue Share (%), by Components 2024 & 2032
- Figure 46: Middle East and Africa Electric Vehicle BMS Industry Revenue (Million), by Propulsion Type 2024 & 2032
- Figure 47: Middle East and Africa Electric Vehicle BMS Industry Revenue Share (%), by Propulsion Type 2024 & 2032
- Figure 48: Middle East and Africa Electric Vehicle BMS Industry Revenue (Million), by Vehicle Type 2024 & 2032
- Figure 49: Middle East and Africa Electric Vehicle BMS Industry Revenue Share (%), by Vehicle Type 2024 & 2032
- Figure 50: Middle East and Africa Electric Vehicle BMS Industry Revenue (Million), by Country 2024 & 2032
- Figure 51: Middle East and Africa Electric Vehicle BMS Industry Revenue Share (%), by Country 2024 & 2032
List of Tables
- Table 1: Global Electric Vehicle BMS Industry Revenue Million Forecast, by Region 2019 & 2032
- Table 2: Global Electric Vehicle BMS Industry Revenue Million Forecast, by Components 2019 & 2032
- Table 3: Global Electric Vehicle BMS Industry Revenue Million Forecast, by Propulsion Type 2019 & 2032
- Table 4: Global Electric Vehicle BMS Industry Revenue Million Forecast, by Vehicle Type 2019 & 2032
- Table 5: Global Electric Vehicle BMS Industry Revenue Million Forecast, by Region 2019 & 2032
- Table 6: Global Electric Vehicle BMS Industry Revenue Million Forecast, by Country 2019 & 2032
- Table 7: United States Electric Vehicle BMS Industry Revenue (Million) Forecast, by Application 2019 & 2032
- Table 8: Canada Electric Vehicle BMS Industry Revenue (Million) Forecast, by Application 2019 & 2032
- Table 9: Rest of North America Electric Vehicle BMS Industry Revenue (Million) Forecast, by Application 2019 & 2032
- Table 10: Global Electric Vehicle BMS Industry Revenue Million Forecast, by Country 2019 & 2032
- Table 11: Germany Electric Vehicle BMS Industry Revenue (Million) Forecast, by Application 2019 & 2032
- Table 12: United Kingdom Electric Vehicle BMS Industry Revenue (Million) Forecast, by Application 2019 & 2032
- Table 13: France Electric Vehicle BMS Industry Revenue (Million) Forecast, by Application 2019 & 2032
- Table 14: Russia Electric Vehicle BMS Industry Revenue (Million) Forecast, by Application 2019 & 2032
- Table 15: Spain Electric Vehicle BMS Industry Revenue (Million) Forecast, by Application 2019 & 2032
- Table 16: Rest of Europe Electric Vehicle BMS Industry Revenue (Million) Forecast, by Application 2019 & 2032
- Table 17: Global Electric Vehicle BMS Industry Revenue Million Forecast, by Country 2019 & 2032
- Table 18: China Electric Vehicle BMS Industry Revenue (Million) Forecast, by Application 2019 & 2032
- Table 19: India Electric Vehicle BMS Industry Revenue (Million) Forecast, by Application 2019 & 2032
- Table 20: Japan Electric Vehicle BMS Industry Revenue (Million) Forecast, by Application 2019 & 2032
- Table 21: South Korea Electric Vehicle BMS Industry Revenue (Million) Forecast, by Application 2019 & 2032
- Table 22: Rest of Asia Pacific Electric Vehicle BMS Industry Revenue (Million) Forecast, by Application 2019 & 2032
- Table 23: Global Electric Vehicle BMS Industry Revenue Million Forecast, by Country 2019 & 2032
- Table 24: Brazil Electric Vehicle BMS Industry Revenue (Million) Forecast, by Application 2019 & 2032
- Table 25: Argentina Electric Vehicle BMS Industry Revenue (Million) Forecast, by Application 2019 & 2032
- Table 26: Rest of South America Electric Vehicle BMS Industry Revenue (Million) Forecast, by Application 2019 & 2032
- Table 27: Global Electric Vehicle BMS Industry Revenue Million Forecast, by Country 2019 & 2032
- Table 28: United Arab Emirates Electric Vehicle BMS Industry Revenue (Million) Forecast, by Application 2019 & 2032
- Table 29: Saudi Arabia Electric Vehicle BMS Industry Revenue (Million) Forecast, by Application 2019 & 2032
- Table 30: Rest of Middle East and Africa Electric Vehicle BMS Industry Revenue (Million) Forecast, by Application 2019 & 2032
- Table 31: Global Electric Vehicle BMS Industry Revenue Million Forecast, by Components 2019 & 2032
- Table 32: Global Electric Vehicle BMS Industry Revenue Million Forecast, by Propulsion Type 2019 & 2032
- Table 33: Global Electric Vehicle BMS Industry Revenue Million Forecast, by Vehicle Type 2019 & 2032
- Table 34: Global Electric Vehicle BMS Industry Revenue Million Forecast, by Country 2019 & 2032
- Table 35: United States Electric Vehicle BMS Industry Revenue (Million) Forecast, by Application 2019 & 2032
- Table 36: Canada Electric Vehicle BMS Industry Revenue (Million) Forecast, by Application 2019 & 2032
- Table 37: Rest of North America Electric Vehicle BMS Industry Revenue (Million) Forecast, by Application 2019 & 2032
- Table 38: Global Electric Vehicle BMS Industry Revenue Million Forecast, by Components 2019 & 2032
- Table 39: Global Electric Vehicle BMS Industry Revenue Million Forecast, by Propulsion Type 2019 & 2032
- Table 40: Global Electric Vehicle BMS Industry Revenue Million Forecast, by Vehicle Type 2019 & 2032
- Table 41: Global Electric Vehicle BMS Industry Revenue Million Forecast, by Country 2019 & 2032
- Table 42: Germany Electric Vehicle BMS Industry Revenue (Million) Forecast, by Application 2019 & 2032
- Table 43: United Kingdom Electric Vehicle BMS Industry Revenue (Million) Forecast, by Application 2019 & 2032
- Table 44: France Electric Vehicle BMS Industry Revenue (Million) Forecast, by Application 2019 & 2032
- Table 45: Russia Electric Vehicle BMS Industry Revenue (Million) Forecast, by Application 2019 & 2032
- Table 46: Spain Electric Vehicle BMS Industry Revenue (Million) Forecast, by Application 2019 & 2032
- Table 47: Rest of Europe Electric Vehicle BMS Industry Revenue (Million) Forecast, by Application 2019 & 2032
- Table 48: Global Electric Vehicle BMS Industry Revenue Million Forecast, by Components 2019 & 2032
- Table 49: Global Electric Vehicle BMS Industry Revenue Million Forecast, by Propulsion Type 2019 & 2032
- Table 50: Global Electric Vehicle BMS Industry Revenue Million Forecast, by Vehicle Type 2019 & 2032
- Table 51: Global Electric Vehicle BMS Industry Revenue Million Forecast, by Country 2019 & 2032
- Table 52: China Electric Vehicle BMS Industry Revenue (Million) Forecast, by Application 2019 & 2032
- Table 53: India Electric Vehicle BMS Industry Revenue (Million) Forecast, by Application 2019 & 2032
- Table 54: Japan Electric Vehicle BMS Industry Revenue (Million) Forecast, by Application 2019 & 2032
- Table 55: South Korea Electric Vehicle BMS Industry Revenue (Million) Forecast, by Application 2019 & 2032
- Table 56: Rest of Asia Pacific Electric Vehicle BMS Industry Revenue (Million) Forecast, by Application 2019 & 2032
- Table 57: Global Electric Vehicle BMS Industry Revenue Million Forecast, by Components 2019 & 2032
- Table 58: Global Electric Vehicle BMS Industry Revenue Million Forecast, by Propulsion Type 2019 & 2032
- Table 59: Global Electric Vehicle BMS Industry Revenue Million Forecast, by Vehicle Type 2019 & 2032
- Table 60: Global Electric Vehicle BMS Industry Revenue Million Forecast, by Country 2019 & 2032
- Table 61: Brazil Electric Vehicle BMS Industry Revenue (Million) Forecast, by Application 2019 & 2032
- Table 62: Argentina Electric Vehicle BMS Industry Revenue (Million) Forecast, by Application 2019 & 2032
- Table 63: Rest of South America Electric Vehicle BMS Industry Revenue (Million) Forecast, by Application 2019 & 2032
- Table 64: Global Electric Vehicle BMS Industry Revenue Million Forecast, by Components 2019 & 2032
- Table 65: Global Electric Vehicle BMS Industry Revenue Million Forecast, by Propulsion Type 2019 & 2032
- Table 66: Global Electric Vehicle BMS Industry Revenue Million Forecast, by Vehicle Type 2019 & 2032
- Table 67: Global Electric Vehicle BMS Industry Revenue Million Forecast, by Country 2019 & 2032
- Table 68: United Arab Emirates Electric Vehicle BMS Industry Revenue (Million) Forecast, by Application 2019 & 2032
- Table 69: Saudi Arabia Electric Vehicle BMS Industry Revenue (Million) Forecast, by Application 2019 & 2032
- Table 70: Rest of Middle East and Africa Electric Vehicle BMS Industry Revenue (Million) Forecast, by Application 2019 & 2032
Frequently Asked Questions
1. What is the projected Compound Annual Growth Rate (CAGR) of the Electric Vehicle BMS Industry?
The projected CAGR is approximately 33.76%.
2. Which companies are prominent players in the Electric Vehicle BMS Industry?
Key companies in the market include Infineon Technologies AG, Silicon Laboratories, Visteon Corporatio, Vitesco Technologies, Keihin Corporation, TE Connectivity, NXP Semiconductors, Renesas Electronics Corporation, Texas Instruments Incorporated, Analog Devices Inc.
3. What are the main segments of the Electric Vehicle BMS Industry?
The market segments include Components, Propulsion Type, Vehicle Type.
4. Can you provide details about the market size?
The market size is estimated to be USD 11.78 Million as of 2022.
5. What are some drivers contributing to market growth?
Potential Shift Toward Adoption of Electric Buses to Drive the Market.
6. What are the notable trends driving market growth?
Battery Electric Vehicle Segment Anticipated to Dominate the Market.
7. Are there any restraints impacting market growth?
Lack of Electric Charging Infrastructure May Hamper the Growth of the Market.
8. Can you provide examples of recent developments in the market?
In March 2023, TBK Co., Ltd. and Mikuni Corporation signed a joint development agreement in the field of commercial vehicle thermal management. The two companies will establish a team for the development of the most suitable thermal management system and related parts for commercial electric vehicles (EVs).
9. What pricing options are available for accessing the report?
Pricing options include single-user, multi-user, and enterprise licenses priced at USD 4750, USD 5250, and USD 8750 respectively.
10. Is the market size provided in terms of value or volume?
The market size is provided in terms of value, measured in Million.
11. Are there any specific market keywords associated with the report?
Yes, the market keyword associated with the report is "Electric Vehicle BMS Industry," which aids in identifying and referencing the specific market segment covered.
12. How do I determine which pricing option suits my needs best?
The pricing options vary based on user requirements and access needs. Individual users may opt for single-user licenses, while businesses requiring broader access may choose multi-user or enterprise licenses for cost-effective access to the report.
13. Are there any additional resources or data provided in the Electric Vehicle BMS Industry report?
While the report offers comprehensive insights, it's advisable to review the specific contents or supplementary materials provided to ascertain if additional resources or data are available.
14. How can I stay updated on further developments or reports in the Electric Vehicle BMS Industry?
To stay informed about further developments, trends, and reports in the Electric Vehicle BMS Industry, consider subscribing to industry newsletters, following relevant companies and organizations, or regularly checking reputable industry news sources and publications.
Methodology
Step 1 - Identification of Relevant Samples Size from Population Database


Step 2 - Approaches for Defining Global Market Size (Value, Volume* & Price*)

Note*: In applicable scenarios
Step 3 - Data Sources
Primary Research
- Web Analytics
- Survey Reports
- Research Institute
- Latest Research Reports
- Opinion Leaders
Secondary Research
- Annual Reports
- White Paper
- Latest Press Release
- Industry Association
- Paid Database
- Investor Presentations

Step 4 - Data Triangulation
Involves using different sources of information in order to increase the validity of a study
These sources are likely to be stakeholders in a program - participants, other researchers, program staff, other community members, and so on.
Then we put all data in single framework & apply various statistical tools to find out the dynamic on the market.
During the analysis stage, feedback from the stakeholder groups would be compared to determine areas of agreement as well as areas of divergence


