

Key Insights
The global Electronic Power Meter market is poised for significant expansion, projected to reach USD 8.01 billion in 2025, driven by a robust Compound Annual Growth Rate (CAGR) of 5.35% through 2033. This growth is primarily fueled by the escalating demand for advanced energy management solutions across various sectors. The increasing adoption of smart grids, renewable energy integration, and the proliferation of IoT-enabled devices are key accelerators for the market. Furthermore, stringent government regulations promoting energy efficiency and the need for accurate electricity consumption monitoring in both residential and commercial spaces are compelling drivers. The Industrial and Energy segments are expected to witness substantial uptake due to the critical role of power meters in optimizing energy usage, reducing operational costs, and ensuring grid stability. The trend towards digitalization and the development of sophisticated meter technologies, including bi-directional metering and advanced communication capabilities, are further shaping the market landscape.
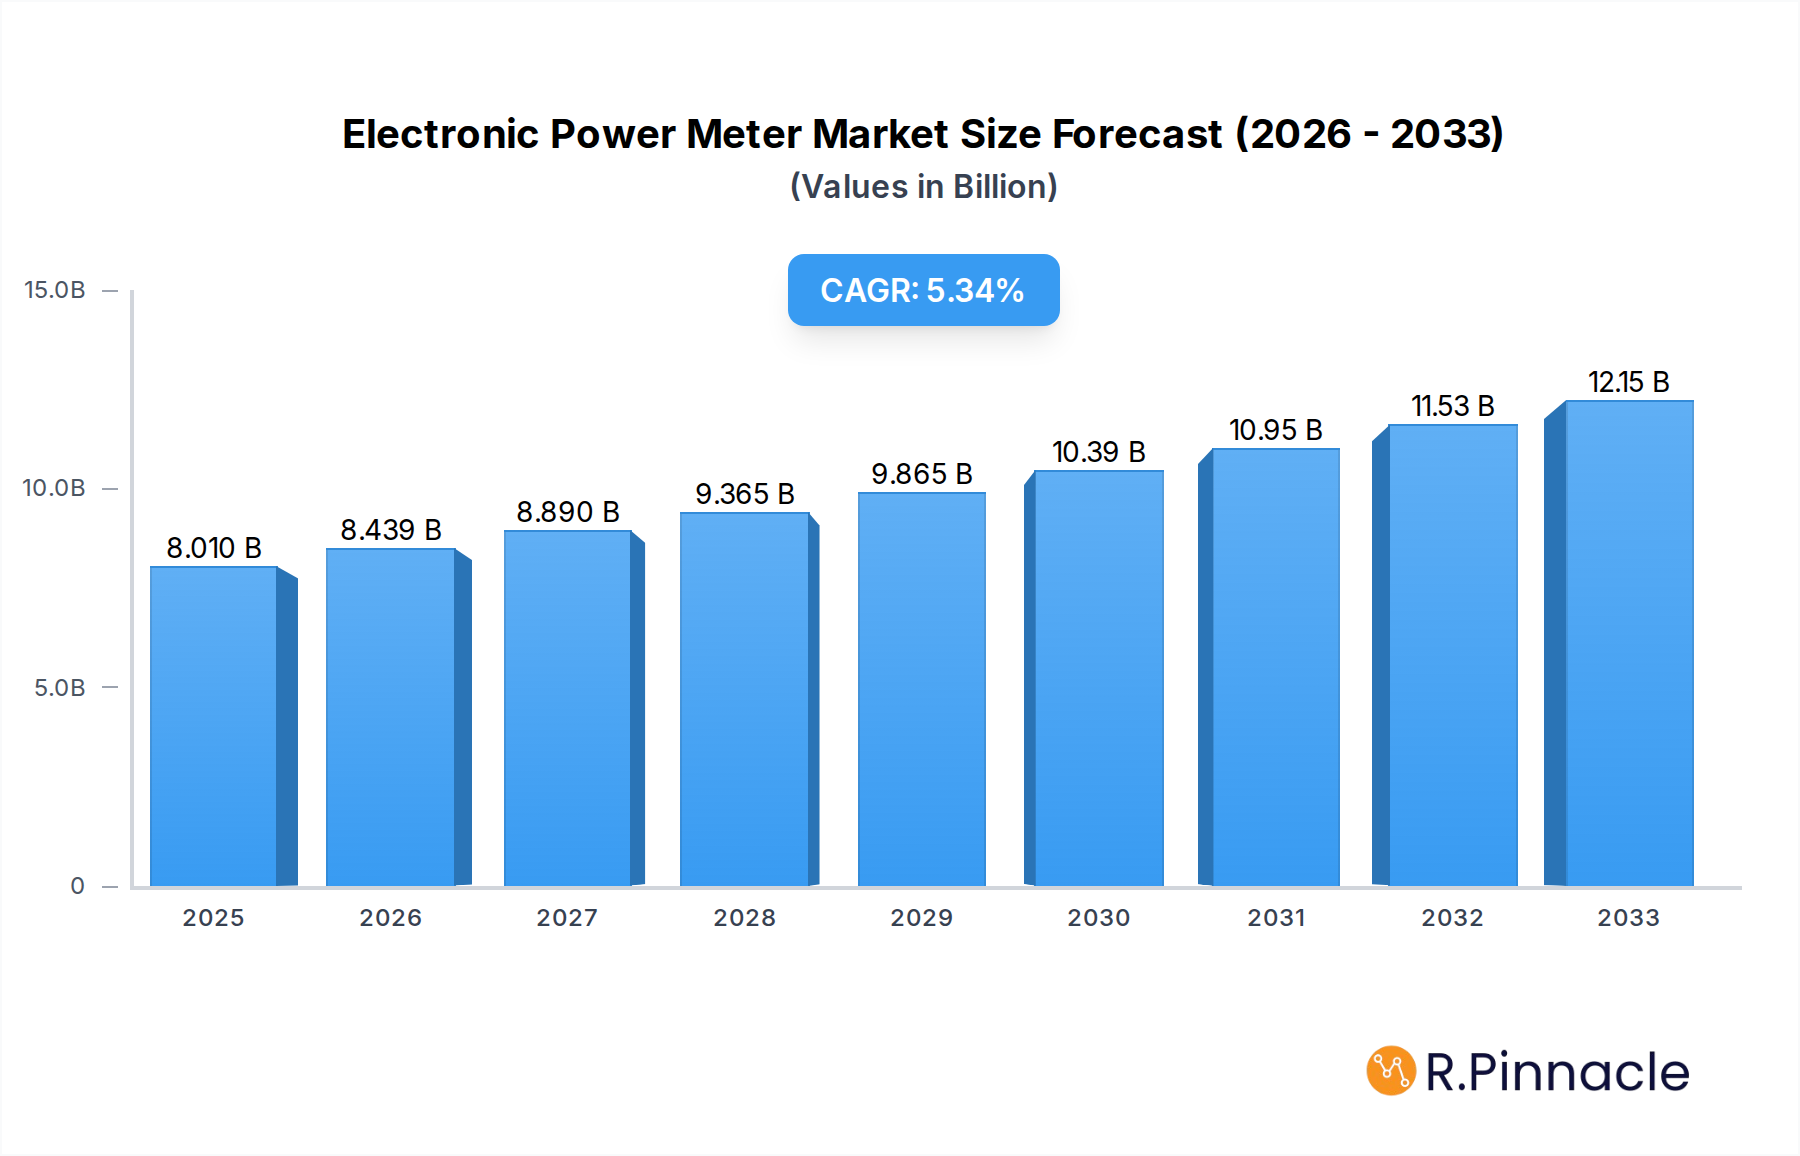
Electronic Power Meter Market Size (In Billion)
While the market presents a positive outlook, certain restraints could influence its trajectory. The high initial investment costs associated with deploying advanced electronic power meters and the complexities involved in upgrading existing infrastructure may pose challenges. Additionally, concerns regarding data security and privacy associated with smart metering systems could slow down adoption in some regions. However, these challenges are likely to be offset by ongoing technological advancements and the continuous efforts by market players to offer cost-effective and secure solutions. The market is segmented into Simplex, Biphasic, and Three-phase types, catering to diverse energy metering needs. Key players like TE Connectivity, Landis Gyr, Itron, and Siemens are at the forefront of innovation, introducing smart and connected metering solutions that are vital for the evolution of the modern energy infrastructure.

Electronic Power Meter Company Market Share
This in-depth report offers a granular examination of the global Electronic Power Meter market, projecting its trajectory from 2019 to 2033. We delve into market structure, dynamics, regional dominance, product innovations, and the strategic landscape, providing actionable insights for stakeholders. Our analysis covers the Electronic Power Meter industry's evolution, driven by advancements in smart grid technology, IoT integration, and the increasing demand for precise energy monitoring. This report is essential for power meter manufacturers, utility companies, energy management solution providers, and investors seeking to understand and capitalize on this dynamic market.
Electronic Power Meter Market Structure & Innovation Trends
The Electronic Power Meter market exhibits a moderately consolidated structure, with key players like TE Connectivity, Landis Gyr, Itron, INT, Siemens, Eaton, ABB, SUNTREE, XJ Info, TOPRIE, HYCON Technology, and Shanghai Instrument Group holding significant market share, estimated to be over $30 billion in 2025. Innovation is a primary driver, fueled by the integration of advanced metering infrastructure (AMI), two-way communication capabilities, and data analytics for improved grid management. Regulatory frameworks, particularly those promoting energy efficiency and smart metering adoption, are shaping market entry and product development. While direct substitutes are limited, improvements in traditional metering technologies and the emergence of decentralized energy solutions present indirect competition. End-user demographics are increasingly diverse, encompassing residential, commercial, and industrial sectors, each with distinct needs and adoption rates. Mergers and acquisitions (M&A) are anticipated to continue, with an estimated $5 billion in deal values by 2025, as companies seek to expand their product portfolios and geographical reach.
Electronic Power Meter Market Dynamics & Trends
The Electronic Power Meter market is experiencing robust growth, propelled by an escalating global demand for efficient energy management and the imperative to reduce energy wastage. Technological advancements are at the forefront, with the widespread integration of Internet of Things (IoT) capabilities enabling remote monitoring, predictive maintenance, and real-time data analytics. This shift towards smart metering is a significant catalyst, enhancing grid reliability and facilitating the seamless integration of renewable energy sources. Consumer preferences are increasingly leaning towards solutions that offer transparency in energy consumption and cost savings, further driving the adoption of advanced electronic power meters. The competitive landscape is characterized by intense innovation, with leading companies continuously introducing sophisticated meters equipped with features like cybersecurity, advanced communication protocols (e.g., PLC, RF, Cellular), and enhanced data logging capabilities. The market penetration of smart meters is projected to reach over 70% by 2025, with an estimated Compound Annual Growth Rate (CAGR) of approximately 7.5% during the forecast period of 2025–2033. This sustained growth is underpinned by supportive government policies and utility mandates aimed at modernizing energy infrastructure and optimizing resource allocation. The increasing complexity of energy grids, the rise of electric vehicles (EVs) requiring accurate charging monitoring, and the growing adoption of smart home devices further amplify the demand for precise and intelligent power measurement solutions. Furthermore, the evolving energy market, with its emphasis on demand-side management and grid balancing, necessitates sophisticated metering technology that can provide granular data for effective control and optimization.
Dominant Regions & Segments in Electronic Power Meter
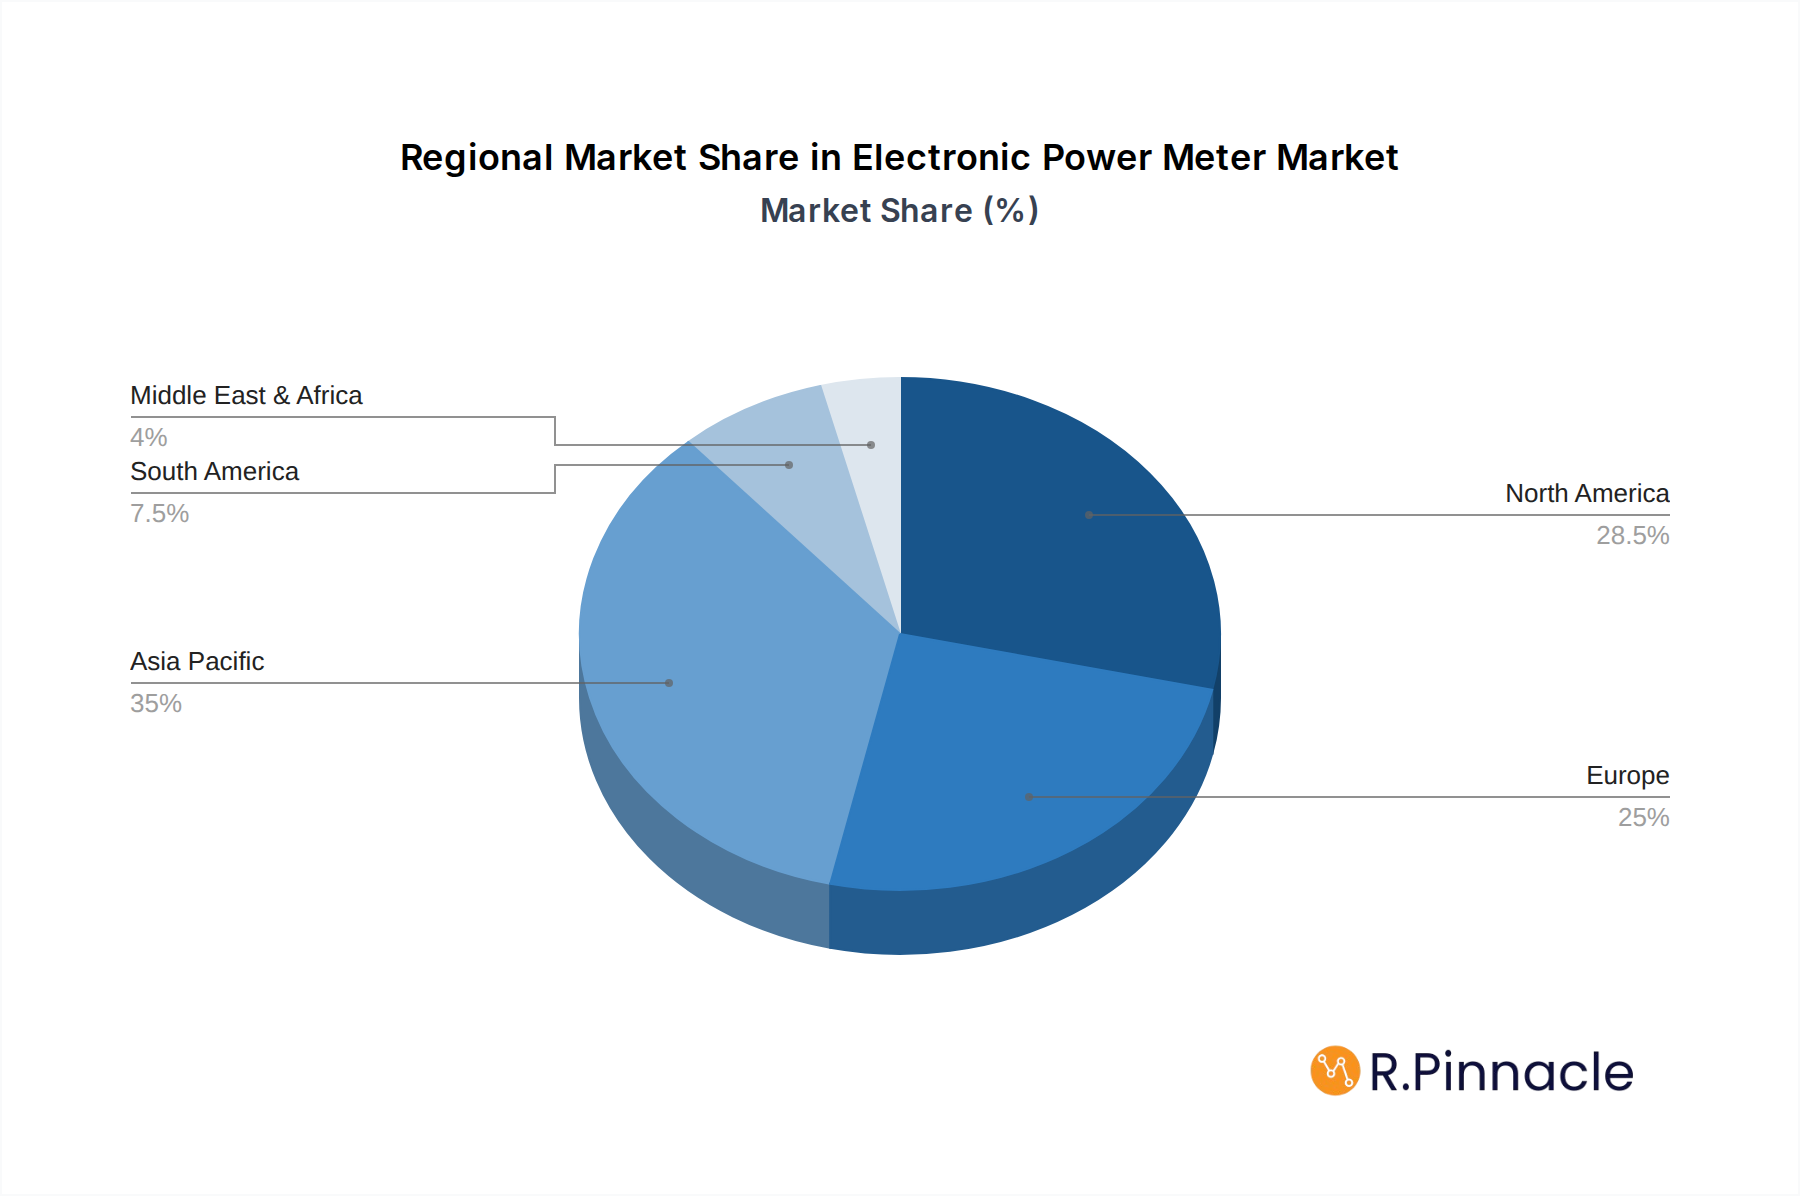
North America is emerging as a dominant region in the Electronic Power Meter market, primarily driven by proactive government initiatives promoting smart grid deployment and energy efficiency programs. The United States, with its extensive infrastructure upgrades and substantial investments in AMI, is a key contributor to this regional dominance. Stringent environmental regulations and a strong emphasis on reducing carbon footprints further incentivize the adoption of advanced metering solutions across residential, commercial, and industrial sectors.
- Key Drivers in North America:
- Government Policies & Incentives: Federal and state-level programs supporting smart grid development and renewable energy integration.
- Infrastructure Modernization: Significant investments by utility companies in upgrading existing power grids with smart technologies.
- Consumer Demand for Energy Efficiency: Growing awareness and preference for solutions that help manage energy consumption and reduce utility bills.
- Technological Adoption: High receptiveness to new technologies like IoT and data analytics for energy management.
In terms of application segments, the Industrial sector is exhibiting substantial growth, driven by the need for precise energy consumption monitoring for operational efficiency, cost optimization, and compliance with industrial regulations. Large manufacturing facilities, data centers, and heavy industries are increasingly investing in advanced electronic power meters to gain granular insights into their energy usage patterns and identify areas for improvement.
- Dominance Analysis - Industrial Application:
The industrial segment's dominance is fueled by the sheer volume of energy consumed by these operations. Companies are leveraging electronic power meters to:
- Optimize Production Processes: Identifying energy-intensive stages of production to implement efficiency measures.
- Predictive Maintenance: Monitoring power fluctuations to anticipate equipment failures and minimize downtime.
- Cost Reduction: Accurately allocating energy costs across different production lines or departments.
- Regulatory Compliance: Meeting reporting requirements for energy consumption and carbon emissions.
Among the types of electronic power meters, Three-phase meters are commanding the largest market share. This is directly attributable to their widespread deployment in industrial and commercial settings, where three-phase power is the standard for high-capacity machinery and large-scale operations. The increasing complexity of industrial power systems necessitates the advanced capabilities offered by three-phase electronic power meters for accurate measurement and robust performance.
- Dominance Analysis - Three-phase Type:
Three-phase meters are indispensable for:
- Industrial Machinery: Powering large motors, pumps, and other equipment.
- Commercial Buildings: Supplying electricity to large HVAC systems, elevators, and other high-demand appliances.
- Power Quality Monitoring: Providing detailed insights into voltage, current, and phase imbalances, crucial for maintaining grid stability.
- Integration with Smart Grids: Essential for managing complex energy flows in industrial and commercial power networks.
Electronic Power Meter Product Innovations
Product innovations in the Electronic Power Meter market are centered around enhanced connectivity, data analytics, and security. The integration of IoT protocols is enabling meters to communicate seamlessly with cloud platforms, providing real-time energy usage data for consumers and utility providers. Advanced features such as remote firmware updates, predictive failure analysis, and sophisticated cybersecurity measures are becoming standard. These innovations offer competitive advantages by improving accuracy, reliability, and user experience, meeting the growing demand for intelligent energy management solutions.
Report Scope & Segmentation Analysis
This report provides a comprehensive market segmentation analysis of the Electronic Power Meter market across key categories including Application and Type.
Application Segments:
- Electronic: This segment focuses on the application of electronic power meters in areas like consumer electronics manufacturing and testing, where precise power monitoring is crucial for product quality and development.
- Industrial: Encompassing manufacturing facilities, data centers, and heavy industries, this segment highlights the demand for robust metering solutions to optimize energy consumption and operational efficiency. Growth is projected to be robust, driven by industrial automation and energy management initiatives.
- Energy: This segment covers the application of meters within the energy sector itself, including power generation, transmission, and distribution, as well as renewable energy integration. The increasing complexity of grid management and the shift towards smart grids will fuel growth in this segment.
- Others: This includes various niche applications such as smart homes, electric vehicle charging infrastructure, and specialized testing equipment, representing a growing segment with increasing adoption rates.
Type Segments:
- Simplex: Primarily used in residential and small commercial settings, these meters measure single-phase power. While foundational, their growth is tempered by the rapid adoption of more advanced types.
- Biphasic: These meters are designed for specific applications requiring two phases of power. Their market share is smaller compared to simplex and three-phase meters, with growth tied to specialized installations.
- Three-phase: Dominant in industrial and large commercial applications, these meters are critical for high-power demand. Their market size is substantial, and growth is expected to remain strong due to industrial expansion and grid modernization efforts.
Key Drivers of Electronic Power Meter Growth
The Electronic Power Meter market is propelled by several significant growth drivers. Technological advancements, particularly the integration of IoT and AI, are enabling smarter grid management and enhanced data analytics. Government policies and regulations promoting energy efficiency, renewable energy integration, and smart grid adoption are creating a favorable market environment. The increasing global energy demand coupled with the need for cost optimization and reduction of energy wastage across residential, commercial, and industrial sectors further fuels market expansion. The growing deployment of smart grids and the rise of electric vehicle (EV) charging infrastructure are also significant accelerators.
Challenges in the Electronic Power Meter Sector
Despite robust growth, the Electronic Power Meter sector faces several challenges. High initial investment costs for advanced metering infrastructure can be a barrier for some utilities and businesses. Cybersecurity threats and the need for robust data protection are paramount concerns, requiring continuous innovation and vigilance. Interoperability issues between different vendor systems and legacy infrastructure can hinder seamless integration. Regulatory complexities and varying standards across different regions can also pose challenges for market entry and product standardization. Furthermore, skilled labor shortages for installation and maintenance of advanced systems can impact deployment speed.
Emerging Opportunities in Electronic Power Meter
Emerging opportunities within the Electronic Power Meter market are vast and diverse. The expansion of smart home ecosystems presents a significant avenue for growth, with consumers demanding more granular control over their energy consumption. The rapid growth of electric vehicle (EV) adoption is creating a substantial need for smart EV charging meters that can accurately measure and manage charging loads. The increasing adoption of decentralized renewable energy sources, such as solar and wind power, necessitates advanced metering solutions for effective grid integration and bi-directional energy flow management. Furthermore, the development of predictive analytics and AI-powered energy management platforms leveraging meter data offers significant value-added services and revenue streams.
Leading Players in the Electronic Power Meter Market
- TE Connectivity
- Landis Gyr
- Itron
- INT
- Siemens
- Eaton
- ABB
- SUNTREE
- XJ Info
- TOPRIE
- HYCON Technology
- Shanghai Instrument Group
Key Developments in Electronic Power Meter Industry
- 2023/11: Siemens announced the launch of a new generation of smart meters with enhanced cybersecurity features.
- 2023/09: Landis Gyr acquired a leading provider of grid analytics software, expanding its data management capabilities.
- 2023/07: Eaton unveiled its latest smart grid solutions, including advanced electronic power meters for renewable energy integration.
- 2023/04: Itron showcased its new IoT-enabled meters designed for enhanced communication and real-time data transmission.
- 2022/12: TE Connectivity introduced a range of compact and robust electronic power meters for challenging industrial environments.
- 2022/10: ABB partnered with a major utility to deploy thousands of smart meters as part of a grid modernization project.
- 2022/08: SUNTREE expanded its product line with advanced three-phase smart meters featuring remote diagnostics.
Future Outlook for Electronic Power Meter Market
The future outlook for the Electronic Power Meter market remains exceptionally bright, characterized by sustained innovation and expanding applications. The continued integration of smart grid technologies, coupled with advancements in data analytics and artificial intelligence, will drive the development of more intelligent and efficient energy management systems. The escalating demand for renewable energy integration, the burgeoning electric vehicle market, and the increasing focus on energy efficiency and sustainability will further accelerate market growth. Strategic investments in R&D, focus on cybersecurity, and expansion into emerging markets are expected to define the competitive landscape, offering substantial opportunities for market players to capitalize on the evolving energy sector.
Electronic Power Meter Segmentation
-
1. Application
- 1.1. Electronic
- 1.2. Industrial
- 1.3. Energy
- 1.4. Others
-
2. Types
- 2.1. Simplex
- 2.2. Biphasic
- 2.3. Three-phase
Electronic Power Meter Segmentation By Geography
-
1. North America
- 1.1. United States
- 1.2. Canada
- 1.3. Mexico
-
2. South America
- 2.1. Brazil
- 2.2. Argentina
- 2.3. Rest of South America
-
3. Europe
- 3.1. United Kingdom
- 3.2. Germany
- 3.3. France
- 3.4. Italy
- 3.5. Spain
- 3.6. Russia
- 3.7. Benelux
- 3.8. Nordics
- 3.9. Rest of Europe
-
4. Middle East & Africa
- 4.1. Turkey
- 4.2. Israel
- 4.3. GCC
- 4.4. North Africa
- 4.5. South Africa
- 4.6. Rest of Middle East & Africa
-
5. Asia Pacific
- 5.1. China
- 5.2. India
- 5.3. Japan
- 5.4. South Korea
- 5.5. ASEAN
- 5.6. Oceania
- 5.7. Rest of Asia Pacific
Electronic Power Meter Regional Market Share
Geographic Coverage of Electronic Power Meter
Electronic Power Meter REPORT HIGHLIGHTS
| Aspects | Details |
|---|---|
| Study Period | 2020-2034 |
| Base Year | 2025 |
| Estimated Year | 2026 |
| Forecast Period | 2026-2034 |
| Historical Period | 2020-2025 |
| Growth Rate | CAGR of 5.35% from 2020-2034 |
| Segmentation |
|
Table of Contents
- 1. Introduction
- 1.1. Research Scope
- 1.2. Market Segmentation
- 1.3. Research Methodology
- 1.4. Definitions and Assumptions
- 2. Executive Summary
- 2.1. Introduction
- 3. Market Dynamics
- 3.1. Introduction
- 3.2. Market Drivers
- 3.3. Market Restrains
- 3.4. Market Trends
- 4. Market Factor Analysis
- 4.1. Porters Five Forces
- 4.2. Supply/Value Chain
- 4.3. PESTEL analysis
- 4.4. Market Entropy
- 4.5. Patent/Trademark Analysis
- 5. Global Electronic Power Meter Analysis, Insights and Forecast, 2020-2032
- 5.1. Market Analysis, Insights and Forecast - by Application
- 5.1.1. Electronic
- 5.1.2. Industrial
- 5.1.3. Energy
- 5.1.4. Others
- 5.2. Market Analysis, Insights and Forecast - by Types
- 5.2.1. Simplex
- 5.2.2. Biphasic
- 5.2.3. Three-phase
- 5.3. Market Analysis, Insights and Forecast - by Region
- 5.3.1. North America
- 5.3.2. South America
- 5.3.3. Europe
- 5.3.4. Middle East & Africa
- 5.3.5. Asia Pacific
- 5.1. Market Analysis, Insights and Forecast - by Application
- 6. North America Electronic Power Meter Analysis, Insights and Forecast, 2020-2032
- 6.1. Market Analysis, Insights and Forecast - by Application
- 6.1.1. Electronic
- 6.1.2. Industrial
- 6.1.3. Energy
- 6.1.4. Others
- 6.2. Market Analysis, Insights and Forecast - by Types
- 6.2.1. Simplex
- 6.2.2. Biphasic
- 6.2.3. Three-phase
- 6.1. Market Analysis, Insights and Forecast - by Application
- 7. South America Electronic Power Meter Analysis, Insights and Forecast, 2020-2032
- 7.1. Market Analysis, Insights and Forecast - by Application
- 7.1.1. Electronic
- 7.1.2. Industrial
- 7.1.3. Energy
- 7.1.4. Others
- 7.2. Market Analysis, Insights and Forecast - by Types
- 7.2.1. Simplex
- 7.2.2. Biphasic
- 7.2.3. Three-phase
- 7.1. Market Analysis, Insights and Forecast - by Application
- 8. Europe Electronic Power Meter Analysis, Insights and Forecast, 2020-2032
- 8.1. Market Analysis, Insights and Forecast - by Application
- 8.1.1. Electronic
- 8.1.2. Industrial
- 8.1.3. Energy
- 8.1.4. Others
- 8.2. Market Analysis, Insights and Forecast - by Types
- 8.2.1. Simplex
- 8.2.2. Biphasic
- 8.2.3. Three-phase
- 8.1. Market Analysis, Insights and Forecast - by Application
- 9. Middle East & Africa Electronic Power Meter Analysis, Insights and Forecast, 2020-2032
- 9.1. Market Analysis, Insights and Forecast - by Application
- 9.1.1. Electronic
- 9.1.2. Industrial
- 9.1.3. Energy
- 9.1.4. Others
- 9.2. Market Analysis, Insights and Forecast - by Types
- 9.2.1. Simplex
- 9.2.2. Biphasic
- 9.2.3. Three-phase
- 9.1. Market Analysis, Insights and Forecast - by Application
- 10. Asia Pacific Electronic Power Meter Analysis, Insights and Forecast, 2020-2032
- 10.1. Market Analysis, Insights and Forecast - by Application
- 10.1.1. Electronic
- 10.1.2. Industrial
- 10.1.3. Energy
- 10.1.4. Others
- 10.2. Market Analysis, Insights and Forecast - by Types
- 10.2.1. Simplex
- 10.2.2. Biphasic
- 10.2.3. Three-phase
- 10.1. Market Analysis, Insights and Forecast - by Application
- 11. Competitive Analysis
- 11.1. Global Market Share Analysis 2025
- 11.2. Company Profiles
- 11.2.1 TE Connectivity
- 11.2.1.1. Overview
- 11.2.1.2. Products
- 11.2.1.3. SWOT Analysis
- 11.2.1.4. Recent Developments
- 11.2.1.5. Financials (Based on Availability)
- 11.2.2 Landis Gyr
- 11.2.2.1. Overview
- 11.2.2.2. Products
- 11.2.2.3. SWOT Analysis
- 11.2.2.4. Recent Developments
- 11.2.2.5. Financials (Based on Availability)
- 11.2.3 Itron
- 11.2.3.1. Overview
- 11.2.3.2. Products
- 11.2.3.3. SWOT Analysis
- 11.2.3.4. Recent Developments
- 11.2.3.5. Financials (Based on Availability)
- 11.2.4 INT
- 11.2.4.1. Overview
- 11.2.4.2. Products
- 11.2.4.3. SWOT Analysis
- 11.2.4.4. Recent Developments
- 11.2.4.5. Financials (Based on Availability)
- 11.2.5 Siemens
- 11.2.5.1. Overview
- 11.2.5.2. Products
- 11.2.5.3. SWOT Analysis
- 11.2.5.4. Recent Developments
- 11.2.5.5. Financials (Based on Availability)
- 11.2.6 Eaton
- 11.2.6.1. Overview
- 11.2.6.2. Products
- 11.2.6.3. SWOT Analysis
- 11.2.6.4. Recent Developments
- 11.2.6.5. Financials (Based on Availability)
- 11.2.7 ABB
- 11.2.7.1. Overview
- 11.2.7.2. Products
- 11.2.7.3. SWOT Analysis
- 11.2.7.4. Recent Developments
- 11.2.7.5. Financials (Based on Availability)
- 11.2.8 SUNTREE
- 11.2.8.1. Overview
- 11.2.8.2. Products
- 11.2.8.3. SWOT Analysis
- 11.2.8.4. Recent Developments
- 11.2.8.5. Financials (Based on Availability)
- 11.2.9 XJ Info
- 11.2.9.1. Overview
- 11.2.9.2. Products
- 11.2.9.3. SWOT Analysis
- 11.2.9.4. Recent Developments
- 11.2.9.5. Financials (Based on Availability)
- 11.2.10 TOPRIE
- 11.2.10.1. Overview
- 11.2.10.2. Products
- 11.2.10.3. SWOT Analysis
- 11.2.10.4. Recent Developments
- 11.2.10.5. Financials (Based on Availability)
- 11.2.11 HYCON Technology
- 11.2.11.1. Overview
- 11.2.11.2. Products
- 11.2.11.3. SWOT Analysis
- 11.2.11.4. Recent Developments
- 11.2.11.5. Financials (Based on Availability)
- 11.2.12 Shanghai Instrument Group
- 11.2.12.1. Overview
- 11.2.12.2. Products
- 11.2.12.3. SWOT Analysis
- 11.2.12.4. Recent Developments
- 11.2.12.5. Financials (Based on Availability)
- 11.2.1 TE Connectivity
List of Figures
- Figure 1: Global Electronic Power Meter Revenue Breakdown (billion, %) by Region 2025 & 2033
- Figure 2: Global Electronic Power Meter Volume Breakdown (K, %) by Region 2025 & 2033
- Figure 3: North America Electronic Power Meter Revenue (billion), by Application 2025 & 2033
- Figure 4: North America Electronic Power Meter Volume (K), by Application 2025 & 2033
- Figure 5: North America Electronic Power Meter Revenue Share (%), by Application 2025 & 2033
- Figure 6: North America Electronic Power Meter Volume Share (%), by Application 2025 & 2033
- Figure 7: North America Electronic Power Meter Revenue (billion), by Types 2025 & 2033
- Figure 8: North America Electronic Power Meter Volume (K), by Types 2025 & 2033
- Figure 9: North America Electronic Power Meter Revenue Share (%), by Types 2025 & 2033
- Figure 10: North America Electronic Power Meter Volume Share (%), by Types 2025 & 2033
- Figure 11: North America Electronic Power Meter Revenue (billion), by Country 2025 & 2033
- Figure 12: North America Electronic Power Meter Volume (K), by Country 2025 & 2033
- Figure 13: North America Electronic Power Meter Revenue Share (%), by Country 2025 & 2033
- Figure 14: North America Electronic Power Meter Volume Share (%), by Country 2025 & 2033
- Figure 15: South America Electronic Power Meter Revenue (billion), by Application 2025 & 2033
- Figure 16: South America Electronic Power Meter Volume (K), by Application 2025 & 2033
- Figure 17: South America Electronic Power Meter Revenue Share (%), by Application 2025 & 2033
- Figure 18: South America Electronic Power Meter Volume Share (%), by Application 2025 & 2033
- Figure 19: South America Electronic Power Meter Revenue (billion), by Types 2025 & 2033
- Figure 20: South America Electronic Power Meter Volume (K), by Types 2025 & 2033
- Figure 21: South America Electronic Power Meter Revenue Share (%), by Types 2025 & 2033
- Figure 22: South America Electronic Power Meter Volume Share (%), by Types 2025 & 2033
- Figure 23: South America Electronic Power Meter Revenue (billion), by Country 2025 & 2033
- Figure 24: South America Electronic Power Meter Volume (K), by Country 2025 & 2033
- Figure 25: South America Electronic Power Meter Revenue Share (%), by Country 2025 & 2033
- Figure 26: South America Electronic Power Meter Volume Share (%), by Country 2025 & 2033
- Figure 27: Europe Electronic Power Meter Revenue (billion), by Application 2025 & 2033
- Figure 28: Europe Electronic Power Meter Volume (K), by Application 2025 & 2033
- Figure 29: Europe Electronic Power Meter Revenue Share (%), by Application 2025 & 2033
- Figure 30: Europe Electronic Power Meter Volume Share (%), by Application 2025 & 2033
- Figure 31: Europe Electronic Power Meter Revenue (billion), by Types 2025 & 2033
- Figure 32: Europe Electronic Power Meter Volume (K), by Types 2025 & 2033
- Figure 33: Europe Electronic Power Meter Revenue Share (%), by Types 2025 & 2033
- Figure 34: Europe Electronic Power Meter Volume Share (%), by Types 2025 & 2033
- Figure 35: Europe Electronic Power Meter Revenue (billion), by Country 2025 & 2033
- Figure 36: Europe Electronic Power Meter Volume (K), by Country 2025 & 2033
- Figure 37: Europe Electronic Power Meter Revenue Share (%), by Country 2025 & 2033
- Figure 38: Europe Electronic Power Meter Volume Share (%), by Country 2025 & 2033
- Figure 39: Middle East & Africa Electronic Power Meter Revenue (billion), by Application 2025 & 2033
- Figure 40: Middle East & Africa Electronic Power Meter Volume (K), by Application 2025 & 2033
- Figure 41: Middle East & Africa Electronic Power Meter Revenue Share (%), by Application 2025 & 2033
- Figure 42: Middle East & Africa Electronic Power Meter Volume Share (%), by Application 2025 & 2033
- Figure 43: Middle East & Africa Electronic Power Meter Revenue (billion), by Types 2025 & 2033
- Figure 44: Middle East & Africa Electronic Power Meter Volume (K), by Types 2025 & 2033
- Figure 45: Middle East & Africa Electronic Power Meter Revenue Share (%), by Types 2025 & 2033
- Figure 46: Middle East & Africa Electronic Power Meter Volume Share (%), by Types 2025 & 2033
- Figure 47: Middle East & Africa Electronic Power Meter Revenue (billion), by Country 2025 & 2033
- Figure 48: Middle East & Africa Electronic Power Meter Volume (K), by Country 2025 & 2033
- Figure 49: Middle East & Africa Electronic Power Meter Revenue Share (%), by Country 2025 & 2033
- Figure 50: Middle East & Africa Electronic Power Meter Volume Share (%), by Country 2025 & 2033
- Figure 51: Asia Pacific Electronic Power Meter Revenue (billion), by Application 2025 & 2033
- Figure 52: Asia Pacific Electronic Power Meter Volume (K), by Application 2025 & 2033
- Figure 53: Asia Pacific Electronic Power Meter Revenue Share (%), by Application 2025 & 2033
- Figure 54: Asia Pacific Electronic Power Meter Volume Share (%), by Application 2025 & 2033
- Figure 55: Asia Pacific Electronic Power Meter Revenue (billion), by Types 2025 & 2033
- Figure 56: Asia Pacific Electronic Power Meter Volume (K), by Types 2025 & 2033
- Figure 57: Asia Pacific Electronic Power Meter Revenue Share (%), by Types 2025 & 2033
- Figure 58: Asia Pacific Electronic Power Meter Volume Share (%), by Types 2025 & 2033
- Figure 59: Asia Pacific Electronic Power Meter Revenue (billion), by Country 2025 & 2033
- Figure 60: Asia Pacific Electronic Power Meter Volume (K), by Country 2025 & 2033
- Figure 61: Asia Pacific Electronic Power Meter Revenue Share (%), by Country 2025 & 2033
- Figure 62: Asia Pacific Electronic Power Meter Volume Share (%), by Country 2025 & 2033
List of Tables
- Table 1: Global Electronic Power Meter Revenue billion Forecast, by Application 2020 & 2033
- Table 2: Global Electronic Power Meter Volume K Forecast, by Application 2020 & 2033
- Table 3: Global Electronic Power Meter Revenue billion Forecast, by Types 2020 & 2033
- Table 4: Global Electronic Power Meter Volume K Forecast, by Types 2020 & 2033
- Table 5: Global Electronic Power Meter Revenue billion Forecast, by Region 2020 & 2033
- Table 6: Global Electronic Power Meter Volume K Forecast, by Region 2020 & 2033
- Table 7: Global Electronic Power Meter Revenue billion Forecast, by Application 2020 & 2033
- Table 8: Global Electronic Power Meter Volume K Forecast, by Application 2020 & 2033
- Table 9: Global Electronic Power Meter Revenue billion Forecast, by Types 2020 & 2033
- Table 10: Global Electronic Power Meter Volume K Forecast, by Types 2020 & 2033
- Table 11: Global Electronic Power Meter Revenue billion Forecast, by Country 2020 & 2033
- Table 12: Global Electronic Power Meter Volume K Forecast, by Country 2020 & 2033
- Table 13: United States Electronic Power Meter Revenue (billion) Forecast, by Application 2020 & 2033
- Table 14: United States Electronic Power Meter Volume (K) Forecast, by Application 2020 & 2033
- Table 15: Canada Electronic Power Meter Revenue (billion) Forecast, by Application 2020 & 2033
- Table 16: Canada Electronic Power Meter Volume (K) Forecast, by Application 2020 & 2033
- Table 17: Mexico Electronic Power Meter Revenue (billion) Forecast, by Application 2020 & 2033
- Table 18: Mexico Electronic Power Meter Volume (K) Forecast, by Application 2020 & 2033
- Table 19: Global Electronic Power Meter Revenue billion Forecast, by Application 2020 & 2033
- Table 20: Global Electronic Power Meter Volume K Forecast, by Application 2020 & 2033
- Table 21: Global Electronic Power Meter Revenue billion Forecast, by Types 2020 & 2033
- Table 22: Global Electronic Power Meter Volume K Forecast, by Types 2020 & 2033
- Table 23: Global Electronic Power Meter Revenue billion Forecast, by Country 2020 & 2033
- Table 24: Global Electronic Power Meter Volume K Forecast, by Country 2020 & 2033
- Table 25: Brazil Electronic Power Meter Revenue (billion) Forecast, by Application 2020 & 2033
- Table 26: Brazil Electronic Power Meter Volume (K) Forecast, by Application 2020 & 2033
- Table 27: Argentina Electronic Power Meter Revenue (billion) Forecast, by Application 2020 & 2033
- Table 28: Argentina Electronic Power Meter Volume (K) Forecast, by Application 2020 & 2033
- Table 29: Rest of South America Electronic Power Meter Revenue (billion) Forecast, by Application 2020 & 2033
- Table 30: Rest of South America Electronic Power Meter Volume (K) Forecast, by Application 2020 & 2033
- Table 31: Global Electronic Power Meter Revenue billion Forecast, by Application 2020 & 2033
- Table 32: Global Electronic Power Meter Volume K Forecast, by Application 2020 & 2033
- Table 33: Global Electronic Power Meter Revenue billion Forecast, by Types 2020 & 2033
- Table 34: Global Electronic Power Meter Volume K Forecast, by Types 2020 & 2033
- Table 35: Global Electronic Power Meter Revenue billion Forecast, by Country 2020 & 2033
- Table 36: Global Electronic Power Meter Volume K Forecast, by Country 2020 & 2033
- Table 37: United Kingdom Electronic Power Meter Revenue (billion) Forecast, by Application 2020 & 2033
- Table 38: United Kingdom Electronic Power Meter Volume (K) Forecast, by Application 2020 & 2033
- Table 39: Germany Electronic Power Meter Revenue (billion) Forecast, by Application 2020 & 2033
- Table 40: Germany Electronic Power Meter Volume (K) Forecast, by Application 2020 & 2033
- Table 41: France Electronic Power Meter Revenue (billion) Forecast, by Application 2020 & 2033
- Table 42: France Electronic Power Meter Volume (K) Forecast, by Application 2020 & 2033
- Table 43: Italy Electronic Power Meter Revenue (billion) Forecast, by Application 2020 & 2033
- Table 44: Italy Electronic Power Meter Volume (K) Forecast, by Application 2020 & 2033
- Table 45: Spain Electronic Power Meter Revenue (billion) Forecast, by Application 2020 & 2033
- Table 46: Spain Electronic Power Meter Volume (K) Forecast, by Application 2020 & 2033
- Table 47: Russia Electronic Power Meter Revenue (billion) Forecast, by Application 2020 & 2033
- Table 48: Russia Electronic Power Meter Volume (K) Forecast, by Application 2020 & 2033
- Table 49: Benelux Electronic Power Meter Revenue (billion) Forecast, by Application 2020 & 2033
- Table 50: Benelux Electronic Power Meter Volume (K) Forecast, by Application 2020 & 2033
- Table 51: Nordics Electronic Power Meter Revenue (billion) Forecast, by Application 2020 & 2033
- Table 52: Nordics Electronic Power Meter Volume (K) Forecast, by Application 2020 & 2033
- Table 53: Rest of Europe Electronic Power Meter Revenue (billion) Forecast, by Application 2020 & 2033
- Table 54: Rest of Europe Electronic Power Meter Volume (K) Forecast, by Application 2020 & 2033
- Table 55: Global Electronic Power Meter Revenue billion Forecast, by Application 2020 & 2033
- Table 56: Global Electronic Power Meter Volume K Forecast, by Application 2020 & 2033
- Table 57: Global Electronic Power Meter Revenue billion Forecast, by Types 2020 & 2033
- Table 58: Global Electronic Power Meter Volume K Forecast, by Types 2020 & 2033
- Table 59: Global Electronic Power Meter Revenue billion Forecast, by Country 2020 & 2033
- Table 60: Global Electronic Power Meter Volume K Forecast, by Country 2020 & 2033
- Table 61: Turkey Electronic Power Meter Revenue (billion) Forecast, by Application 2020 & 2033
- Table 62: Turkey Electronic Power Meter Volume (K) Forecast, by Application 2020 & 2033
- Table 63: Israel Electronic Power Meter Revenue (billion) Forecast, by Application 2020 & 2033
- Table 64: Israel Electronic Power Meter Volume (K) Forecast, by Application 2020 & 2033
- Table 65: GCC Electronic Power Meter Revenue (billion) Forecast, by Application 2020 & 2033
- Table 66: GCC Electronic Power Meter Volume (K) Forecast, by Application 2020 & 2033
- Table 67: North Africa Electronic Power Meter Revenue (billion) Forecast, by Application 2020 & 2033
- Table 68: North Africa Electronic Power Meter Volume (K) Forecast, by Application 2020 & 2033
- Table 69: South Africa Electronic Power Meter Revenue (billion) Forecast, by Application 2020 & 2033
- Table 70: South Africa Electronic Power Meter Volume (K) Forecast, by Application 2020 & 2033
- Table 71: Rest of Middle East & Africa Electronic Power Meter Revenue (billion) Forecast, by Application 2020 & 2033
- Table 72: Rest of Middle East & Africa Electronic Power Meter Volume (K) Forecast, by Application 2020 & 2033
- Table 73: Global Electronic Power Meter Revenue billion Forecast, by Application 2020 & 2033
- Table 74: Global Electronic Power Meter Volume K Forecast, by Application 2020 & 2033
- Table 75: Global Electronic Power Meter Revenue billion Forecast, by Types 2020 & 2033
- Table 76: Global Electronic Power Meter Volume K Forecast, by Types 2020 & 2033
- Table 77: Global Electronic Power Meter Revenue billion Forecast, by Country 2020 & 2033
- Table 78: Global Electronic Power Meter Volume K Forecast, by Country 2020 & 2033
- Table 79: China Electronic Power Meter Revenue (billion) Forecast, by Application 2020 & 2033
- Table 80: China Electronic Power Meter Volume (K) Forecast, by Application 2020 & 2033
- Table 81: India Electronic Power Meter Revenue (billion) Forecast, by Application 2020 & 2033
- Table 82: India Electronic Power Meter Volume (K) Forecast, by Application 2020 & 2033
- Table 83: Japan Electronic Power Meter Revenue (billion) Forecast, by Application 2020 & 2033
- Table 84: Japan Electronic Power Meter Volume (K) Forecast, by Application 2020 & 2033
- Table 85: South Korea Electronic Power Meter Revenue (billion) Forecast, by Application 2020 & 2033
- Table 86: South Korea Electronic Power Meter Volume (K) Forecast, by Application 2020 & 2033
- Table 87: ASEAN Electronic Power Meter Revenue (billion) Forecast, by Application 2020 & 2033
- Table 88: ASEAN Electronic Power Meter Volume (K) Forecast, by Application 2020 & 2033
- Table 89: Oceania Electronic Power Meter Revenue (billion) Forecast, by Application 2020 & 2033
- Table 90: Oceania Electronic Power Meter Volume (K) Forecast, by Application 2020 & 2033
- Table 91: Rest of Asia Pacific Electronic Power Meter Revenue (billion) Forecast, by Application 2020 & 2033
- Table 92: Rest of Asia Pacific Electronic Power Meter Volume (K) Forecast, by Application 2020 & 2033
Frequently Asked Questions
1. What is the projected Compound Annual Growth Rate (CAGR) of the Electronic Power Meter?
The projected CAGR is approximately 5.35%.
2. Which companies are prominent players in the Electronic Power Meter?
Key companies in the market include TE Connectivity, Landis Gyr, Itron, INT, Siemens, Eaton, ABB, SUNTREE, XJ Info, TOPRIE, HYCON Technology, Shanghai Instrument Group.
3. What are the main segments of the Electronic Power Meter?
The market segments include Application, Types.
4. Can you provide details about the market size?
The market size is estimated to be USD 8.01 billion as of 2022.
5. What are some drivers contributing to market growth?
N/A
6. What are the notable trends driving market growth?
N/A
7. Are there any restraints impacting market growth?
N/A
8. Can you provide examples of recent developments in the market?
N/A
9. What pricing options are available for accessing the report?
Pricing options include single-user, multi-user, and enterprise licenses priced at USD 3950.00, USD 5925.00, and USD 7900.00 respectively.
10. Is the market size provided in terms of value or volume?
The market size is provided in terms of value, measured in billion and volume, measured in K.
11. Are there any specific market keywords associated with the report?
Yes, the market keyword associated with the report is "Electronic Power Meter," which aids in identifying and referencing the specific market segment covered.
12. How do I determine which pricing option suits my needs best?
The pricing options vary based on user requirements and access needs. Individual users may opt for single-user licenses, while businesses requiring broader access may choose multi-user or enterprise licenses for cost-effective access to the report.
13. Are there any additional resources or data provided in the Electronic Power Meter report?
While the report offers comprehensive insights, it's advisable to review the specific contents or supplementary materials provided to ascertain if additional resources or data are available.
14. How can I stay updated on further developments or reports in the Electronic Power Meter?
To stay informed about further developments, trends, and reports in the Electronic Power Meter, consider subscribing to industry newsletters, following relevant companies and organizations, or regularly checking reputable industry news sources and publications.
Methodology
Step 1 - Identification of Relevant Samples Size from Population Database


Step 2 - Approaches for Defining Global Market Size (Value, Volume* & Price*)

Note*: In applicable scenarios
Step 3 - Data Sources
Primary Research
- Web Analytics
- Survey Reports
- Research Institute
- Latest Research Reports
- Opinion Leaders
Secondary Research
- Annual Reports
- White Paper
- Latest Press Release
- Industry Association
- Paid Database
- Investor Presentations

Step 4 - Data Triangulation
Involves using different sources of information in order to increase the validity of a study
These sources are likely to be stakeholders in a program - participants, other researchers, program staff, other community members, and so on.
Then we put all data in single framework & apply various statistical tools to find out the dynamic on the market.
During the analysis stage, feedback from the stakeholder groups would be compared to determine areas of agreement as well as areas of divergence