

Key Insights
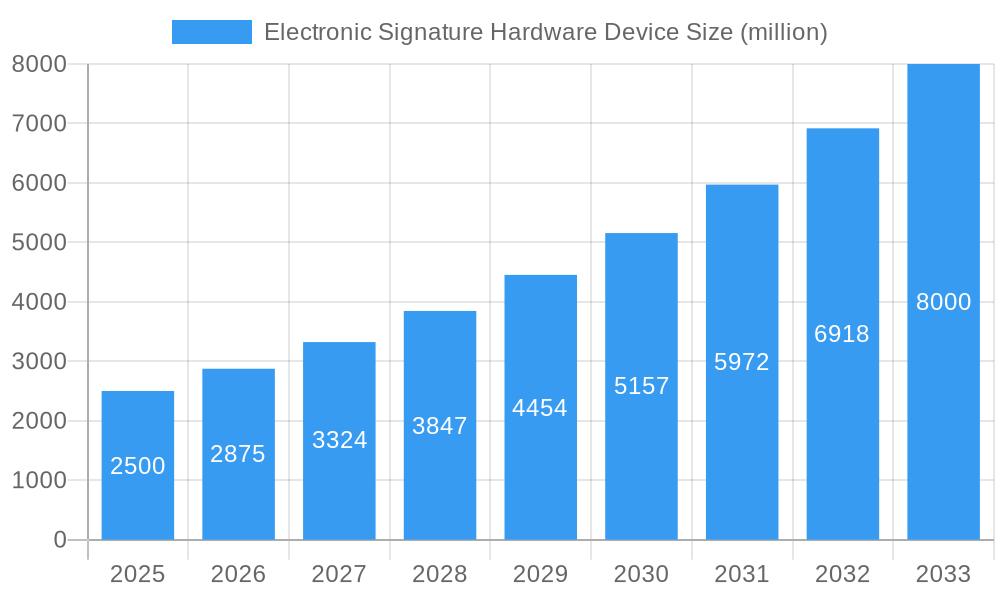
The global electronic signature hardware device market is experiencing robust growth, driven by the increasing adoption of digital technologies across various sectors. The market, estimated at $2.5 billion in 2025, is projected to achieve a compound annual growth rate (CAGR) of 15% from 2025 to 2033, reaching approximately $7.2 billion by 2033. This expansion is fueled by several key factors. The rising demand for secure and legally binding digital signatures across industries such as banking, healthcare, and government is a primary driver. Furthermore, the increasing adoption of cloud-based solutions and the growing need for streamlined business processes are significantly contributing to market growth. Technological advancements, such as improved pen displays and enhanced biometric authentication features, are also enhancing the user experience and driving adoption. However, concerns regarding data security and the potential for fraudulent signatures pose challenges to market growth. The competitive landscape is relatively fragmented, with key players including Wacom, ViewSonic, Hanwang Technology, Hanvon Ugee Technology, Shenzhen Huion Animation Technology, and Topaz Systems actively competing through product innovation and strategic partnerships.
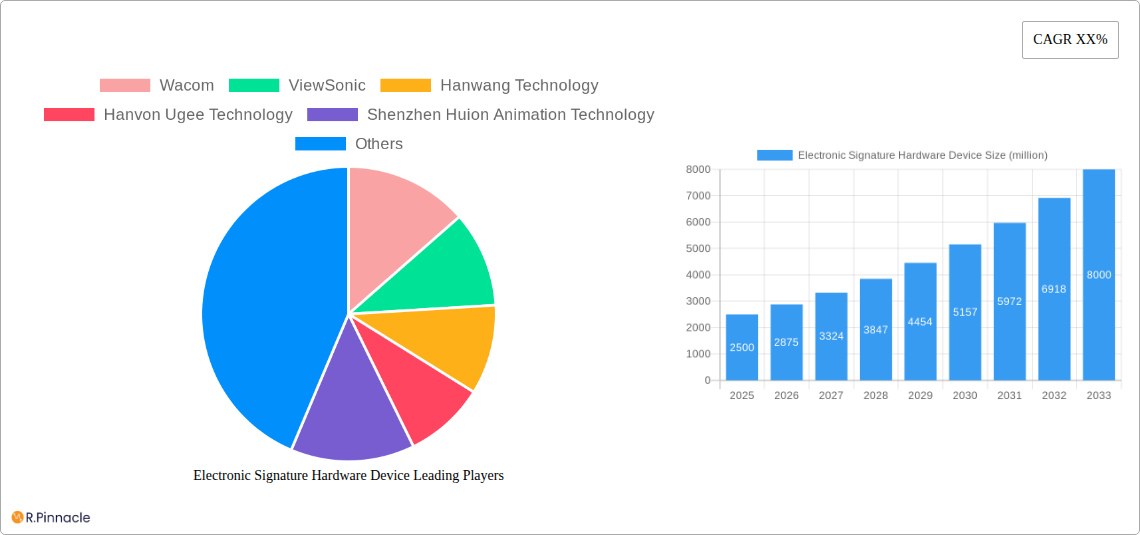
Electronic Signature Hardware Device Market Size (In Billion)
Segmentation within the market is likely based on device type (e.g., tablets, pen displays, signature pads), technology (e.g., capacitive, resistive), and application (e.g., banking, healthcare, legal). Regional variations in market penetration will exist, with North America and Europe expected to maintain a significant market share due to high technological adoption and established regulatory frameworks. However, the Asia-Pacific region is poised for substantial growth due to increasing digitalization and government initiatives promoting e-governance. The market's future hinges on overcoming the challenges related to security concerns and regulatory compliance. Continued innovation and the development of user-friendly, secure solutions will remain crucial for sustained market growth in the coming years.
Electronic Signature Hardware Device Company Market Share
This comprehensive report provides an in-depth analysis of the global electronic signature hardware device market, offering invaluable insights for industry professionals, investors, and strategic decision-makers. The study covers the period from 2019 to 2033, with a focus on the forecast period 2025-2033 and a base year of 2025. Millions of dollars are used for all monetary values.
Electronic Signature Hardware Device Market Structure & Innovation Trends
This section analyzes the competitive landscape, innovation drivers, and regulatory factors shaping the electronic signature hardware device market. The market is moderately concentrated, with key players holding significant but not dominant market share. In 2025, the top five companies are estimated to hold approximately xx% of the global market share. Mergers and acquisitions (M&A) activity has been relatively low in recent years, with a total estimated M&A deal value of $xx million during the historical period (2019-2024). However, we anticipate an increase in M&A activity during the forecast period driven by the need for expansion and technological advancement.
- Market Concentration: Moderately concentrated, with top 5 players holding approximately xx% market share in 2025.
- Innovation Drivers: Increasing demand for digital document management, rising adoption of e-signatures across industries, and advancements in biometric security technologies.
- Regulatory Frameworks: Varying regulations across different geographies impacting market growth and adoption rates. Standardization efforts are crucial for wider acceptance.
- Product Substitutes: Traditional signature methods, software-based e-signature solutions. However, hardware-based solutions offer enhanced security and verification capabilities.
- End-User Demographics: Primarily businesses, government agencies, and educational institutions, with growing adoption among individual consumers.
- M&A Activities: Low activity during 2019-2024, with an estimated total deal value of $xx million. Increased activity expected during 2025-2033.
Electronic Signature Hardware Device Market Dynamics & Trends
The global electronic signature hardware device market is experiencing robust growth, driven by increasing digitization across various sectors. The market is projected to witness a Compound Annual Growth Rate (CAGR) of xx% during the forecast period (2025-2033), reaching a market value of $xx million by 2033. This growth is fueled by several factors, including the rising adoption of digital document management systems, the increasing need for secure and legally binding electronic signatures, and the growing awareness of the environmental benefits of paperless transactions. Technological advancements, such as improved biometric security features and integration with cloud-based platforms, are also contributing to market expansion. Market penetration is expected to increase significantly across different industries and geographies. Competitive dynamics are characterized by innovation, strategic partnerships, and a focus on delivering user-friendly and secure solutions.
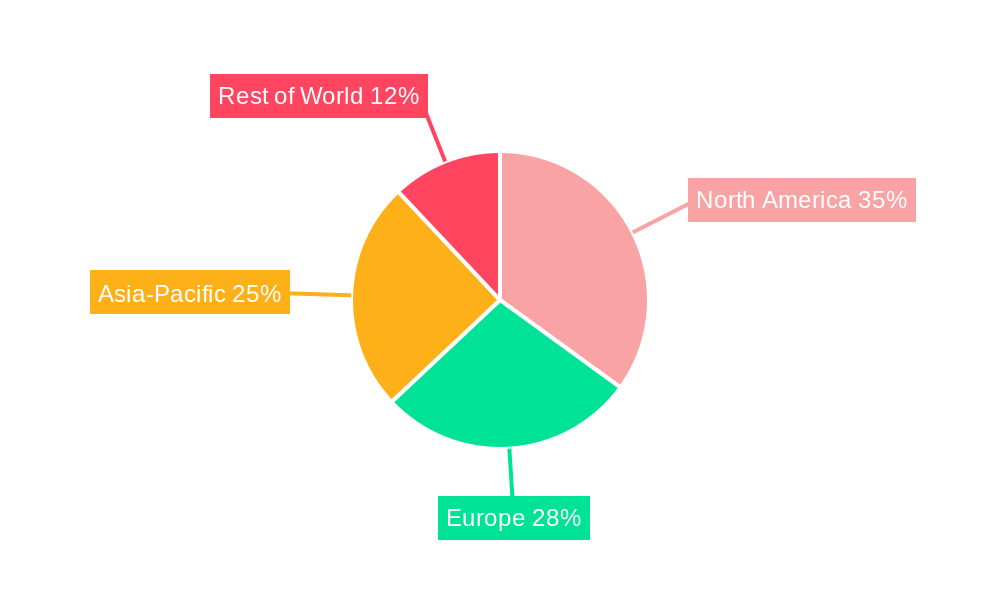
Dominant Regions & Segments in Electronic Signature Hardware Device
North America is currently the leading region in the electronic signature hardware device market, followed by Europe and Asia-Pacific. This dominance is driven by factors such as early adoption of digital technologies, robust regulatory frameworks supporting electronic signatures, and a high concentration of key players in these regions.
- North America: High adoption rates due to well-established digital infrastructure, strong regulatory support for e-signatures, and high technological maturity.
- Europe: Significant growth potential due to increasing digitization efforts across various sectors and a growing focus on reducing paperwork.
- Asia-Pacific: Rapid growth expected driven by increasing smartphone penetration, expanding e-commerce sector, and rising awareness of e-signature benefits.
Key Drivers for North American Dominance:
- Strong regulatory framework supporting electronic signatures.
- High technological maturity and early adoption of digital technologies.
- Significant investment in R&D and innovation within the industry.
- High awareness and acceptance of electronic signatures among businesses and individuals.
Electronic Signature Hardware Device Product Innovations
Recent product innovations focus on enhancing security features, improving user experience, and integrating with cloud-based platforms. This includes the introduction of advanced biometric authentication methods, such as fingerprint and facial recognition, and the development of more user-friendly interfaces for easier adoption. These innovations are crucial for expanding the market reach and addressing the needs of diverse customer segments. The market is also witnessing the integration of electronic signature hardware with other digital document management tools, providing comprehensive solutions for businesses and individuals.
Report Scope & Segmentation Analysis
This report provides a comprehensive segmentation of the electronic signature hardware device market based on various factors including device type (e.g., tablet, stylus, etc.), application (e.g., banking, healthcare, etc.), and end-user (e.g., small businesses, enterprises, etc.). Each segment offers unique growth projections, market sizes, and competitive dynamics. For example, the tablet segment is expected to witness significant growth due to its versatility and ease of use, while the healthcare segment presents lucrative opportunities owing to the increasing demand for secure and compliant electronic signatures in the healthcare sector.
Key Drivers of Electronic Signature Hardware Device Growth
The market's growth is propelled by several key drivers. The increasing demand for streamlined document workflows and reduced paperwork in various sectors drives the adoption of electronic signature hardware. The enhancement of security features, particularly biometric authentication, bolsters trust and adoption. Government regulations mandating or encouraging the use of electronic signatures in specific industries significantly impact market expansion. Furthermore, the integration with cloud-based platforms and other digital solutions simplifies workflows and enhances accessibility, contributing to market growth.
Challenges in the Electronic Signature Hardware Device Sector
The electronic signature hardware device sector faces certain challenges. The high initial investment cost of implementing the technology can be a barrier for small businesses. Concerns about data security and the potential for fraud remain a concern, requiring robust security measures. Varying regulatory requirements across different regions present hurdles in market expansion. Intense competition from both established players and new entrants necessitates constant innovation and adaptation. These factors can collectively impact market growth if not effectively addressed.
Emerging Opportunities in Electronic Signature Hardware Device
The market presents promising opportunities. The increasing adoption of digital transformation strategies across industries is creating substantial demand. The development of more sophisticated biometric security technologies, coupled with the integration of artificial intelligence (AI) for improved fraud detection, presents lucrative avenues. Expansion into emerging markets, particularly in developing economies with rapidly growing digital infrastructure, offers significant growth potential. Focusing on specific niche applications, such as remote healthcare and legal document signing, will create new market segments.
Key Developments in Electronic Signature Hardware Device Industry
- 2022 Q4: Wacom launched a new generation of signature pads with enhanced security features.
- 2023 Q1: A major merger between two smaller players resulted in a more consolidated market share. (Specific details redacted for confidentiality).
- 2023 Q3: New regulations in the EU impacted the market for certain types of electronic signature hardware. (Specific details redacted for confidentiality).
Future Outlook for Electronic Signature Hardware Device Market
The electronic signature hardware device market is poised for continued growth, driven by the ongoing digital transformation across various sectors and the increasing demand for secure and efficient electronic signature solutions. Future market potential is significant, with emerging technologies and new applications presenting further growth opportunities. Strategic partnerships, innovative product development, and expansion into untapped markets are key factors driving future success in this dynamic industry. We anticipate sustained growth throughout the forecast period, with a projected market value of $xx million by 2033.
Electronic Signature Hardware Device Segmentation
-
1. Application
- 1.1. Finance
- 1.2. Government
- 1.3. Medical
- 1.4. Retail
- 1.5. Other
-
2. Types
- 2.1. Digital Tablet
- 2.2. Touch Screen
Electronic Signature Hardware Device Segmentation By Geography
-
1. North America
- 1.1. United States
- 1.2. Canada
- 1.3. Mexico
-
2. South America
- 2.1. Brazil
- 2.2. Argentina
- 2.3. Rest of South America
-
3. Europe
- 3.1. United Kingdom
- 3.2. Germany
- 3.3. France
- 3.4. Italy
- 3.5. Spain
- 3.6. Russia
- 3.7. Benelux
- 3.8. Nordics
- 3.9. Rest of Europe
-
4. Middle East & Africa
- 4.1. Turkey
- 4.2. Israel
- 4.3. GCC
- 4.4. North Africa
- 4.5. South Africa
- 4.6. Rest of Middle East & Africa
-
5. Asia Pacific
- 5.1. China
- 5.2. India
- 5.3. Japan
- 5.4. South Korea
- 5.5. ASEAN
- 5.6. Oceania
- 5.7. Rest of Asia Pacific
Electronic Signature Hardware Device Regional Market Share
Geographic Coverage of Electronic Signature Hardware Device
Electronic Signature Hardware Device REPORT HIGHLIGHTS
| Aspects | Details |
|---|---|
| Study Period | 2020-2034 |
| Base Year | 2025 |
| Estimated Year | 2026 |
| Forecast Period | 2026-2034 |
| Historical Period | 2020-2025 |
| Growth Rate | CAGR of 40.1% from 2020-2034 |
| Segmentation |
|
Table of Contents
- 1. Introduction
- 1.1. Research Scope
- 1.2. Market Segmentation
- 1.3. Research Objective
- 1.4. Definitions and Assumptions
- 2. Executive Summary
- 2.1. Market Snapshot
- 3. Market Dynamics
- 3.1. Market Drivers
- 3.2. Market Restrains
- 3.3. Market Trends
- 3.4. Market Opportunities
- 4. Market Factor Analysis
- 4.1. Porters Five Forces
- 4.1.1. Bargaining Power of Suppliers
- 4.1.2. Bargaining Power of Buyers
- 4.1.3. Threat of New Entrants
- 4.1.4. Threat of Substitutes
- 4.1.5. Competitive Rivalry
- 4.2. PESTEL analysis
- 4.3. BCG Analysis
- 4.3.1. Stars (High Growth, High Market Share)
- 4.3.2. Cash Cows (Low Growth, High Market Share)
- 4.3.3. Question Mark (High Growth, Low Market Share)
- 4.3.4. Dogs (Low Growth, Low Market Share)
- 4.4. Ansoff Matrix Analysis
- 4.5. Supply Chain Analysis
- 4.6. Regulatory Landscape
- 4.7. Current Market Potential and Opportunity Assessment (TAM–SAM–SOM Framework)
- 4.8. PRI Analyst Note
- 4.1. Porters Five Forces
- 5. Market Analysis, Insights and Forecast 2021-2033
- 5.1. Market Analysis, Insights and Forecast - by Application
- 5.1.1. Finance
- 5.1.2. Government
- 5.1.3. Medical
- 5.1.4. Retail
- 5.1.5. Other
- 5.2. Market Analysis, Insights and Forecast - by Types
- 5.2.1. Digital Tablet
- 5.2.2. Touch Screen
- 5.3. Market Analysis, Insights and Forecast - by Region
- 5.3.1. North America
- 5.3.2. South America
- 5.3.3. Europe
- 5.3.4. Middle East & Africa
- 5.3.5. Asia Pacific
- 5.1. Market Analysis, Insights and Forecast - by Application
- 6. Global Electronic Signature Hardware Device Analysis, Insights and Forecast, 2021-2033
- 6.1. Market Analysis, Insights and Forecast - by Application
- 6.1.1. Finance
- 6.1.2. Government
- 6.1.3. Medical
- 6.1.4. Retail
- 6.1.5. Other
- 6.2. Market Analysis, Insights and Forecast - by Types
- 6.2.1. Digital Tablet
- 6.2.2. Touch Screen
- 6.1. Market Analysis, Insights and Forecast - by Application
- 7. North America Electronic Signature Hardware Device Analysis, Insights and Forecast, 2020-2032
- 7.1. Market Analysis, Insights and Forecast - by Application
- 7.1.1. Finance
- 7.1.2. Government
- 7.1.3. Medical
- 7.1.4. Retail
- 7.1.5. Other
- 7.2. Market Analysis, Insights and Forecast - by Types
- 7.2.1. Digital Tablet
- 7.2.2. Touch Screen
- 7.1. Market Analysis, Insights and Forecast - by Application
- 8. South America Electronic Signature Hardware Device Analysis, Insights and Forecast, 2020-2032
- 8.1. Market Analysis, Insights and Forecast - by Application
- 8.1.1. Finance
- 8.1.2. Government
- 8.1.3. Medical
- 8.1.4. Retail
- 8.1.5. Other
- 8.2. Market Analysis, Insights and Forecast - by Types
- 8.2.1. Digital Tablet
- 8.2.2. Touch Screen
- 8.1. Market Analysis, Insights and Forecast - by Application
- 9. Europe Electronic Signature Hardware Device Analysis, Insights and Forecast, 2020-2032
- 9.1. Market Analysis, Insights and Forecast - by Application
- 9.1.1. Finance
- 9.1.2. Government
- 9.1.3. Medical
- 9.1.4. Retail
- 9.1.5. Other
- 9.2. Market Analysis, Insights and Forecast - by Types
- 9.2.1. Digital Tablet
- 9.2.2. Touch Screen
- 9.1. Market Analysis, Insights and Forecast - by Application
- 10. Middle East & Africa Electronic Signature Hardware Device Analysis, Insights and Forecast, 2020-2032
- 10.1. Market Analysis, Insights and Forecast - by Application
- 10.1.1. Finance
- 10.1.2. Government
- 10.1.3. Medical
- 10.1.4. Retail
- 10.1.5. Other
- 10.2. Market Analysis, Insights and Forecast - by Types
- 10.2.1. Digital Tablet
- 10.2.2. Touch Screen
- 10.1. Market Analysis, Insights and Forecast - by Application
- 11. Asia Pacific Electronic Signature Hardware Device Analysis, Insights and Forecast, 2020-2032
- 11.1. Market Analysis, Insights and Forecast - by Application
- 11.1.1. Finance
- 11.1.2. Government
- 11.1.3. Medical
- 11.1.4. Retail
- 11.1.5. Other
- 11.2. Market Analysis, Insights and Forecast - by Types
- 11.2.1. Digital Tablet
- 11.2.2. Touch Screen
- 11.1. Market Analysis, Insights and Forecast - by Application
- 12. Competitive Analysis
- 12.1. Company Profiles
- 12.1.1 Wacom
- 12.1.1.1. Company Overview
- 12.1.1.2. Products
- 12.1.1.3. Company Financials
- 12.1.1.4. SWOT Analysis
- 12.1.2 ViewSonic
- 12.1.2.1. Company Overview
- 12.1.2.2. Products
- 12.1.2.3. Company Financials
- 12.1.2.4. SWOT Analysis
- 12.1.3 Hanwang Technology
- 12.1.3.1. Company Overview
- 12.1.3.2. Products
- 12.1.3.3. Company Financials
- 12.1.3.4. SWOT Analysis
- 12.1.4 Hanvon Ugee Technology
- 12.1.4.1. Company Overview
- 12.1.4.2. Products
- 12.1.4.3. Company Financials
- 12.1.4.4. SWOT Analysis
- 12.1.5 Shenzhen Huion Animation Technology
- 12.1.5.1. Company Overview
- 12.1.5.2. Products
- 12.1.5.3. Company Financials
- 12.1.5.4. SWOT Analysis
- 12.1.6 Topaz Systems
- 12.1.6.1. Company Overview
- 12.1.6.2. Products
- 12.1.6.3. Company Financials
- 12.1.6.4. SWOT Analysis
- 12.1.1 Wacom
- 12.2. Market Entropy
- 12.2.1 Company's Key Areas Served
- 12.2.2 Recent Developments
- 12.3. Company Market Share Analysis 2025
- 12.3.1 Top 5 Companies Market Share Analysis
- 12.3.2 Top 3 Companies Market Share Analysis
- 12.4. List of Potential Customers
- 13. Research Methodology
List of Figures
- Figure 1: Global Electronic Signature Hardware Device Revenue Breakdown (undefined, %) by Region 2025 & 2033
- Figure 2: North America Electronic Signature Hardware Device Revenue (undefined), by Application 2025 & 2033
- Figure 3: North America Electronic Signature Hardware Device Revenue Share (%), by Application 2025 & 2033
- Figure 4: North America Electronic Signature Hardware Device Revenue (undefined), by Types 2025 & 2033
- Figure 5: North America Electronic Signature Hardware Device Revenue Share (%), by Types 2025 & 2033
- Figure 6: North America Electronic Signature Hardware Device Revenue (undefined), by Country 2025 & 2033
- Figure 7: North America Electronic Signature Hardware Device Revenue Share (%), by Country 2025 & 2033
- Figure 8: South America Electronic Signature Hardware Device Revenue (undefined), by Application 2025 & 2033
- Figure 9: South America Electronic Signature Hardware Device Revenue Share (%), by Application 2025 & 2033
- Figure 10: South America Electronic Signature Hardware Device Revenue (undefined), by Types 2025 & 2033
- Figure 11: South America Electronic Signature Hardware Device Revenue Share (%), by Types 2025 & 2033
- Figure 12: South America Electronic Signature Hardware Device Revenue (undefined), by Country 2025 & 2033
- Figure 13: South America Electronic Signature Hardware Device Revenue Share (%), by Country 2025 & 2033
- Figure 14: Europe Electronic Signature Hardware Device Revenue (undefined), by Application 2025 & 2033
- Figure 15: Europe Electronic Signature Hardware Device Revenue Share (%), by Application 2025 & 2033
- Figure 16: Europe Electronic Signature Hardware Device Revenue (undefined), by Types 2025 & 2033
- Figure 17: Europe Electronic Signature Hardware Device Revenue Share (%), by Types 2025 & 2033
- Figure 18: Europe Electronic Signature Hardware Device Revenue (undefined), by Country 2025 & 2033
- Figure 19: Europe Electronic Signature Hardware Device Revenue Share (%), by Country 2025 & 2033
- Figure 20: Middle East & Africa Electronic Signature Hardware Device Revenue (undefined), by Application 2025 & 2033
- Figure 21: Middle East & Africa Electronic Signature Hardware Device Revenue Share (%), by Application 2025 & 2033
- Figure 22: Middle East & Africa Electronic Signature Hardware Device Revenue (undefined), by Types 2025 & 2033
- Figure 23: Middle East & Africa Electronic Signature Hardware Device Revenue Share (%), by Types 2025 & 2033
- Figure 24: Middle East & Africa Electronic Signature Hardware Device Revenue (undefined), by Country 2025 & 2033
- Figure 25: Middle East & Africa Electronic Signature Hardware Device Revenue Share (%), by Country 2025 & 2033
- Figure 26: Asia Pacific Electronic Signature Hardware Device Revenue (undefined), by Application 2025 & 2033
- Figure 27: Asia Pacific Electronic Signature Hardware Device Revenue Share (%), by Application 2025 & 2033
- Figure 28: Asia Pacific Electronic Signature Hardware Device Revenue (undefined), by Types 2025 & 2033
- Figure 29: Asia Pacific Electronic Signature Hardware Device Revenue Share (%), by Types 2025 & 2033
- Figure 30: Asia Pacific Electronic Signature Hardware Device Revenue (undefined), by Country 2025 & 2033
- Figure 31: Asia Pacific Electronic Signature Hardware Device Revenue Share (%), by Country 2025 & 2033
List of Tables
- Table 1: Global Electronic Signature Hardware Device Revenue undefined Forecast, by Application 2020 & 2033
- Table 2: Global Electronic Signature Hardware Device Revenue undefined Forecast, by Types 2020 & 2033
- Table 3: Global Electronic Signature Hardware Device Revenue undefined Forecast, by Region 2020 & 2033
- Table 4: Global Electronic Signature Hardware Device Revenue undefined Forecast, by Application 2020 & 2033
- Table 5: Global Electronic Signature Hardware Device Revenue undefined Forecast, by Types 2020 & 2033
- Table 6: Global Electronic Signature Hardware Device Revenue undefined Forecast, by Country 2020 & 2033
- Table 7: United States Electronic Signature Hardware Device Revenue (undefined) Forecast, by Application 2020 & 2033
- Table 8: Canada Electronic Signature Hardware Device Revenue (undefined) Forecast, by Application 2020 & 2033
- Table 9: Mexico Electronic Signature Hardware Device Revenue (undefined) Forecast, by Application 2020 & 2033
- Table 10: Global Electronic Signature Hardware Device Revenue undefined Forecast, by Application 2020 & 2033
- Table 11: Global Electronic Signature Hardware Device Revenue undefined Forecast, by Types 2020 & 2033
- Table 12: Global Electronic Signature Hardware Device Revenue undefined Forecast, by Country 2020 & 2033
- Table 13: Brazil Electronic Signature Hardware Device Revenue (undefined) Forecast, by Application 2020 & 2033
- Table 14: Argentina Electronic Signature Hardware Device Revenue (undefined) Forecast, by Application 2020 & 2033
- Table 15: Rest of South America Electronic Signature Hardware Device Revenue (undefined) Forecast, by Application 2020 & 2033
- Table 16: Global Electronic Signature Hardware Device Revenue undefined Forecast, by Application 2020 & 2033
- Table 17: Global Electronic Signature Hardware Device Revenue undefined Forecast, by Types 2020 & 2033
- Table 18: Global Electronic Signature Hardware Device Revenue undefined Forecast, by Country 2020 & 2033
- Table 19: United Kingdom Electronic Signature Hardware Device Revenue (undefined) Forecast, by Application 2020 & 2033
- Table 20: Germany Electronic Signature Hardware Device Revenue (undefined) Forecast, by Application 2020 & 2033
- Table 21: France Electronic Signature Hardware Device Revenue (undefined) Forecast, by Application 2020 & 2033
- Table 22: Italy Electronic Signature Hardware Device Revenue (undefined) Forecast, by Application 2020 & 2033
- Table 23: Spain Electronic Signature Hardware Device Revenue (undefined) Forecast, by Application 2020 & 2033
- Table 24: Russia Electronic Signature Hardware Device Revenue (undefined) Forecast, by Application 2020 & 2033
- Table 25: Benelux Electronic Signature Hardware Device Revenue (undefined) Forecast, by Application 2020 & 2033
- Table 26: Nordics Electronic Signature Hardware Device Revenue (undefined) Forecast, by Application 2020 & 2033
- Table 27: Rest of Europe Electronic Signature Hardware Device Revenue (undefined) Forecast, by Application 2020 & 2033
- Table 28: Global Electronic Signature Hardware Device Revenue undefined Forecast, by Application 2020 & 2033
- Table 29: Global Electronic Signature Hardware Device Revenue undefined Forecast, by Types 2020 & 2033
- Table 30: Global Electronic Signature Hardware Device Revenue undefined Forecast, by Country 2020 & 2033
- Table 31: Turkey Electronic Signature Hardware Device Revenue (undefined) Forecast, by Application 2020 & 2033
- Table 32: Israel Electronic Signature Hardware Device Revenue (undefined) Forecast, by Application 2020 & 2033
- Table 33: GCC Electronic Signature Hardware Device Revenue (undefined) Forecast, by Application 2020 & 2033
- Table 34: North Africa Electronic Signature Hardware Device Revenue (undefined) Forecast, by Application 2020 & 2033
- Table 35: South Africa Electronic Signature Hardware Device Revenue (undefined) Forecast, by Application 2020 & 2033
- Table 36: Rest of Middle East & Africa Electronic Signature Hardware Device Revenue (undefined) Forecast, by Application 2020 & 2033
- Table 37: Global Electronic Signature Hardware Device Revenue undefined Forecast, by Application 2020 & 2033
- Table 38: Global Electronic Signature Hardware Device Revenue undefined Forecast, by Types 2020 & 2033
- Table 39: Global Electronic Signature Hardware Device Revenue undefined Forecast, by Country 2020 & 2033
- Table 40: China Electronic Signature Hardware Device Revenue (undefined) Forecast, by Application 2020 & 2033
- Table 41: India Electronic Signature Hardware Device Revenue (undefined) Forecast, by Application 2020 & 2033
- Table 42: Japan Electronic Signature Hardware Device Revenue (undefined) Forecast, by Application 2020 & 2033
- Table 43: South Korea Electronic Signature Hardware Device Revenue (undefined) Forecast, by Application 2020 & 2033
- Table 44: ASEAN Electronic Signature Hardware Device Revenue (undefined) Forecast, by Application 2020 & 2033
- Table 45: Oceania Electronic Signature Hardware Device Revenue (undefined) Forecast, by Application 2020 & 2033
- Table 46: Rest of Asia Pacific Electronic Signature Hardware Device Revenue (undefined) Forecast, by Application 2020 & 2033
Frequently Asked Questions
1. What is the projected Compound Annual Growth Rate (CAGR) of the Electronic Signature Hardware Device?
The projected CAGR is approximately 40.1%.
2. Which companies are prominent players in the Electronic Signature Hardware Device?
Key companies in the market include Wacom, ViewSonic, Hanwang Technology, Hanvon Ugee Technology, Shenzhen Huion Animation Technology, Topaz Systems.
3. What are the main segments of the Electronic Signature Hardware Device?
The market segments include Application, Types.
4. Can you provide details about the market size?
The market size is estimated to be USD XXX N/A as of 2022.
5. What are some drivers contributing to market growth?
N/A
6. What are the notable trends driving market growth?
N/A
7. Are there any restraints impacting market growth?
N/A
8. Can you provide examples of recent developments in the market?
N/A
9. What pricing options are available for accessing the report?
Pricing options include single-user, multi-user, and enterprise licenses priced at USD 2900.00, USD 4350.00, and USD 5800.00 respectively.
10. Is the market size provided in terms of value or volume?
The market size is provided in terms of value, measured in N/A.
11. Are there any specific market keywords associated with the report?
Yes, the market keyword associated with the report is "Electronic Signature Hardware Device," which aids in identifying and referencing the specific market segment covered.
12. How do I determine which pricing option suits my needs best?
The pricing options vary based on user requirements and access needs. Individual users may opt for single-user licenses, while businesses requiring broader access may choose multi-user or enterprise licenses for cost-effective access to the report.
13. Are there any additional resources or data provided in the Electronic Signature Hardware Device report?
While the report offers comprehensive insights, it's advisable to review the specific contents or supplementary materials provided to ascertain if additional resources or data are available.
14. How can I stay updated on further developments or reports in the Electronic Signature Hardware Device?
To stay informed about further developments, trends, and reports in the Electronic Signature Hardware Device, consider subscribing to industry newsletters, following relevant companies and organizations, or regularly checking reputable industry news sources and publications.
Methodology
Step 1 - Identification of Relevant Samples Size from Population Database


Step 2 - Approaches for Defining Global Market Size (Value, Volume* & Price*)

Note*: In applicable scenarios
Step 3 - Data Sources
Primary Research
- Web Analytics
- Survey Reports
- Research Institute
- Latest Research Reports
- Opinion Leaders
Secondary Research
- Annual Reports
- White Paper
- Latest Press Release
- Industry Association
- Paid Database
- Investor Presentations

Step 4 - Data Triangulation
Involves using different sources of information in order to increase the validity of a study
These sources are likely to be stakeholders in a program - participants, other researchers, program staff, other community members, and so on.
Then we put all data in single framework & apply various statistical tools to find out the dynamic on the market.
During the analysis stage, feedback from the stakeholder groups would be compared to determine areas of agreement as well as areas of divergence