


Key Insights
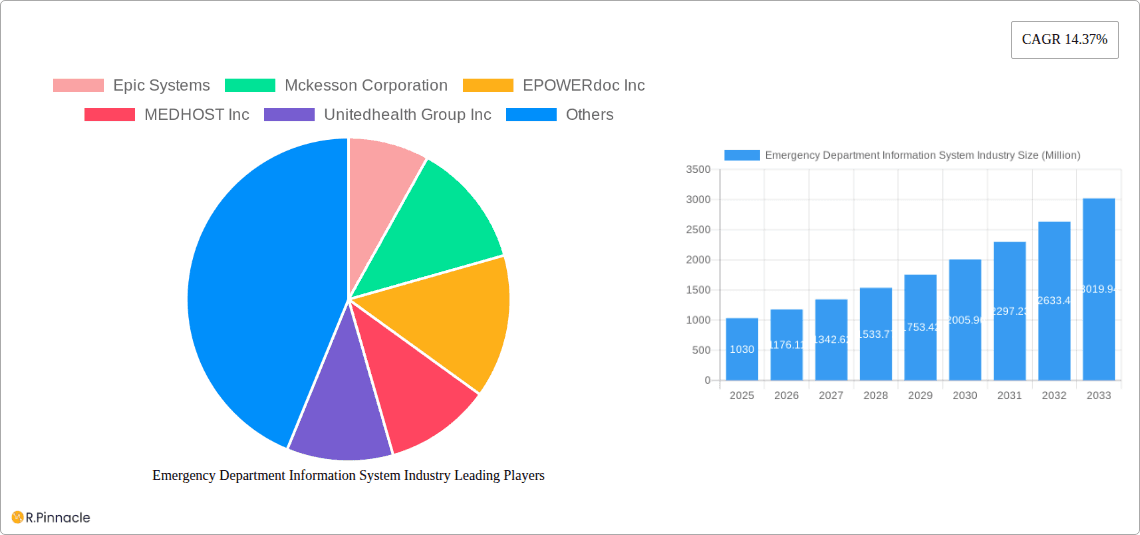
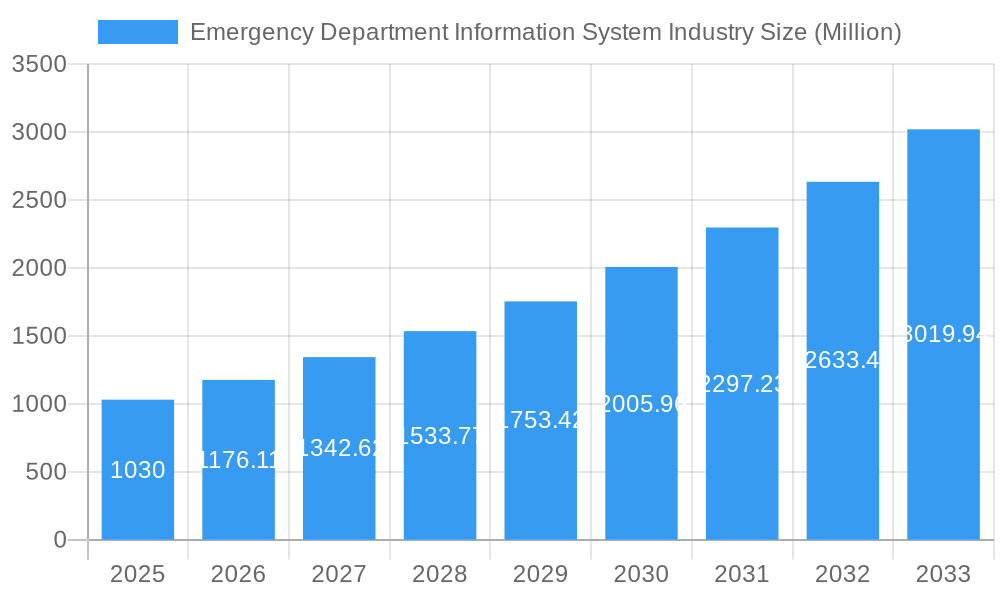
The Emergency Department Information System (EDIS) market is experiencing robust growth, projected to reach a market size of $1.03 billion in 2025, with a Compound Annual Growth Rate (CAGR) of 14.37% from 2025 to 2033. This expansion is fueled by several key factors. The increasing volume of patients in emergency departments necessitates efficient and streamlined workflows, driving the adoption of EDIS solutions for improved patient care and reduced wait times. Furthermore, the growing emphasis on improving healthcare outcomes and reducing medical errors through better data management and real-time information access significantly contributes to market growth. The shift towards value-based care models also incentivizes hospitals and healthcare providers to invest in technology that enhances operational efficiency and data-driven decision-making. Technological advancements such as cloud-based solutions (SaaS) are gaining traction, offering scalability, cost-effectiveness, and easier integration with existing healthcare infrastructure. The market is segmented by application (CPOE, clinical documentation, patient tracking, e-prescribing), deployment (on-premise, SaaS), software type (enterprise, best-of-breed), and end-user (small, medium, large hospitals), reflecting the diverse needs and technological capabilities of different healthcare settings. North America currently holds a significant market share due to advanced healthcare infrastructure and high technology adoption rates, but growth in regions like Asia Pacific is expected to accelerate driven by increasing healthcare investments and rising patient volumes.
Emergency Department Information System Industry Market Size (In Billion)

The competitive landscape is characterized by a mix of established players like Epic Systems and Cerner Corporation, along with smaller, specialized vendors offering best-of-breed solutions. This competition fosters innovation and drives down prices, making EDIS solutions more accessible to a wider range of healthcare providers. However, challenges remain, including high initial investment costs for implementing EDIS systems, concerns about data security and interoperability, and the need for comprehensive training and support for healthcare professionals. Despite these challenges, the long-term growth prospects for the EDIS market remain positive, driven by ongoing technological advancements, the increasing demand for improved patient care, and the imperative for enhanced operational efficiency within emergency departments globally. The market is poised for further expansion as more healthcare organizations recognize the value of EDIS in optimizing emergency department operations and improving patient outcomes.
Emergency Department Information System Industry Company Market Share
Emergency Department Information System (EDIS) Market Report: 2019-2033
This comprehensive report provides a detailed analysis of the Emergency Department Information System (EDIS) industry, offering invaluable insights for industry professionals, investors, and stakeholders. Covering the period 2019-2033, with a focus on 2025, this report analyzes market trends, competitive dynamics, and future growth potential. The global EDIS market is projected to reach xx Million by 2033.
Emergency Department Information System Industry Market Structure & Innovation Trends
The EDIS market exhibits a moderately consolidated structure, with key players like Epic Systems, McKesson Corporation, and Cerner Corporation holding significant market share. However, the presence of numerous smaller, specialized vendors (e.g., EPOWERdoc Inc, MEDHOST Inc) contributes to a dynamic competitive landscape. Market share data from 2024 estimates Epic Systems at approximately 25%, McKesson at 20%, and Cerner at 15%, with the remaining share distributed among other players. Innovation is driven by increasing demand for improved patient care, enhanced operational efficiency, and the integration of Artificial Intelligence (AI) and machine learning. Regulatory frameworks, such as HIPAA in the US and equivalent regulations globally, heavily influence product development and data security practices. Product substitutes are limited, primarily involving legacy systems or manual processes, although cloud-based solutions are increasingly replacing on-premise systems. The end-user demographic skews toward large hospitals, but medium and small hospitals are also actively adopting EDIS solutions. M&A activity has been notable, with several large players acquiring smaller companies to expand their product portfolios and market reach. While exact deal values for all transactions are not publicly available, the total value of M&A deals in the past 5 years is estimated at approximately xx Million.
- Key Players: Epic Systems, McKesson Corporation, Cerner Corporation, Allscripts Healthcare Solutions Inc, MEDHOST Inc, EPOWERdoc Inc, UnitedHealth Group Inc, Medical Information Technology Inc, Logibec Canada, T-Systems Inc, Evident, Medsphere Systems Corporation.
- Market Concentration: Moderately Consolidated
- Key Innovation Drivers: AI integration, improved patient care, operational efficiency.
- M&A Activity: Significant, with total deal value estimated at xx Million in the last 5 years.
Emergency Department Information System Industry Market Dynamics & Trends
The EDIS market is experiencing robust growth, driven by several factors. Increasing government initiatives to promote the adoption of electronic health records (EHRs) and the rising prevalence of chronic diseases are major contributors. Technological disruptions, such as the widespread adoption of cloud-based solutions (SaaS) and the integration of AI-powered diagnostic tools, are reshaping the industry. Consumer preferences are shifting towards user-friendly, scalable, and interoperable systems. Competitive dynamics are characterized by ongoing innovation, strategic partnerships, and mergers and acquisitions. The Compound Annual Growth Rate (CAGR) from 2025-2033 is projected at xx%, with market penetration expected to increase from xx% in 2025 to xx% by 2033. This growth is particularly noticeable in regions with well-established healthcare infrastructure and increasing healthcare expenditure.
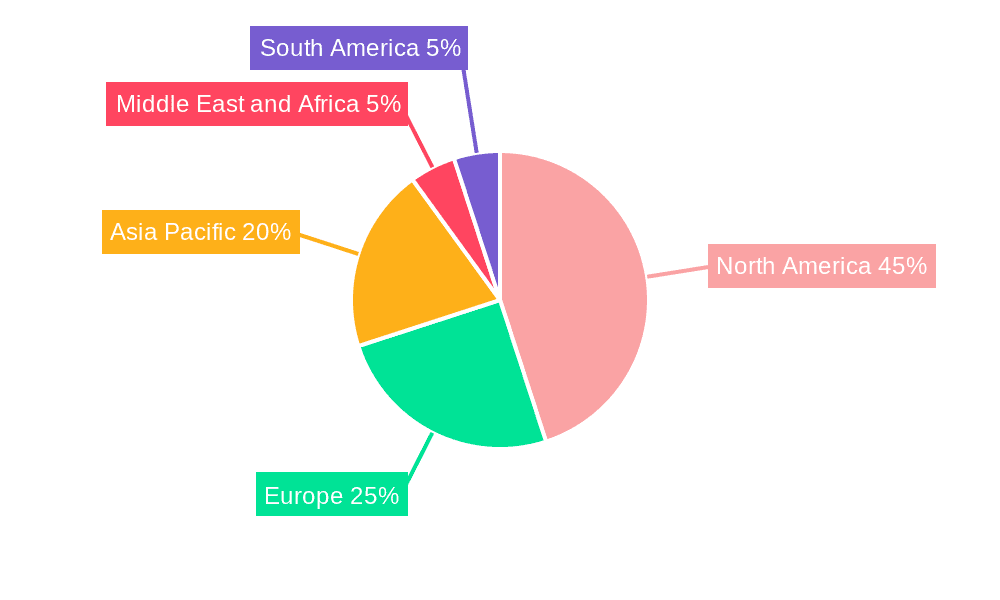
Dominant Regions & Segments in Emergency Department Information System Industry
The North American market currently holds the dominant position in the EDIS industry, driven by factors such as higher healthcare expenditure, advanced technological infrastructure, and a strong regulatory framework promoting EHR adoption. Within the application segments, Computerized Physician Order Entry (CPOE) and Clinical Documentation are the largest, reflecting the core functions of EDIS. Software-as-a-Service (SaaS) deployments are rapidly gaining traction, surpassing on-premise solutions due to their scalability, cost-effectiveness, and ease of implementation. Large Hospitals represent the largest segment of end-users, owing to their greater resources and complex needs.
Key Drivers (North America):
- High healthcare expenditure
- Advanced technological infrastructure
- Strong regulatory framework promoting EHR adoption
Dominant Application Segment: CPOE and Clinical Documentation
Dominant Deployment Model: Software-as-a-Service (SaaS)
Dominant End-User: Large Hospitals
Emergency Department Information System Industry Product Innovations
Recent innovations in EDIS focus on incorporating AI-powered tools for improved diagnostics, predictive analytics for resource allocation, and enhanced patient engagement features. Integration with other healthcare systems is also a key area of development, aiming for seamless data exchange and interoperability. These advancements are improving clinical workflows, reducing medical errors, and enhancing the overall quality of patient care. The market is seeing increased emphasis on user-friendly interfaces and mobile accessibility.
Report Scope & Segmentation Analysis
This report segments the EDIS market by application (CPOE, Clinical Documentation, Patient Tracking & Triage, E-Prescribing, Others), deployment (On-Premise, SaaS), software type (Enterprise Solutions, Best of Breed), and end-user (Small, Medium, Large Hospitals). Each segment’s growth projections, market sizes, and competitive dynamics are analyzed in detail. The SaaS segment is expected to experience the highest growth, while large hospitals remain the dominant customer base. Competitive dynamics vary across segments, with specialized vendors competing in niche areas.
Key Drivers of Emergency Department Information System Industry Growth
Several factors contribute to the growth of the EDIS market. The increasing need for improved patient care and operational efficiency in emergency departments is a primary driver. Government regulations promoting EHR adoption and the rising adoption of telehealth are also significant contributors. The integration of AI and machine learning is further accelerating innovation and market growth.
Challenges in the Emergency Department Information System Industry Sector
Challenges include the high cost of implementation and maintenance, the need for robust data security measures, and the complexity of integrating EDIS with existing healthcare systems. Interoperability issues, resistance to change among healthcare professionals, and data privacy concerns also present challenges. The estimated impact of these challenges on market growth is around xx Million annually.
Emerging Opportunities in Emergency Department Information System Industry
Emerging opportunities include the expanding adoption of cloud-based solutions, integration with AI-powered diagnostic tools, and the increasing demand for remote patient monitoring. The growing focus on patient engagement and the expansion into emerging markets represent further growth opportunities.
Leading Players in the Emergency Department Information System Industry Market
- Epic Systems
- Mckesson Corporation
- EPOWERdoc Inc
- MEDHOST Inc
- Unitedhealth Group Inc
- Cerner Corporation
- Medical Information Technology Inc
- Logibec Canada
- Allscripts Healthcare Solutions Inc
- T-Systems Inc
- Evident
- Medsphere Systems Corporation
Key Developments in Emergency Department Information System Industry Industry
- March 2022: HeartBeam, Inc. signed a BAA and CTA with Phoebe Putney Health System for an ED MI software pilot study.
- January 2022: Aidoc partnered with Novant Health to integrate its AI platform for improved triage and patient outcomes.
Future Outlook for Emergency Department Information System Industry Market
The EDIS market is poised for continued growth, driven by technological advancements, increasing government support for EHR adoption, and the growing need for efficient and effective emergency department management. Strategic partnerships, acquisitions, and the development of innovative solutions will shape the future competitive landscape. The market is expected to see continued strong growth over the forecast period, with a focus on AI integration and improved interoperability.
Emergency Department Information System Industry Segmentation
-
1. Application
- 1.1. Computerized Physician Order Entry (CPOE)
- 1.2. Clinical Documentation
- 1.3. Patient Tracking & Triage
- 1.4. E-Prescribing
- 1.5. Others
-
2. Deployment
- 2.1. On-Premise EDIS
- 2.2. Software-As-A-Services (SaaS)
-
3. Software Type
- 3.1. Enterprise Solutions
- 3.2. Best of Breed (B.O.B.) Solutions
-
4. End User
- 4.1. Small Hospitals
- 4.2. Medium-Sized Hospitals
- 4.3. Large Hospitals
Emergency Department Information System Industry Segmentation By Geography
-
1. North America
- 1.1. United States
- 1.2. Canada
- 1.3. Mexico
-
2. Europe
- 2.1. Germany
- 2.2. United Kingdom
- 2.3. France
- 2.4. Italy
- 2.5. Spain
- 2.6. Rest of Europe
-
3. Asia Pacific
- 3.1. China
- 3.2. Japan
- 3.3. India
- 3.4. Australia
- 3.5. South Korea
- 3.6. Rest of Asia Pacific
-
4. Middle East and Africa
- 4.1. GCC
- 4.2. South Africa
- 4.3. Rest of Middle East and Africa
-
5. South America
- 5.1. Brazil
- 5.2. Argentina
- 5.3. Rest of South America
Emergency Department Information System Industry Regional Market Share
Geographic Coverage of Emergency Department Information System Industry
Emergency Department Information System Industry REPORT HIGHLIGHTS
| Aspects | Details |
|---|---|
| Study Period | 2020-2034 |
| Base Year | 2025 |
| Estimated Year | 2026 |
| Forecast Period | 2026-2034 |
| Historical Period | 2020-2025 |
| Growth Rate | CAGR of 14.37% from 2020-2034 |
| Segmentation |
|
Table of Contents
- 1. Introduction
- 1.1. Research Scope
- 1.2. Market Segmentation
- 1.3. Research Methodology
- 1.4. Definitions and Assumptions
- 2. Executive Summary
- 2.1. Introduction
- 3. Market Dynamics
- 3.1. Introduction
- 3.2. Market Drivers
- 3.2.1. Rise in the Geriatric Population; Increasing Use Of Data-Driven Technologies; Increase in Number of Insured Population
- 3.3. Market Restrains
- 3.3.1. Adverse Quality and Safety Implications Of EDIS; Lack of Skilled Healthcare IT Professionals
- 3.4. Market Trends
- 3.4.1. Best of Breed (B.O.B.) Solutions are Anticipated to be the Dominant Segment in Software Type During the Forecast Period
- 4. Market Factor Analysis
- 4.1. Porters Five Forces
- 4.2. Supply/Value Chain
- 4.3. PESTEL analysis
- 4.4. Market Entropy
- 4.5. Patent/Trademark Analysis
- 5. Global Emergency Department Information System Industry Analysis, Insights and Forecast, 2020-2032
- 5.1. Market Analysis, Insights and Forecast - by Application
- 5.1.1. Computerized Physician Order Entry (CPOE)
- 5.1.2. Clinical Documentation
- 5.1.3. Patient Tracking & Triage
- 5.1.4. E-Prescribing
- 5.1.5. Others
- 5.2. Market Analysis, Insights and Forecast - by Deployment
- 5.2.1. On-Premise EDIS
- 5.2.2. Software-As-A-Services (SaaS)
- 5.3. Market Analysis, Insights and Forecast - by Software Type
- 5.3.1. Enterprise Solutions
- 5.3.2. Best of Breed (B.O.B.) Solutions
- 5.4. Market Analysis, Insights and Forecast - by End User
- 5.4.1. Small Hospitals
- 5.4.2. Medium-Sized Hospitals
- 5.4.3. Large Hospitals
- 5.5. Market Analysis, Insights and Forecast - by Region
- 5.5.1. North America
- 5.5.2. Europe
- 5.5.3. Asia Pacific
- 5.5.4. Middle East and Africa
- 5.5.5. South America
- 5.1. Market Analysis, Insights and Forecast - by Application
- 6. North America Emergency Department Information System Industry Analysis, Insights and Forecast, 2020-2032
- 6.1. Market Analysis, Insights and Forecast - by Application
- 6.1.1. Computerized Physician Order Entry (CPOE)
- 6.1.2. Clinical Documentation
- 6.1.3. Patient Tracking & Triage
- 6.1.4. E-Prescribing
- 6.1.5. Others
- 6.2. Market Analysis, Insights and Forecast - by Deployment
- 6.2.1. On-Premise EDIS
- 6.2.2. Software-As-A-Services (SaaS)
- 6.3. Market Analysis, Insights and Forecast - by Software Type
- 6.3.1. Enterprise Solutions
- 6.3.2. Best of Breed (B.O.B.) Solutions
- 6.4. Market Analysis, Insights and Forecast - by End User
- 6.4.1. Small Hospitals
- 6.4.2. Medium-Sized Hospitals
- 6.4.3. Large Hospitals
- 6.1. Market Analysis, Insights and Forecast - by Application
- 7. Europe Emergency Department Information System Industry Analysis, Insights and Forecast, 2020-2032
- 7.1. Market Analysis, Insights and Forecast - by Application
- 7.1.1. Computerized Physician Order Entry (CPOE)
- 7.1.2. Clinical Documentation
- 7.1.3. Patient Tracking & Triage
- 7.1.4. E-Prescribing
- 7.1.5. Others
- 7.2. Market Analysis, Insights and Forecast - by Deployment
- 7.2.1. On-Premise EDIS
- 7.2.2. Software-As-A-Services (SaaS)
- 7.3. Market Analysis, Insights and Forecast - by Software Type
- 7.3.1. Enterprise Solutions
- 7.3.2. Best of Breed (B.O.B.) Solutions
- 7.4. Market Analysis, Insights and Forecast - by End User
- 7.4.1. Small Hospitals
- 7.4.2. Medium-Sized Hospitals
- 7.4.3. Large Hospitals
- 7.1. Market Analysis, Insights and Forecast - by Application
- 8. Asia Pacific Emergency Department Information System Industry Analysis, Insights and Forecast, 2020-2032
- 8.1. Market Analysis, Insights and Forecast - by Application
- 8.1.1. Computerized Physician Order Entry (CPOE)
- 8.1.2. Clinical Documentation
- 8.1.3. Patient Tracking & Triage
- 8.1.4. E-Prescribing
- 8.1.5. Others
- 8.2. Market Analysis, Insights and Forecast - by Deployment
- 8.2.1. On-Premise EDIS
- 8.2.2. Software-As-A-Services (SaaS)
- 8.3. Market Analysis, Insights and Forecast - by Software Type
- 8.3.1. Enterprise Solutions
- 8.3.2. Best of Breed (B.O.B.) Solutions
- 8.4. Market Analysis, Insights and Forecast - by End User
- 8.4.1. Small Hospitals
- 8.4.2. Medium-Sized Hospitals
- 8.4.3. Large Hospitals
- 8.1. Market Analysis, Insights and Forecast - by Application
- 9. Middle East and Africa Emergency Department Information System Industry Analysis, Insights and Forecast, 2020-2032
- 9.1. Market Analysis, Insights and Forecast - by Application
- 9.1.1. Computerized Physician Order Entry (CPOE)
- 9.1.2. Clinical Documentation
- 9.1.3. Patient Tracking & Triage
- 9.1.4. E-Prescribing
- 9.1.5. Others
- 9.2. Market Analysis, Insights and Forecast - by Deployment
- 9.2.1. On-Premise EDIS
- 9.2.2. Software-As-A-Services (SaaS)
- 9.3. Market Analysis, Insights and Forecast - by Software Type
- 9.3.1. Enterprise Solutions
- 9.3.2. Best of Breed (B.O.B.) Solutions
- 9.4. Market Analysis, Insights and Forecast - by End User
- 9.4.1. Small Hospitals
- 9.4.2. Medium-Sized Hospitals
- 9.4.3. Large Hospitals
- 9.1. Market Analysis, Insights and Forecast - by Application
- 10. South America Emergency Department Information System Industry Analysis, Insights and Forecast, 2020-2032
- 10.1. Market Analysis, Insights and Forecast - by Application
- 10.1.1. Computerized Physician Order Entry (CPOE)
- 10.1.2. Clinical Documentation
- 10.1.3. Patient Tracking & Triage
- 10.1.4. E-Prescribing
- 10.1.5. Others
- 10.2. Market Analysis, Insights and Forecast - by Deployment
- 10.2.1. On-Premise EDIS
- 10.2.2. Software-As-A-Services (SaaS)
- 10.3. Market Analysis, Insights and Forecast - by Software Type
- 10.3.1. Enterprise Solutions
- 10.3.2. Best of Breed (B.O.B.) Solutions
- 10.4. Market Analysis, Insights and Forecast - by End User
- 10.4.1. Small Hospitals
- 10.4.2. Medium-Sized Hospitals
- 10.4.3. Large Hospitals
- 10.1. Market Analysis, Insights and Forecast - by Application
- 11. Competitive Analysis
- 11.1. Global Market Share Analysis 2025
- 11.2. Company Profiles
- 11.2.1 Epic Systems
- 11.2.1.1. Overview
- 11.2.1.2. Products
- 11.2.1.3. SWOT Analysis
- 11.2.1.4. Recent Developments
- 11.2.1.5. Financials (Based on Availability)
- 11.2.2 Mckesson Corporation
- 11.2.2.1. Overview
- 11.2.2.2. Products
- 11.2.2.3. SWOT Analysis
- 11.2.2.4. Recent Developments
- 11.2.2.5. Financials (Based on Availability)
- 11.2.3 EPOWERdoc Inc
- 11.2.3.1. Overview
- 11.2.3.2. Products
- 11.2.3.3. SWOT Analysis
- 11.2.3.4. Recent Developments
- 11.2.3.5. Financials (Based on Availability)
- 11.2.4 MEDHOST Inc
- 11.2.4.1. Overview
- 11.2.4.2. Products
- 11.2.4.3. SWOT Analysis
- 11.2.4.4. Recent Developments
- 11.2.4.5. Financials (Based on Availability)
- 11.2.5 Unitedhealth Group Inc
- 11.2.5.1. Overview
- 11.2.5.2. Products
- 11.2.5.3. SWOT Analysis
- 11.2.5.4. Recent Developments
- 11.2.5.5. Financials (Based on Availability)
- 11.2.6 Cerner Corporation
- 11.2.6.1. Overview
- 11.2.6.2. Products
- 11.2.6.3. SWOT Analysis
- 11.2.6.4. Recent Developments
- 11.2.6.5. Financials (Based on Availability)
- 11.2.7 Medical Information Technology Inc
- 11.2.7.1. Overview
- 11.2.7.2. Products
- 11.2.7.3. SWOT Analysis
- 11.2.7.4. Recent Developments
- 11.2.7.5. Financials (Based on Availability)
- 11.2.8 Logibec Canada
- 11.2.8.1. Overview
- 11.2.8.2. Products
- 11.2.8.3. SWOT Analysis
- 11.2.8.4. Recent Developments
- 11.2.8.5. Financials (Based on Availability)
- 11.2.9 Allscripts Healthcare Solutions Inc
- 11.2.9.1. Overview
- 11.2.9.2. Products
- 11.2.9.3. SWOT Analysis
- 11.2.9.4. Recent Developments
- 11.2.9.5. Financials (Based on Availability)
- 11.2.10 T-Systems Inc
- 11.2.10.1. Overview
- 11.2.10.2. Products
- 11.2.10.3. SWOT Analysis
- 11.2.10.4. Recent Developments
- 11.2.10.5. Financials (Based on Availability)
- 11.2.11 Evident
- 11.2.11.1. Overview
- 11.2.11.2. Products
- 11.2.11.3. SWOT Analysis
- 11.2.11.4. Recent Developments
- 11.2.11.5. Financials (Based on Availability)
- 11.2.12 Medsphere Systems Corporation
- 11.2.12.1. Overview
- 11.2.12.2. Products
- 11.2.12.3. SWOT Analysis
- 11.2.12.4. Recent Developments
- 11.2.12.5. Financials (Based on Availability)
- 11.2.1 Epic Systems
List of Figures
- Figure 1: Global Emergency Department Information System Industry Revenue Breakdown (Million, %) by Region 2025 & 2033
- Figure 2: Global Emergency Department Information System Industry Volume Breakdown (K Unit, %) by Region 2025 & 2033
- Figure 3: North America Emergency Department Information System Industry Revenue (Million), by Application 2025 & 2033
- Figure 4: North America Emergency Department Information System Industry Volume (K Unit), by Application 2025 & 2033
- Figure 5: North America Emergency Department Information System Industry Revenue Share (%), by Application 2025 & 2033
- Figure 6: North America Emergency Department Information System Industry Volume Share (%), by Application 2025 & 2033
- Figure 7: North America Emergency Department Information System Industry Revenue (Million), by Deployment 2025 & 2033
- Figure 8: North America Emergency Department Information System Industry Volume (K Unit), by Deployment 2025 & 2033
- Figure 9: North America Emergency Department Information System Industry Revenue Share (%), by Deployment 2025 & 2033
- Figure 10: North America Emergency Department Information System Industry Volume Share (%), by Deployment 2025 & 2033
- Figure 11: North America Emergency Department Information System Industry Revenue (Million), by Software Type 2025 & 2033
- Figure 12: North America Emergency Department Information System Industry Volume (K Unit), by Software Type 2025 & 2033
- Figure 13: North America Emergency Department Information System Industry Revenue Share (%), by Software Type 2025 & 2033
- Figure 14: North America Emergency Department Information System Industry Volume Share (%), by Software Type 2025 & 2033
- Figure 15: North America Emergency Department Information System Industry Revenue (Million), by End User 2025 & 2033
- Figure 16: North America Emergency Department Information System Industry Volume (K Unit), by End User 2025 & 2033
- Figure 17: North America Emergency Department Information System Industry Revenue Share (%), by End User 2025 & 2033
- Figure 18: North America Emergency Department Information System Industry Volume Share (%), by End User 2025 & 2033
- Figure 19: North America Emergency Department Information System Industry Revenue (Million), by Country 2025 & 2033
- Figure 20: North America Emergency Department Information System Industry Volume (K Unit), by Country 2025 & 2033
- Figure 21: North America Emergency Department Information System Industry Revenue Share (%), by Country 2025 & 2033
- Figure 22: North America Emergency Department Information System Industry Volume Share (%), by Country 2025 & 2033
- Figure 23: Europe Emergency Department Information System Industry Revenue (Million), by Application 2025 & 2033
- Figure 24: Europe Emergency Department Information System Industry Volume (K Unit), by Application 2025 & 2033
- Figure 25: Europe Emergency Department Information System Industry Revenue Share (%), by Application 2025 & 2033
- Figure 26: Europe Emergency Department Information System Industry Volume Share (%), by Application 2025 & 2033
- Figure 27: Europe Emergency Department Information System Industry Revenue (Million), by Deployment 2025 & 2033
- Figure 28: Europe Emergency Department Information System Industry Volume (K Unit), by Deployment 2025 & 2033
- Figure 29: Europe Emergency Department Information System Industry Revenue Share (%), by Deployment 2025 & 2033
- Figure 30: Europe Emergency Department Information System Industry Volume Share (%), by Deployment 2025 & 2033
- Figure 31: Europe Emergency Department Information System Industry Revenue (Million), by Software Type 2025 & 2033
- Figure 32: Europe Emergency Department Information System Industry Volume (K Unit), by Software Type 2025 & 2033
- Figure 33: Europe Emergency Department Information System Industry Revenue Share (%), by Software Type 2025 & 2033
- Figure 34: Europe Emergency Department Information System Industry Volume Share (%), by Software Type 2025 & 2033
- Figure 35: Europe Emergency Department Information System Industry Revenue (Million), by End User 2025 & 2033
- Figure 36: Europe Emergency Department Information System Industry Volume (K Unit), by End User 2025 & 2033
- Figure 37: Europe Emergency Department Information System Industry Revenue Share (%), by End User 2025 & 2033
- Figure 38: Europe Emergency Department Information System Industry Volume Share (%), by End User 2025 & 2033
- Figure 39: Europe Emergency Department Information System Industry Revenue (Million), by Country 2025 & 2033
- Figure 40: Europe Emergency Department Information System Industry Volume (K Unit), by Country 2025 & 2033
- Figure 41: Europe Emergency Department Information System Industry Revenue Share (%), by Country 2025 & 2033
- Figure 42: Europe Emergency Department Information System Industry Volume Share (%), by Country 2025 & 2033
- Figure 43: Asia Pacific Emergency Department Information System Industry Revenue (Million), by Application 2025 & 2033
- Figure 44: Asia Pacific Emergency Department Information System Industry Volume (K Unit), by Application 2025 & 2033
- Figure 45: Asia Pacific Emergency Department Information System Industry Revenue Share (%), by Application 2025 & 2033
- Figure 46: Asia Pacific Emergency Department Information System Industry Volume Share (%), by Application 2025 & 2033
- Figure 47: Asia Pacific Emergency Department Information System Industry Revenue (Million), by Deployment 2025 & 2033
- Figure 48: Asia Pacific Emergency Department Information System Industry Volume (K Unit), by Deployment 2025 & 2033
- Figure 49: Asia Pacific Emergency Department Information System Industry Revenue Share (%), by Deployment 2025 & 2033
- Figure 50: Asia Pacific Emergency Department Information System Industry Volume Share (%), by Deployment 2025 & 2033
- Figure 51: Asia Pacific Emergency Department Information System Industry Revenue (Million), by Software Type 2025 & 2033
- Figure 52: Asia Pacific Emergency Department Information System Industry Volume (K Unit), by Software Type 2025 & 2033
- Figure 53: Asia Pacific Emergency Department Information System Industry Revenue Share (%), by Software Type 2025 & 2033
- Figure 54: Asia Pacific Emergency Department Information System Industry Volume Share (%), by Software Type 2025 & 2033
- Figure 55: Asia Pacific Emergency Department Information System Industry Revenue (Million), by End User 2025 & 2033
- Figure 56: Asia Pacific Emergency Department Information System Industry Volume (K Unit), by End User 2025 & 2033
- Figure 57: Asia Pacific Emergency Department Information System Industry Revenue Share (%), by End User 2025 & 2033
- Figure 58: Asia Pacific Emergency Department Information System Industry Volume Share (%), by End User 2025 & 2033
- Figure 59: Asia Pacific Emergency Department Information System Industry Revenue (Million), by Country 2025 & 2033
- Figure 60: Asia Pacific Emergency Department Information System Industry Volume (K Unit), by Country 2025 & 2033
- Figure 61: Asia Pacific Emergency Department Information System Industry Revenue Share (%), by Country 2025 & 2033
- Figure 62: Asia Pacific Emergency Department Information System Industry Volume Share (%), by Country 2025 & 2033
- Figure 63: Middle East and Africa Emergency Department Information System Industry Revenue (Million), by Application 2025 & 2033
- Figure 64: Middle East and Africa Emergency Department Information System Industry Volume (K Unit), by Application 2025 & 2033
- Figure 65: Middle East and Africa Emergency Department Information System Industry Revenue Share (%), by Application 2025 & 2033
- Figure 66: Middle East and Africa Emergency Department Information System Industry Volume Share (%), by Application 2025 & 2033
- Figure 67: Middle East and Africa Emergency Department Information System Industry Revenue (Million), by Deployment 2025 & 2033
- Figure 68: Middle East and Africa Emergency Department Information System Industry Volume (K Unit), by Deployment 2025 & 2033
- Figure 69: Middle East and Africa Emergency Department Information System Industry Revenue Share (%), by Deployment 2025 & 2033
- Figure 70: Middle East and Africa Emergency Department Information System Industry Volume Share (%), by Deployment 2025 & 2033
- Figure 71: Middle East and Africa Emergency Department Information System Industry Revenue (Million), by Software Type 2025 & 2033
- Figure 72: Middle East and Africa Emergency Department Information System Industry Volume (K Unit), by Software Type 2025 & 2033
- Figure 73: Middle East and Africa Emergency Department Information System Industry Revenue Share (%), by Software Type 2025 & 2033
- Figure 74: Middle East and Africa Emergency Department Information System Industry Volume Share (%), by Software Type 2025 & 2033
- Figure 75: Middle East and Africa Emergency Department Information System Industry Revenue (Million), by End User 2025 & 2033
- Figure 76: Middle East and Africa Emergency Department Information System Industry Volume (K Unit), by End User 2025 & 2033
- Figure 77: Middle East and Africa Emergency Department Information System Industry Revenue Share (%), by End User 2025 & 2033
- Figure 78: Middle East and Africa Emergency Department Information System Industry Volume Share (%), by End User 2025 & 2033
- Figure 79: Middle East and Africa Emergency Department Information System Industry Revenue (Million), by Country 2025 & 2033
- Figure 80: Middle East and Africa Emergency Department Information System Industry Volume (K Unit), by Country 2025 & 2033
- Figure 81: Middle East and Africa Emergency Department Information System Industry Revenue Share (%), by Country 2025 & 2033
- Figure 82: Middle East and Africa Emergency Department Information System Industry Volume Share (%), by Country 2025 & 2033
- Figure 83: South America Emergency Department Information System Industry Revenue (Million), by Application 2025 & 2033
- Figure 84: South America Emergency Department Information System Industry Volume (K Unit), by Application 2025 & 2033
- Figure 85: South America Emergency Department Information System Industry Revenue Share (%), by Application 2025 & 2033
- Figure 86: South America Emergency Department Information System Industry Volume Share (%), by Application 2025 & 2033
- Figure 87: South America Emergency Department Information System Industry Revenue (Million), by Deployment 2025 & 2033
- Figure 88: South America Emergency Department Information System Industry Volume (K Unit), by Deployment 2025 & 2033
- Figure 89: South America Emergency Department Information System Industry Revenue Share (%), by Deployment 2025 & 2033
- Figure 90: South America Emergency Department Information System Industry Volume Share (%), by Deployment 2025 & 2033
- Figure 91: South America Emergency Department Information System Industry Revenue (Million), by Software Type 2025 & 2033
- Figure 92: South America Emergency Department Information System Industry Volume (K Unit), by Software Type 2025 & 2033
- Figure 93: South America Emergency Department Information System Industry Revenue Share (%), by Software Type 2025 & 2033
- Figure 94: South America Emergency Department Information System Industry Volume Share (%), by Software Type 2025 & 2033
- Figure 95: South America Emergency Department Information System Industry Revenue (Million), by End User 2025 & 2033
- Figure 96: South America Emergency Department Information System Industry Volume (K Unit), by End User 2025 & 2033
- Figure 97: South America Emergency Department Information System Industry Revenue Share (%), by End User 2025 & 2033
- Figure 98: South America Emergency Department Information System Industry Volume Share (%), by End User 2025 & 2033
- Figure 99: South America Emergency Department Information System Industry Revenue (Million), by Country 2025 & 2033
- Figure 100: South America Emergency Department Information System Industry Volume (K Unit), by Country 2025 & 2033
- Figure 101: South America Emergency Department Information System Industry Revenue Share (%), by Country 2025 & 2033
- Figure 102: South America Emergency Department Information System Industry Volume Share (%), by Country 2025 & 2033
List of Tables
- Table 1: Global Emergency Department Information System Industry Revenue Million Forecast, by Application 2020 & 2033
- Table 2: Global Emergency Department Information System Industry Volume K Unit Forecast, by Application 2020 & 2033
- Table 3: Global Emergency Department Information System Industry Revenue Million Forecast, by Deployment 2020 & 2033
- Table 4: Global Emergency Department Information System Industry Volume K Unit Forecast, by Deployment 2020 & 2033
- Table 5: Global Emergency Department Information System Industry Revenue Million Forecast, by Software Type 2020 & 2033
- Table 6: Global Emergency Department Information System Industry Volume K Unit Forecast, by Software Type 2020 & 2033
- Table 7: Global Emergency Department Information System Industry Revenue Million Forecast, by End User 2020 & 2033
- Table 8: Global Emergency Department Information System Industry Volume K Unit Forecast, by End User 2020 & 2033
- Table 9: Global Emergency Department Information System Industry Revenue Million Forecast, by Region 2020 & 2033
- Table 10: Global Emergency Department Information System Industry Volume K Unit Forecast, by Region 2020 & 2033
- Table 11: Global Emergency Department Information System Industry Revenue Million Forecast, by Application 2020 & 2033
- Table 12: Global Emergency Department Information System Industry Volume K Unit Forecast, by Application 2020 & 2033
- Table 13: Global Emergency Department Information System Industry Revenue Million Forecast, by Deployment 2020 & 2033
- Table 14: Global Emergency Department Information System Industry Volume K Unit Forecast, by Deployment 2020 & 2033
- Table 15: Global Emergency Department Information System Industry Revenue Million Forecast, by Software Type 2020 & 2033
- Table 16: Global Emergency Department Information System Industry Volume K Unit Forecast, by Software Type 2020 & 2033
- Table 17: Global Emergency Department Information System Industry Revenue Million Forecast, by End User 2020 & 2033
- Table 18: Global Emergency Department Information System Industry Volume K Unit Forecast, by End User 2020 & 2033
- Table 19: Global Emergency Department Information System Industry Revenue Million Forecast, by Country 2020 & 2033
- Table 20: Global Emergency Department Information System Industry Volume K Unit Forecast, by Country 2020 & 2033
- Table 21: United States Emergency Department Information System Industry Revenue (Million) Forecast, by Application 2020 & 2033
- Table 22: United States Emergency Department Information System Industry Volume (K Unit) Forecast, by Application 2020 & 2033
- Table 23: Canada Emergency Department Information System Industry Revenue (Million) Forecast, by Application 2020 & 2033
- Table 24: Canada Emergency Department Information System Industry Volume (K Unit) Forecast, by Application 2020 & 2033
- Table 25: Mexico Emergency Department Information System Industry Revenue (Million) Forecast, by Application 2020 & 2033
- Table 26: Mexico Emergency Department Information System Industry Volume (K Unit) Forecast, by Application 2020 & 2033
- Table 27: Global Emergency Department Information System Industry Revenue Million Forecast, by Application 2020 & 2033
- Table 28: Global Emergency Department Information System Industry Volume K Unit Forecast, by Application 2020 & 2033
- Table 29: Global Emergency Department Information System Industry Revenue Million Forecast, by Deployment 2020 & 2033
- Table 30: Global Emergency Department Information System Industry Volume K Unit Forecast, by Deployment 2020 & 2033
- Table 31: Global Emergency Department Information System Industry Revenue Million Forecast, by Software Type 2020 & 2033
- Table 32: Global Emergency Department Information System Industry Volume K Unit Forecast, by Software Type 2020 & 2033
- Table 33: Global Emergency Department Information System Industry Revenue Million Forecast, by End User 2020 & 2033
- Table 34: Global Emergency Department Information System Industry Volume K Unit Forecast, by End User 2020 & 2033
- Table 35: Global Emergency Department Information System Industry Revenue Million Forecast, by Country 2020 & 2033
- Table 36: Global Emergency Department Information System Industry Volume K Unit Forecast, by Country 2020 & 2033
- Table 37: Germany Emergency Department Information System Industry Revenue (Million) Forecast, by Application 2020 & 2033
- Table 38: Germany Emergency Department Information System Industry Volume (K Unit) Forecast, by Application 2020 & 2033
- Table 39: United Kingdom Emergency Department Information System Industry Revenue (Million) Forecast, by Application 2020 & 2033
- Table 40: United Kingdom Emergency Department Information System Industry Volume (K Unit) Forecast, by Application 2020 & 2033
- Table 41: France Emergency Department Information System Industry Revenue (Million) Forecast, by Application 2020 & 2033
- Table 42: France Emergency Department Information System Industry Volume (K Unit) Forecast, by Application 2020 & 2033
- Table 43: Italy Emergency Department Information System Industry Revenue (Million) Forecast, by Application 2020 & 2033
- Table 44: Italy Emergency Department Information System Industry Volume (K Unit) Forecast, by Application 2020 & 2033
- Table 45: Spain Emergency Department Information System Industry Revenue (Million) Forecast, by Application 2020 & 2033
- Table 46: Spain Emergency Department Information System Industry Volume (K Unit) Forecast, by Application 2020 & 2033
- Table 47: Rest of Europe Emergency Department Information System Industry Revenue (Million) Forecast, by Application 2020 & 2033
- Table 48: Rest of Europe Emergency Department Information System Industry Volume (K Unit) Forecast, by Application 2020 & 2033
- Table 49: Global Emergency Department Information System Industry Revenue Million Forecast, by Application 2020 & 2033
- Table 50: Global Emergency Department Information System Industry Volume K Unit Forecast, by Application 2020 & 2033
- Table 51: Global Emergency Department Information System Industry Revenue Million Forecast, by Deployment 2020 & 2033
- Table 52: Global Emergency Department Information System Industry Volume K Unit Forecast, by Deployment 2020 & 2033
- Table 53: Global Emergency Department Information System Industry Revenue Million Forecast, by Software Type 2020 & 2033
- Table 54: Global Emergency Department Information System Industry Volume K Unit Forecast, by Software Type 2020 & 2033
- Table 55: Global Emergency Department Information System Industry Revenue Million Forecast, by End User 2020 & 2033
- Table 56: Global Emergency Department Information System Industry Volume K Unit Forecast, by End User 2020 & 2033
- Table 57: Global Emergency Department Information System Industry Revenue Million Forecast, by Country 2020 & 2033
- Table 58: Global Emergency Department Information System Industry Volume K Unit Forecast, by Country 2020 & 2033
- Table 59: China Emergency Department Information System Industry Revenue (Million) Forecast, by Application 2020 & 2033
- Table 60: China Emergency Department Information System Industry Volume (K Unit) Forecast, by Application 2020 & 2033
- Table 61: Japan Emergency Department Information System Industry Revenue (Million) Forecast, by Application 2020 & 2033
- Table 62: Japan Emergency Department Information System Industry Volume (K Unit) Forecast, by Application 2020 & 2033
- Table 63: India Emergency Department Information System Industry Revenue (Million) Forecast, by Application 2020 & 2033
- Table 64: India Emergency Department Information System Industry Volume (K Unit) Forecast, by Application 2020 & 2033
- Table 65: Australia Emergency Department Information System Industry Revenue (Million) Forecast, by Application 2020 & 2033
- Table 66: Australia Emergency Department Information System Industry Volume (K Unit) Forecast, by Application 2020 & 2033
- Table 67: South Korea Emergency Department Information System Industry Revenue (Million) Forecast, by Application 2020 & 2033
- Table 68: South Korea Emergency Department Information System Industry Volume (K Unit) Forecast, by Application 2020 & 2033
- Table 69: Rest of Asia Pacific Emergency Department Information System Industry Revenue (Million) Forecast, by Application 2020 & 2033
- Table 70: Rest of Asia Pacific Emergency Department Information System Industry Volume (K Unit) Forecast, by Application 2020 & 2033
- Table 71: Global Emergency Department Information System Industry Revenue Million Forecast, by Application 2020 & 2033
- Table 72: Global Emergency Department Information System Industry Volume K Unit Forecast, by Application 2020 & 2033
- Table 73: Global Emergency Department Information System Industry Revenue Million Forecast, by Deployment 2020 & 2033
- Table 74: Global Emergency Department Information System Industry Volume K Unit Forecast, by Deployment 2020 & 2033
- Table 75: Global Emergency Department Information System Industry Revenue Million Forecast, by Software Type 2020 & 2033
- Table 76: Global Emergency Department Information System Industry Volume K Unit Forecast, by Software Type 2020 & 2033
- Table 77: Global Emergency Department Information System Industry Revenue Million Forecast, by End User 2020 & 2033
- Table 78: Global Emergency Department Information System Industry Volume K Unit Forecast, by End User 2020 & 2033
- Table 79: Global Emergency Department Information System Industry Revenue Million Forecast, by Country 2020 & 2033
- Table 80: Global Emergency Department Information System Industry Volume K Unit Forecast, by Country 2020 & 2033
- Table 81: GCC Emergency Department Information System Industry Revenue (Million) Forecast, by Application 2020 & 2033
- Table 82: GCC Emergency Department Information System Industry Volume (K Unit) Forecast, by Application 2020 & 2033
- Table 83: South Africa Emergency Department Information System Industry Revenue (Million) Forecast, by Application 2020 & 2033
- Table 84: South Africa Emergency Department Information System Industry Volume (K Unit) Forecast, by Application 2020 & 2033
- Table 85: Rest of Middle East and Africa Emergency Department Information System Industry Revenue (Million) Forecast, by Application 2020 & 2033
- Table 86: Rest of Middle East and Africa Emergency Department Information System Industry Volume (K Unit) Forecast, by Application 2020 & 2033
- Table 87: Global Emergency Department Information System Industry Revenue Million Forecast, by Application 2020 & 2033
- Table 88: Global Emergency Department Information System Industry Volume K Unit Forecast, by Application 2020 & 2033
- Table 89: Global Emergency Department Information System Industry Revenue Million Forecast, by Deployment 2020 & 2033
- Table 90: Global Emergency Department Information System Industry Volume K Unit Forecast, by Deployment 2020 & 2033
- Table 91: Global Emergency Department Information System Industry Revenue Million Forecast, by Software Type 2020 & 2033
- Table 92: Global Emergency Department Information System Industry Volume K Unit Forecast, by Software Type 2020 & 2033
- Table 93: Global Emergency Department Information System Industry Revenue Million Forecast, by End User 2020 & 2033
- Table 94: Global Emergency Department Information System Industry Volume K Unit Forecast, by End User 2020 & 2033
- Table 95: Global Emergency Department Information System Industry Revenue Million Forecast, by Country 2020 & 2033
- Table 96: Global Emergency Department Information System Industry Volume K Unit Forecast, by Country 2020 & 2033
- Table 97: Brazil Emergency Department Information System Industry Revenue (Million) Forecast, by Application 2020 & 2033
- Table 98: Brazil Emergency Department Information System Industry Volume (K Unit) Forecast, by Application 2020 & 2033
- Table 99: Argentina Emergency Department Information System Industry Revenue (Million) Forecast, by Application 2020 & 2033
- Table 100: Argentina Emergency Department Information System Industry Volume (K Unit) Forecast, by Application 2020 & 2033
- Table 101: Rest of South America Emergency Department Information System Industry Revenue (Million) Forecast, by Application 2020 & 2033
- Table 102: Rest of South America Emergency Department Information System Industry Volume (K Unit) Forecast, by Application 2020 & 2033
Frequently Asked Questions
1. What is the projected Compound Annual Growth Rate (CAGR) of the Emergency Department Information System Industry?
The projected CAGR is approximately 14.37%.
2. Which companies are prominent players in the Emergency Department Information System Industry?
Key companies in the market include Epic Systems, Mckesson Corporation, EPOWERdoc Inc, MEDHOST Inc, Unitedhealth Group Inc, Cerner Corporation, Medical Information Technology Inc, Logibec Canada, Allscripts Healthcare Solutions Inc, T-Systems Inc, Evident, Medsphere Systems Corporation.
3. What are the main segments of the Emergency Department Information System Industry?
The market segments include Application, Deployment, Software Type, End User.
4. Can you provide details about the market size?
The market size is estimated to be USD 1.03 Million as of 2022.
5. What are some drivers contributing to market growth?
Rise in the Geriatric Population; Increasing Use Of Data-Driven Technologies; Increase in Number of Insured Population.
6. What are the notable trends driving market growth?
Best of Breed (B.O.B.) Solutions are Anticipated to be the Dominant Segment in Software Type During the Forecast Period.
7. Are there any restraints impacting market growth?
Adverse Quality and Safety Implications Of EDIS; Lack of Skilled Healthcare IT Professionals.
8. Can you provide examples of recent developments in the market?
In March 2022, HeartBeam, Inc. signed a Business Associate Agreement (BAA) and a Clinical Trial Agreement (CTA) with Phoebe Putney Health System to conduct a pilot study designed to evaluate HeartBeam's Emergency Department (ED) Myocardial Infarction (MI) software product.
9. What pricing options are available for accessing the report?
Pricing options include single-user, multi-user, and enterprise licenses priced at USD 4750, USD 5250, and USD 8750 respectively.
10. Is the market size provided in terms of value or volume?
The market size is provided in terms of value, measured in Million and volume, measured in K Unit.
11. Are there any specific market keywords associated with the report?
Yes, the market keyword associated with the report is "Emergency Department Information System Industry," which aids in identifying and referencing the specific market segment covered.
12. How do I determine which pricing option suits my needs best?
The pricing options vary based on user requirements and access needs. Individual users may opt for single-user licenses, while businesses requiring broader access may choose multi-user or enterprise licenses for cost-effective access to the report.
13. Are there any additional resources or data provided in the Emergency Department Information System Industry report?
While the report offers comprehensive insights, it's advisable to review the specific contents or supplementary materials provided to ascertain if additional resources or data are available.
14. How can I stay updated on further developments or reports in the Emergency Department Information System Industry?
To stay informed about further developments, trends, and reports in the Emergency Department Information System Industry, consider subscribing to industry newsletters, following relevant companies and organizations, or regularly checking reputable industry news sources and publications.
Methodology
Step 1 - Identification of Relevant Samples Size from Population Database


Step 2 - Approaches for Defining Global Market Size (Value, Volume* & Price*)

Note*: In applicable scenarios
Step 3 - Data Sources
Primary Research
- Web Analytics
- Survey Reports
- Research Institute
- Latest Research Reports
- Opinion Leaders
Secondary Research
- Annual Reports
- White Paper
- Latest Press Release
- Industry Association
- Paid Database
- Investor Presentations

Step 4 - Data Triangulation
Involves using different sources of information in order to increase the validity of a study
These sources are likely to be stakeholders in a program - participants, other researchers, program staff, other community members, and so on.
Then we put all data in single framework & apply various statistical tools to find out the dynamic on the market.
During the analysis stage, feedback from the stakeholder groups would be compared to determine areas of agreement as well as areas of divergence