

Key Insights
The global energy drinks market is projected for significant expansion, with a Compound Annual Growth Rate (CAGR) of 9.7%. The market is anticipated to grow from an estimated 23.9 billion in the base year 2025, reaching substantial future valuations. This robust growth is propelled by increasing consumer demand for convenient, functional beverages, especially among young adults and active individuals seeking performance enhancement and improved focus. The prevalence of demanding lifestyles and rigorous work schedules further fuels this market expansion. Emerging trends, including the rising popularity of natural and organic formulations, sugar-free or low-calorie alternatives, and innovative packaging solutions, are actively shaping consumer preferences and driving product diversification.
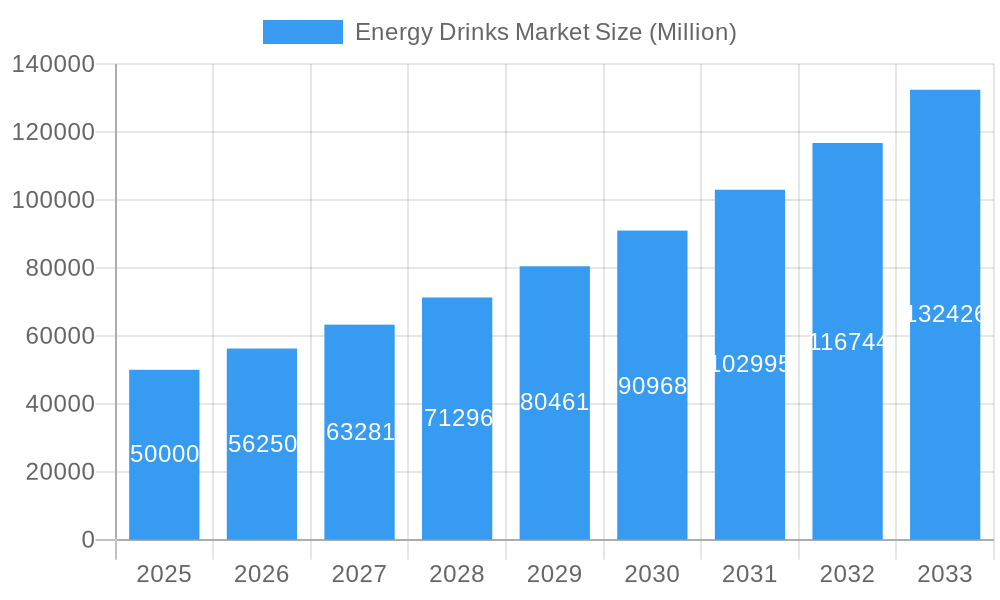
Energy Drinks Market Market Size (In Billion)
While the on-trade sector remains a vital component, the off-trade channel is experiencing considerable growth, largely due to the expansion of online retail and broader supermarket accessibility. However, potential market restraints include growing consumer health concerns associated with high sugar content and the potential adverse effects of excessive caffeine consumption. Regulatory oversight concerning ingredients and marketing practices also presents challenges for industry participants.
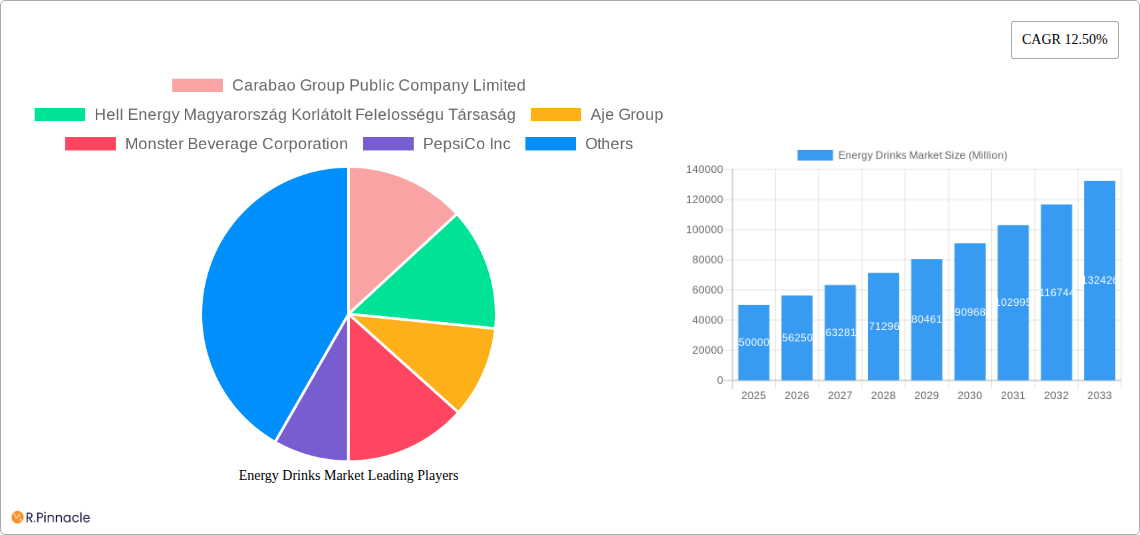
Energy Drinks Market Company Market Share
Despite these hurdles, the energy drinks market is poised for sustained growth, driven by continuous product innovation and strategic marketing initiatives. Leading companies such as Red Bull, Monster Beverage, Coca-Cola, and PepsiCo continue to maintain market dominance through strong brand recognition and extensive distribution networks. Concurrently, smaller, specialized players focusing on natural ingredients and specific functional benefits are gaining traction, signaling a discernible shift towards healthier beverage options. This dynamic competitive environment, coupled with a strategic focus on expanding into new geographical territories and reaching underserved consumer segments, will define the future trajectory of the energy drinks industry. Market segmentation, encompassing categories like energy shots, natural/organic, sugar-free/low-calorie, traditional, and other variants, alongside packaging types such as glass bottles, metal cans, and PET bottles, underscores the diverse consumer preferences and the ongoing industry efforts to meet a wide spectrum of needs.
Energy Drinks Market Report: 2019-2033
This comprehensive report provides a detailed analysis of the global energy drinks market, offering invaluable insights for industry professionals, investors, and strategic decision-makers. Covering the period from 2019 to 2033, with a focus on 2025, this report delivers a thorough understanding of market dynamics, competitive landscapes, and future growth prospects. The study period encompasses the historical period (2019-2024), the base year (2025), and the forecast period (2025-2033). The report leverages extensive data and analysis to provide actionable strategies for navigating this dynamic market.
Energy Drinks Market Structure & Innovation Trends
This section analyzes the competitive landscape, innovative trends, and regulatory environment shaping the energy drinks market. We examine market concentration, identifying key players and their respective market shares. Furthermore, the report explores the drivers of innovation, including technological advancements and changing consumer preferences. The impact of regulatory frameworks and the presence of product substitutes are also evaluated. Finally, we delve into mergers and acquisitions (M&A) activities, analyzing deal values and their strategic implications.
- Market Concentration: The market is characterized by a mix of large multinational corporations and smaller niche players. The top 5 players account for approximately xx% of the global market share in 2025, estimated to be worth xx Million.
- Innovation Drivers: The key drivers of innovation include the development of new flavors, functional ingredients (e.g., added vitamins, antioxidants), and sustainable packaging solutions.
- Regulatory Frameworks: Government regulations regarding sugar content, caffeine levels, and marketing practices significantly impact market dynamics.
- Product Substitutes: The energy drinks market faces competition from sports drinks, coffee, and other functional beverages.
- End-User Demographics: The primary target demographic for energy drinks is young adults, but the market is expanding to encompass broader age groups and lifestyle segments.
- M&A Activities: The past five years have witnessed xx M&A deals in the energy drinks market, with a total value of approximately xx Million. These activities reflect a strategy of consolidation and expansion within the industry.
Energy Drinks Market Dynamics & Trends
This section provides a detailed analysis of the factors driving market growth, including changing consumer preferences, technological disruptions, and competitive dynamics. We examine the Compound Annual Growth Rate (CAGR) and market penetration rates to forecast future market size. The impact of health and wellness trends, as well as evolving consumer demand for natural and organic options, is meticulously examined.
The market is experiencing a growth CAGR of xx% during the forecast period (2025-2033), driven by factors such as rising disposable incomes, increasing urbanization, and the growing popularity of active lifestyles. Market penetration rates vary significantly across regions, with mature markets exhibiting slower growth compared to emerging markets. The shift towards healthier options, with the rise in demand for sugar-free and natural energy drinks, is creating new opportunities. Competitive dynamics are intensely competitive, characterized by frequent product launches, marketing campaigns, and strategic partnerships.
Dominant Regions & Segments in Energy Drinks Market
This section pinpoints the leading regions and segments within the energy drinks market. This analysis identifies key growth drivers within each segment (On-trade, Energy Shots, Natural/Organic Energy Drinks, Sugar-free/Low-calorie Energy Drinks, Traditional Energy Drinks, Other Energy Drinks, Glass Bottles, Metal Can, PET Bottles, and Off-trade distribution channels) and dominant geographical regions. We delve into the reasons behind their dominance, analyzing economic policies, infrastructure development, and consumer behavior.
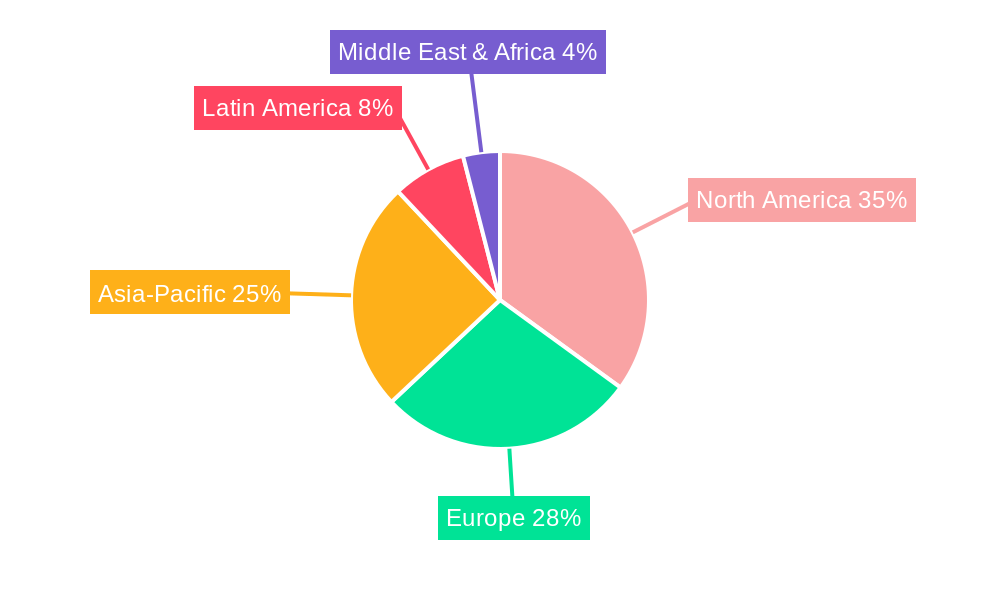
- Leading Region: North America currently holds the largest market share, followed by Europe and Asia-Pacific.
- Key Drivers:
- North America: High per capita consumption, strong brand presence, and established distribution networks.
- Europe: Growing health-conscious consumer base, increasing demand for functional beverages.
- Asia-Pacific: Rapid economic growth, rising disposable incomes, and expanding young adult population.
- Dominant Segments: Traditional energy drinks continue to dominate the market, but the segment of sugar-free/low-calorie and natural/organic energy drinks is experiencing rapid growth. Metal cans are the most widely used packaging type. Off-trade channels account for the majority of sales.
Energy Drinks Market Product Innovations
The energy drinks market is witnessing continuous product innovation. Companies are introducing new flavors, formats (e.g., energy shots), and functional ingredients to cater to evolving consumer preferences. The emphasis is on creating healthier options with lower sugar content and natural ingredients. Technological advancements, such as improved manufacturing processes and sustainable packaging solutions, are further driving innovation in the industry. This has fostered competition amongst established brands and fueled the entry of new players seeking a market niche. This leads to a more diverse and dynamic market.
Report Scope & Segmentation Analysis
This report segments the energy drinks market based on soft drink type (Energy Shots, Natural/Organic Energy Drinks, Sugar-free or Low-calories Energy Drinks, Traditional Energy Drinks, Other Energy Drinks), packaging type (Glass Bottles, Metal Can, PET Bottles), and distribution channel (Off-trade, On-trade). Each segment's growth projection, market size, and competitive landscape are analyzed individually. The insights reveal market dynamics within specific segments and highlight opportunities for strategic market entry or expansion.
- Soft Drink Type: Traditional energy drinks currently dominate, however, sugar-free and natural options are demonstrating significant growth potential.
- Packaging Type: Metal cans remain the most prevalent packaging, followed by PET bottles.
- Distribution Channel: The off-trade channel is the major driver of market sales.
Key Drivers of Energy Drinks Market Growth
Several key factors are propelling the growth of the energy drinks market. These include the rising prevalence of busy lifestyles and increased demand for convenient energy boosts. Technological advancements, including improved manufacturing processes, contribute to efficiency and lower production costs. Furthermore, favorable economic conditions in several key regions create a wider consumer base with disposable income to spend on premium products. Supportive government regulations and policies also contribute to market expansion.
Challenges in the Energy Drinks Market Sector
The energy drinks market faces several challenges, including increasing health concerns surrounding high sugar and caffeine content. Regulatory scrutiny on marketing practices and ingredients poses a significant hurdle. Supply chain disruptions and fluctuating raw material prices can impact profitability. Intense competition among established and emerging brands creates a fiercely contested market. These factors add complexity and risk to business operations in the industry.
Emerging Opportunities in Energy Drinks Market
Despite the challenges, several opportunities exist within the energy drinks market. The rising demand for healthier options, including natural, organic, and low-sugar varieties, presents significant growth potential. The increasing popularity of energy shots and functional beverages creates additional market segments to explore. Expansion into new geographic markets, particularly in developing economies, offers significant growth potential. Furthermore, innovations in packaging and distribution can enhance market reach and efficiency.
Leading Players in the Energy Drinks Market Market
- Carabao Group Public Company Limited
- Hell Energy Magyarország Korlátolt Felelosségu Társaság
- Aje Group
- Monster Beverage Corporation
- PepsiCo Inc
- The Coca-Cola Company
- Suntory Holdings Limited
- Red Bull GmbH
- Living Essentials LLC
- T C Pharmaceutical Industries Company Limited
- Taisho Pharmaceutical Holdings Co Ltd
- Congo Brands
- Osotspa Public Company Limited
Key Developments in Energy Drinks Market Industry
- September 2023: PepsiCo India launched a limited edition flavor of its Sting Energy drink, called Sting Blue Current.
- September 2023: Red Bull unveiled its first limited Winter Edition in the United Kingdom.
- October 2023: Quality Pack International and an Azerbaijani company established a joint venture to build an aluminum can manufacturing and beverage filling factory.
Future Outlook for Energy Drinks Market Market
The future of the energy drinks market looks promising, driven by continuous innovation, evolving consumer preferences, and expansion into new markets. Strategic partnerships, mergers, and acquisitions will continue to shape the competitive landscape. The focus on healthier and more sustainable options will be key to long-term success within this industry. Further market growth is projected, driven by a confluence of economic, social, and technological trends.
Energy Drinks Market Segmentation
-
1. Soft Drink Type
- 1.1. Energy Shots
- 1.2. Natural/Organic Energy Drinks
- 1.3. Sugar-free or Low-calories Energy Drinks
- 1.4. Traditional Energy Drinks
- 1.5. Other Energy Drinks
-
2. Packaging Type
- 2.1. Glass Bottles
- 2.2. Metal Can
- 2.3. PET Bottles
-
3. Distribution Channel
-
3.1. Off-trade
- 3.1.1. Convenience Stores
- 3.1.2. Online Retail
- 3.1.3. Supermarket/Hypermarket
- 3.1.4. Others
- 3.2. On-trade
-
3.1. Off-trade
Energy Drinks Market Segmentation By Geography
-
1. North America
- 1.1. United States
- 1.2. Canada
- 1.3. Mexico
-
2. South America
- 2.1. Brazil
- 2.2. Argentina
- 2.3. Rest of South America
-
3. Europe
- 3.1. United Kingdom
- 3.2. Germany
- 3.3. France
- 3.4. Italy
- 3.5. Spain
- 3.6. Russia
- 3.7. Benelux
- 3.8. Nordics
- 3.9. Rest of Europe
-
4. Middle East & Africa
- 4.1. Turkey
- 4.2. Israel
- 4.3. GCC
- 4.4. North Africa
- 4.5. South Africa
- 4.6. Rest of Middle East & Africa
-
5. Asia Pacific
- 5.1. China
- 5.2. India
- 5.3. Japan
- 5.4. South Korea
- 5.5. ASEAN
- 5.6. Oceania
- 5.7. Rest of Asia Pacific
Energy Drinks Market Regional Market Share
Geographic Coverage of Energy Drinks Market
Energy Drinks Market REPORT HIGHLIGHTS
| Aspects | Details |
|---|---|
| Study Period | 2020-2034 |
| Base Year | 2025 |
| Estimated Year | 2026 |
| Forecast Period | 2026-2034 |
| Historical Period | 2020-2025 |
| Growth Rate | CAGR of 9.7% from 2020-2034 |
| Segmentation |
|
Table of Contents
- 1. Introduction
- 1.1. Research Scope
- 1.2. Market Segmentation
- 1.3. Research Objective
- 1.4. Definitions and Assumptions
- 2. Executive Summary
- 2.1. Market Snapshot
- 3. Market Dynamics
- 3.1. Market Drivers
- 3.2. Market Restrains
- 3.3. Market Trends
- 3.4. Market Opportunities
- 4. Market Factor Analysis
- 4.1. Porters Five Forces
- 4.1.1. Bargaining Power of Suppliers
- 4.1.2. Bargaining Power of Buyers
- 4.1.3. Threat of New Entrants
- 4.1.4. Threat of Substitutes
- 4.1.5. Competitive Rivalry
- 4.2. PESTEL analysis
- 4.3. BCG Analysis
- 4.3.1. Stars (High Growth, High Market Share)
- 4.3.2. Cash Cows (Low Growth, High Market Share)
- 4.3.3. Question Mark (High Growth, Low Market Share)
- 4.3.4. Dogs (Low Growth, Low Market Share)
- 4.4. Ansoff Matrix Analysis
- 4.5. Supply Chain Analysis
- 4.6. Regulatory Landscape
- 4.7. Current Market Potential and Opportunity Assessment (TAM–SAM–SOM Framework)
- 4.8. PRI Analyst Note
- 4.1. Porters Five Forces
- 5. Market Analysis, Insights and Forecast 2021-2033
- 5.1. Market Analysis, Insights and Forecast - by Soft Drink Type
- 5.1.1. Energy Shots
- 5.1.2. Natural/Organic Energy Drinks
- 5.1.3. Sugar-free or Low-calories Energy Drinks
- 5.1.4. Traditional Energy Drinks
- 5.1.5. Other Energy Drinks
- 5.2. Market Analysis, Insights and Forecast - by Packaging Type
- 5.2.1. Glass Bottles
- 5.2.2. Metal Can
- 5.2.3. PET Bottles
- 5.3. Market Analysis, Insights and Forecast - by Distribution Channel
- 5.3.1. Off-trade
- 5.3.1.1. Convenience Stores
- 5.3.1.2. Online Retail
- 5.3.1.3. Supermarket/Hypermarket
- 5.3.1.4. Others
- 5.3.2. On-trade
- 5.3.1. Off-trade
- 5.4. Market Analysis, Insights and Forecast - by Region
- 5.4.1. North America
- 5.4.2. South America
- 5.4.3. Europe
- 5.4.4. Middle East & Africa
- 5.4.5. Asia Pacific
- 5.1. Market Analysis, Insights and Forecast - by Soft Drink Type
- 6. Global Energy Drinks Market Analysis, Insights and Forecast, 2021-2033
- 6.1. Market Analysis, Insights and Forecast - by Soft Drink Type
- 6.1.1. Energy Shots
- 6.1.2. Natural/Organic Energy Drinks
- 6.1.3. Sugar-free or Low-calories Energy Drinks
- 6.1.4. Traditional Energy Drinks
- 6.1.5. Other Energy Drinks
- 6.2. Market Analysis, Insights and Forecast - by Packaging Type
- 6.2.1. Glass Bottles
- 6.2.2. Metal Can
- 6.2.3. PET Bottles
- 6.3. Market Analysis, Insights and Forecast - by Distribution Channel
- 6.3.1. Off-trade
- 6.3.1.1. Convenience Stores
- 6.3.1.2. Online Retail
- 6.3.1.3. Supermarket/Hypermarket
- 6.3.1.4. Others
- 6.3.2. On-trade
- 6.3.1. Off-trade
- 6.1. Market Analysis, Insights and Forecast - by Soft Drink Type
- 7. North America Energy Drinks Market Analysis, Insights and Forecast, 2020-2032
- 7.1. Market Analysis, Insights and Forecast - by Soft Drink Type
- 7.1.1. Energy Shots
- 7.1.2. Natural/Organic Energy Drinks
- 7.1.3. Sugar-free or Low-calories Energy Drinks
- 7.1.4. Traditional Energy Drinks
- 7.1.5. Other Energy Drinks
- 7.2. Market Analysis, Insights and Forecast - by Packaging Type
- 7.2.1. Glass Bottles
- 7.2.2. Metal Can
- 7.2.3. PET Bottles
- 7.3. Market Analysis, Insights and Forecast - by Distribution Channel
- 7.3.1. Off-trade
- 7.3.1.1. Convenience Stores
- 7.3.1.2. Online Retail
- 7.3.1.3. Supermarket/Hypermarket
- 7.3.1.4. Others
- 7.3.2. On-trade
- 7.3.1. Off-trade
- 7.1. Market Analysis, Insights and Forecast - by Soft Drink Type
- 8. South America Energy Drinks Market Analysis, Insights and Forecast, 2020-2032
- 8.1. Market Analysis, Insights and Forecast - by Soft Drink Type
- 8.1.1. Energy Shots
- 8.1.2. Natural/Organic Energy Drinks
- 8.1.3. Sugar-free or Low-calories Energy Drinks
- 8.1.4. Traditional Energy Drinks
- 8.1.5. Other Energy Drinks
- 8.2. Market Analysis, Insights and Forecast - by Packaging Type
- 8.2.1. Glass Bottles
- 8.2.2. Metal Can
- 8.2.3. PET Bottles
- 8.3. Market Analysis, Insights and Forecast - by Distribution Channel
- 8.3.1. Off-trade
- 8.3.1.1. Convenience Stores
- 8.3.1.2. Online Retail
- 8.3.1.3. Supermarket/Hypermarket
- 8.3.1.4. Others
- 8.3.2. On-trade
- 8.3.1. Off-trade
- 8.1. Market Analysis, Insights and Forecast - by Soft Drink Type
- 9. Europe Energy Drinks Market Analysis, Insights and Forecast, 2020-2032
- 9.1. Market Analysis, Insights and Forecast - by Soft Drink Type
- 9.1.1. Energy Shots
- 9.1.2. Natural/Organic Energy Drinks
- 9.1.3. Sugar-free or Low-calories Energy Drinks
- 9.1.4. Traditional Energy Drinks
- 9.1.5. Other Energy Drinks
- 9.2. Market Analysis, Insights and Forecast - by Packaging Type
- 9.2.1. Glass Bottles
- 9.2.2. Metal Can
- 9.2.3. PET Bottles
- 9.3. Market Analysis, Insights and Forecast - by Distribution Channel
- 9.3.1. Off-trade
- 9.3.1.1. Convenience Stores
- 9.3.1.2. Online Retail
- 9.3.1.3. Supermarket/Hypermarket
- 9.3.1.4. Others
- 9.3.2. On-trade
- 9.3.1. Off-trade
- 9.1. Market Analysis, Insights and Forecast - by Soft Drink Type
- 10. Middle East & Africa Energy Drinks Market Analysis, Insights and Forecast, 2020-2032
- 10.1. Market Analysis, Insights and Forecast - by Soft Drink Type
- 10.1.1. Energy Shots
- 10.1.2. Natural/Organic Energy Drinks
- 10.1.3. Sugar-free or Low-calories Energy Drinks
- 10.1.4. Traditional Energy Drinks
- 10.1.5. Other Energy Drinks
- 10.2. Market Analysis, Insights and Forecast - by Packaging Type
- 10.2.1. Glass Bottles
- 10.2.2. Metal Can
- 10.2.3. PET Bottles
- 10.3. Market Analysis, Insights and Forecast - by Distribution Channel
- 10.3.1. Off-trade
- 10.3.1.1. Convenience Stores
- 10.3.1.2. Online Retail
- 10.3.1.3. Supermarket/Hypermarket
- 10.3.1.4. Others
- 10.3.2. On-trade
- 10.3.1. Off-trade
- 10.1. Market Analysis, Insights and Forecast - by Soft Drink Type
- 11. Asia Pacific Energy Drinks Market Analysis, Insights and Forecast, 2020-2032
- 11.1. Market Analysis, Insights and Forecast - by Soft Drink Type
- 11.1.1. Energy Shots
- 11.1.2. Natural/Organic Energy Drinks
- 11.1.3. Sugar-free or Low-calories Energy Drinks
- 11.1.4. Traditional Energy Drinks
- 11.1.5. Other Energy Drinks
- 11.2. Market Analysis, Insights and Forecast - by Packaging Type
- 11.2.1. Glass Bottles
- 11.2.2. Metal Can
- 11.2.3. PET Bottles
- 11.3. Market Analysis, Insights and Forecast - by Distribution Channel
- 11.3.1. Off-trade
- 11.3.1.1. Convenience Stores
- 11.3.1.2. Online Retail
- 11.3.1.3. Supermarket/Hypermarket
- 11.3.1.4. Others
- 11.3.2. On-trade
- 11.3.1. Off-trade
- 11.1. Market Analysis, Insights and Forecast - by Soft Drink Type
- 12. Competitive Analysis
- 12.1. Company Profiles
- 12.1.1 Carabao Group Public Company Limited
- 12.1.1.1. Company Overview
- 12.1.1.2. Products
- 12.1.1.3. Company Financials
- 12.1.1.4. SWOT Analysis
- 12.1.2 Hell Energy Magyarország Korlátolt Felelosségu Társaság
- 12.1.2.1. Company Overview
- 12.1.2.2. Products
- 12.1.2.3. Company Financials
- 12.1.2.4. SWOT Analysis
- 12.1.3 Aje Group
- 12.1.3.1. Company Overview
- 12.1.3.2. Products
- 12.1.3.3. Company Financials
- 12.1.3.4. SWOT Analysis
- 12.1.4 Monster Beverage Corporation
- 12.1.4.1. Company Overview
- 12.1.4.2. Products
- 12.1.4.3. Company Financials
- 12.1.4.4. SWOT Analysis
- 12.1.5 PepsiCo Inc
- 12.1.5.1. Company Overview
- 12.1.5.2. Products
- 12.1.5.3. Company Financials
- 12.1.5.4. SWOT Analysis
- 12.1.6 The Coca-Cola Compan
- 12.1.6.1. Company Overview
- 12.1.6.2. Products
- 12.1.6.3. Company Financials
- 12.1.6.4. SWOT Analysis
- 12.1.7 Suntory Holdings Limited
- 12.1.7.1. Company Overview
- 12.1.7.2. Products
- 12.1.7.3. Company Financials
- 12.1.7.4. SWOT Analysis
- 12.1.8 Red Bull GmbH
- 12.1.8.1. Company Overview
- 12.1.8.2. Products
- 12.1.8.3. Company Financials
- 12.1.8.4. SWOT Analysis
- 12.1.9 Living Essentials LLC
- 12.1.9.1. Company Overview
- 12.1.9.2. Products
- 12.1.9.3. Company Financials
- 12.1.9.4. SWOT Analysis
- 12.1.10 T C Pharmaceutical Industries Company Limited
- 12.1.10.1. Company Overview
- 12.1.10.2. Products
- 12.1.10.3. Company Financials
- 12.1.10.4. SWOT Analysis
- 12.1.11 Taisho Pharmaceutical Holdings Co Ltd
- 12.1.11.1. Company Overview
- 12.1.11.2. Products
- 12.1.11.3. Company Financials
- 12.1.11.4. SWOT Analysis
- 12.1.12 Congo Brands
- 12.1.12.1. Company Overview
- 12.1.12.2. Products
- 12.1.12.3. Company Financials
- 12.1.12.4. SWOT Analysis
- 12.1.13 Osotspa Public Company Limited
- 12.1.13.1. Company Overview
- 12.1.13.2. Products
- 12.1.13.3. Company Financials
- 12.1.13.4. SWOT Analysis
- 12.1.1 Carabao Group Public Company Limited
- 12.2. Market Entropy
- 12.2.1 Company's Key Areas Served
- 12.2.2 Recent Developments
- 12.3. Company Market Share Analysis 2025
- 12.3.1 Top 5 Companies Market Share Analysis
- 12.3.2 Top 3 Companies Market Share Analysis
- 12.4. List of Potential Customers
- 13. Research Methodology
List of Figures
- Figure 1: Global Energy Drinks Market Revenue Breakdown (billion, %) by Region 2025 & 2033
- Figure 2: North America Energy Drinks Market Revenue (billion), by Soft Drink Type 2025 & 2033
- Figure 3: North America Energy Drinks Market Revenue Share (%), by Soft Drink Type 2025 & 2033
- Figure 4: North America Energy Drinks Market Revenue (billion), by Packaging Type 2025 & 2033
- Figure 5: North America Energy Drinks Market Revenue Share (%), by Packaging Type 2025 & 2033
- Figure 6: North America Energy Drinks Market Revenue (billion), by Distribution Channel 2025 & 2033
- Figure 7: North America Energy Drinks Market Revenue Share (%), by Distribution Channel 2025 & 2033
- Figure 8: North America Energy Drinks Market Revenue (billion), by Country 2025 & 2033
- Figure 9: North America Energy Drinks Market Revenue Share (%), by Country 2025 & 2033
- Figure 10: South America Energy Drinks Market Revenue (billion), by Soft Drink Type 2025 & 2033
- Figure 11: South America Energy Drinks Market Revenue Share (%), by Soft Drink Type 2025 & 2033
- Figure 12: South America Energy Drinks Market Revenue (billion), by Packaging Type 2025 & 2033
- Figure 13: South America Energy Drinks Market Revenue Share (%), by Packaging Type 2025 & 2033
- Figure 14: South America Energy Drinks Market Revenue (billion), by Distribution Channel 2025 & 2033
- Figure 15: South America Energy Drinks Market Revenue Share (%), by Distribution Channel 2025 & 2033
- Figure 16: South America Energy Drinks Market Revenue (billion), by Country 2025 & 2033
- Figure 17: South America Energy Drinks Market Revenue Share (%), by Country 2025 & 2033
- Figure 18: Europe Energy Drinks Market Revenue (billion), by Soft Drink Type 2025 & 2033
- Figure 19: Europe Energy Drinks Market Revenue Share (%), by Soft Drink Type 2025 & 2033
- Figure 20: Europe Energy Drinks Market Revenue (billion), by Packaging Type 2025 & 2033
- Figure 21: Europe Energy Drinks Market Revenue Share (%), by Packaging Type 2025 & 2033
- Figure 22: Europe Energy Drinks Market Revenue (billion), by Distribution Channel 2025 & 2033
- Figure 23: Europe Energy Drinks Market Revenue Share (%), by Distribution Channel 2025 & 2033
- Figure 24: Europe Energy Drinks Market Revenue (billion), by Country 2025 & 2033
- Figure 25: Europe Energy Drinks Market Revenue Share (%), by Country 2025 & 2033
- Figure 26: Middle East & Africa Energy Drinks Market Revenue (billion), by Soft Drink Type 2025 & 2033
- Figure 27: Middle East & Africa Energy Drinks Market Revenue Share (%), by Soft Drink Type 2025 & 2033
- Figure 28: Middle East & Africa Energy Drinks Market Revenue (billion), by Packaging Type 2025 & 2033
- Figure 29: Middle East & Africa Energy Drinks Market Revenue Share (%), by Packaging Type 2025 & 2033
- Figure 30: Middle East & Africa Energy Drinks Market Revenue (billion), by Distribution Channel 2025 & 2033
- Figure 31: Middle East & Africa Energy Drinks Market Revenue Share (%), by Distribution Channel 2025 & 2033
- Figure 32: Middle East & Africa Energy Drinks Market Revenue (billion), by Country 2025 & 2033
- Figure 33: Middle East & Africa Energy Drinks Market Revenue Share (%), by Country 2025 & 2033
- Figure 34: Asia Pacific Energy Drinks Market Revenue (billion), by Soft Drink Type 2025 & 2033
- Figure 35: Asia Pacific Energy Drinks Market Revenue Share (%), by Soft Drink Type 2025 & 2033
- Figure 36: Asia Pacific Energy Drinks Market Revenue (billion), by Packaging Type 2025 & 2033
- Figure 37: Asia Pacific Energy Drinks Market Revenue Share (%), by Packaging Type 2025 & 2033
- Figure 38: Asia Pacific Energy Drinks Market Revenue (billion), by Distribution Channel 2025 & 2033
- Figure 39: Asia Pacific Energy Drinks Market Revenue Share (%), by Distribution Channel 2025 & 2033
- Figure 40: Asia Pacific Energy Drinks Market Revenue (billion), by Country 2025 & 2033
- Figure 41: Asia Pacific Energy Drinks Market Revenue Share (%), by Country 2025 & 2033
List of Tables
- Table 1: Global Energy Drinks Market Revenue billion Forecast, by Soft Drink Type 2020 & 2033
- Table 2: Global Energy Drinks Market Revenue billion Forecast, by Packaging Type 2020 & 2033
- Table 3: Global Energy Drinks Market Revenue billion Forecast, by Distribution Channel 2020 & 2033
- Table 4: Global Energy Drinks Market Revenue billion Forecast, by Region 2020 & 2033
- Table 5: Global Energy Drinks Market Revenue billion Forecast, by Soft Drink Type 2020 & 2033
- Table 6: Global Energy Drinks Market Revenue billion Forecast, by Packaging Type 2020 & 2033
- Table 7: Global Energy Drinks Market Revenue billion Forecast, by Distribution Channel 2020 & 2033
- Table 8: Global Energy Drinks Market Revenue billion Forecast, by Country 2020 & 2033
- Table 9: United States Energy Drinks Market Revenue (billion) Forecast, by Application 2020 & 2033
- Table 10: Canada Energy Drinks Market Revenue (billion) Forecast, by Application 2020 & 2033
- Table 11: Mexico Energy Drinks Market Revenue (billion) Forecast, by Application 2020 & 2033
- Table 12: Global Energy Drinks Market Revenue billion Forecast, by Soft Drink Type 2020 & 2033
- Table 13: Global Energy Drinks Market Revenue billion Forecast, by Packaging Type 2020 & 2033
- Table 14: Global Energy Drinks Market Revenue billion Forecast, by Distribution Channel 2020 & 2033
- Table 15: Global Energy Drinks Market Revenue billion Forecast, by Country 2020 & 2033
- Table 16: Brazil Energy Drinks Market Revenue (billion) Forecast, by Application 2020 & 2033
- Table 17: Argentina Energy Drinks Market Revenue (billion) Forecast, by Application 2020 & 2033
- Table 18: Rest of South America Energy Drinks Market Revenue (billion) Forecast, by Application 2020 & 2033
- Table 19: Global Energy Drinks Market Revenue billion Forecast, by Soft Drink Type 2020 & 2033
- Table 20: Global Energy Drinks Market Revenue billion Forecast, by Packaging Type 2020 & 2033
- Table 21: Global Energy Drinks Market Revenue billion Forecast, by Distribution Channel 2020 & 2033
- Table 22: Global Energy Drinks Market Revenue billion Forecast, by Country 2020 & 2033
- Table 23: United Kingdom Energy Drinks Market Revenue (billion) Forecast, by Application 2020 & 2033
- Table 24: Germany Energy Drinks Market Revenue (billion) Forecast, by Application 2020 & 2033
- Table 25: France Energy Drinks Market Revenue (billion) Forecast, by Application 2020 & 2033
- Table 26: Italy Energy Drinks Market Revenue (billion) Forecast, by Application 2020 & 2033
- Table 27: Spain Energy Drinks Market Revenue (billion) Forecast, by Application 2020 & 2033
- Table 28: Russia Energy Drinks Market Revenue (billion) Forecast, by Application 2020 & 2033
- Table 29: Benelux Energy Drinks Market Revenue (billion) Forecast, by Application 2020 & 2033
- Table 30: Nordics Energy Drinks Market Revenue (billion) Forecast, by Application 2020 & 2033
- Table 31: Rest of Europe Energy Drinks Market Revenue (billion) Forecast, by Application 2020 & 2033
- Table 32: Global Energy Drinks Market Revenue billion Forecast, by Soft Drink Type 2020 & 2033
- Table 33: Global Energy Drinks Market Revenue billion Forecast, by Packaging Type 2020 & 2033
- Table 34: Global Energy Drinks Market Revenue billion Forecast, by Distribution Channel 2020 & 2033
- Table 35: Global Energy Drinks Market Revenue billion Forecast, by Country 2020 & 2033
- Table 36: Turkey Energy Drinks Market Revenue (billion) Forecast, by Application 2020 & 2033
- Table 37: Israel Energy Drinks Market Revenue (billion) Forecast, by Application 2020 & 2033
- Table 38: GCC Energy Drinks Market Revenue (billion) Forecast, by Application 2020 & 2033
- Table 39: North Africa Energy Drinks Market Revenue (billion) Forecast, by Application 2020 & 2033
- Table 40: South Africa Energy Drinks Market Revenue (billion) Forecast, by Application 2020 & 2033
- Table 41: Rest of Middle East & Africa Energy Drinks Market Revenue (billion) Forecast, by Application 2020 & 2033
- Table 42: Global Energy Drinks Market Revenue billion Forecast, by Soft Drink Type 2020 & 2033
- Table 43: Global Energy Drinks Market Revenue billion Forecast, by Packaging Type 2020 & 2033
- Table 44: Global Energy Drinks Market Revenue billion Forecast, by Distribution Channel 2020 & 2033
- Table 45: Global Energy Drinks Market Revenue billion Forecast, by Country 2020 & 2033
- Table 46: China Energy Drinks Market Revenue (billion) Forecast, by Application 2020 & 2033
- Table 47: India Energy Drinks Market Revenue (billion) Forecast, by Application 2020 & 2033
- Table 48: Japan Energy Drinks Market Revenue (billion) Forecast, by Application 2020 & 2033
- Table 49: South Korea Energy Drinks Market Revenue (billion) Forecast, by Application 2020 & 2033
- Table 50: ASEAN Energy Drinks Market Revenue (billion) Forecast, by Application 2020 & 2033
- Table 51: Oceania Energy Drinks Market Revenue (billion) Forecast, by Application 2020 & 2033
- Table 52: Rest of Asia Pacific Energy Drinks Market Revenue (billion) Forecast, by Application 2020 & 2033
Frequently Asked Questions
1. What is the projected Compound Annual Growth Rate (CAGR) of the Energy Drinks Market?
The projected CAGR is approximately 9.7%.
2. Which companies are prominent players in the Energy Drinks Market?
Key companies in the market include Carabao Group Public Company Limited, Hell Energy Magyarország Korlátolt Felelosségu Társaság, Aje Group, Monster Beverage Corporation, PepsiCo Inc, The Coca-Cola Compan, Suntory Holdings Limited, Red Bull GmbH, Living Essentials LLC, T C Pharmaceutical Industries Company Limited, Taisho Pharmaceutical Holdings Co Ltd, Congo Brands, Osotspa Public Company Limited.
3. What are the main segments of the Energy Drinks Market?
The market segments include Soft Drink Type, Packaging Type, Distribution Channel.
4. Can you provide details about the market size?
The market size is estimated to be USD 23.9 billion as of 2022.
5. What are some drivers contributing to market growth?
Increasing Demand for Supplement Nutrition; Growing Casein Application in Processed Food Products.
6. What are the notable trends driving market growth?
OTHER KEY INDUSTRY TRENDS COVERED IN THE REPORT.
7. Are there any restraints impacting market growth?
Competition from Vegan/Plant-based Protein Powders.
8. Can you provide examples of recent developments in the market?
October 2023: Quality Pack International, a member of Hell Group and the Azerbijan company signed an agreement to establish a joint venture company the Quality Pack Capian LLC. QPC’s objective is to implement a vertically integrated aluminum beverage can manufacturing and non-alcoholic beverage filling factory in the Alat Free Economic Zone of Azerbaijan, which can serve as a regional production hub for local and regional beverage brands, either selling empty cans alone or also filling them.September 2023: PepsiCo India launched a limited edition flavor of its Sting Energy drink, called Sting Blue Current. Sting Blue Current is available at 200 ml in single-serve packs across India.September 2023: Red Bull unveiled its first limited Winter Edition in the United Kingdom. Red Bull Winter Edition Spiced Pear offers a blend of pear accented with a dash of cinnamon.
9. What pricing options are available for accessing the report?
Pricing options include single-user, multi-user, and enterprise licenses priced at USD 3800, USD 4500, and USD 5800 respectively.
10. Is the market size provided in terms of value or volume?
The market size is provided in terms of value, measured in billion.
11. Are there any specific market keywords associated with the report?
Yes, the market keyword associated with the report is "Energy Drinks Market," which aids in identifying and referencing the specific market segment covered.
12. How do I determine which pricing option suits my needs best?
The pricing options vary based on user requirements and access needs. Individual users may opt for single-user licenses, while businesses requiring broader access may choose multi-user or enterprise licenses for cost-effective access to the report.
13. Are there any additional resources or data provided in the Energy Drinks Market report?
While the report offers comprehensive insights, it's advisable to review the specific contents or supplementary materials provided to ascertain if additional resources or data are available.
14. How can I stay updated on further developments or reports in the Energy Drinks Market?
To stay informed about further developments, trends, and reports in the Energy Drinks Market, consider subscribing to industry newsletters, following relevant companies and organizations, or regularly checking reputable industry news sources and publications.
Methodology
Step 1 - Identification of Relevant Samples Size from Population Database


Step 2 - Approaches for Defining Global Market Size (Value, Volume* & Price*)

Note*: In applicable scenarios
Step 3 - Data Sources
Primary Research
- Web Analytics
- Survey Reports
- Research Institute
- Latest Research Reports
- Opinion Leaders
Secondary Research
- Annual Reports
- White Paper
- Latest Press Release
- Industry Association
- Paid Database
- Investor Presentations

Step 4 - Data Triangulation
Involves using different sources of information in order to increase the validity of a study
These sources are likely to be stakeholders in a program - participants, other researchers, program staff, other community members, and so on.
Then we put all data in single framework & apply various statistical tools to find out the dynamic on the market.
During the analysis stage, feedback from the stakeholder groups would be compared to determine areas of agreement as well as areas of divergence