

Key Insights
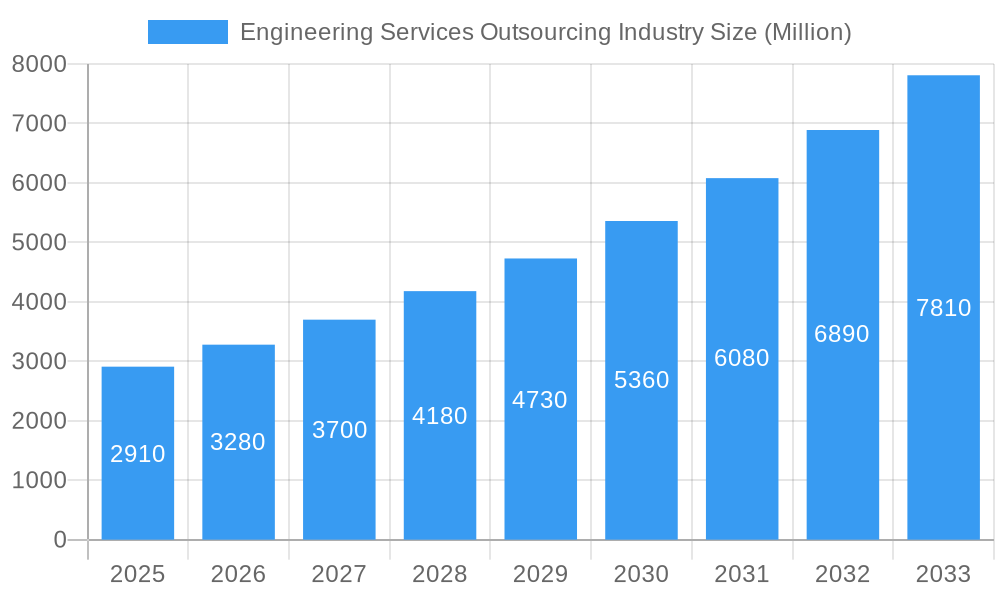
The Engineering Services Outsourcing (ESO) industry is experiencing robust growth, projected to reach a market size of $2.91 billion in 2025, with a compound annual growth rate (CAGR) of 12.89% from 2019 to 2033. This expansion is driven by several key factors. Firstly, the increasing complexity of engineering projects and the rising demand for specialized skills are pushing companies to outsource non-core engineering functions. This allows companies to focus on their core competencies, reduce operational costs, and access a global talent pool. Secondly, advancements in digital technologies, including AI, machine learning, and cloud computing, are transforming engineering processes, leading to greater efficiency and productivity gains within the ESO sector. This technological integration is driving further demand for specialized engineering expertise that many companies lack in-house. Finally, the global nature of the industry allows for optimized resource allocation and cost efficiencies, further fueling its growth.
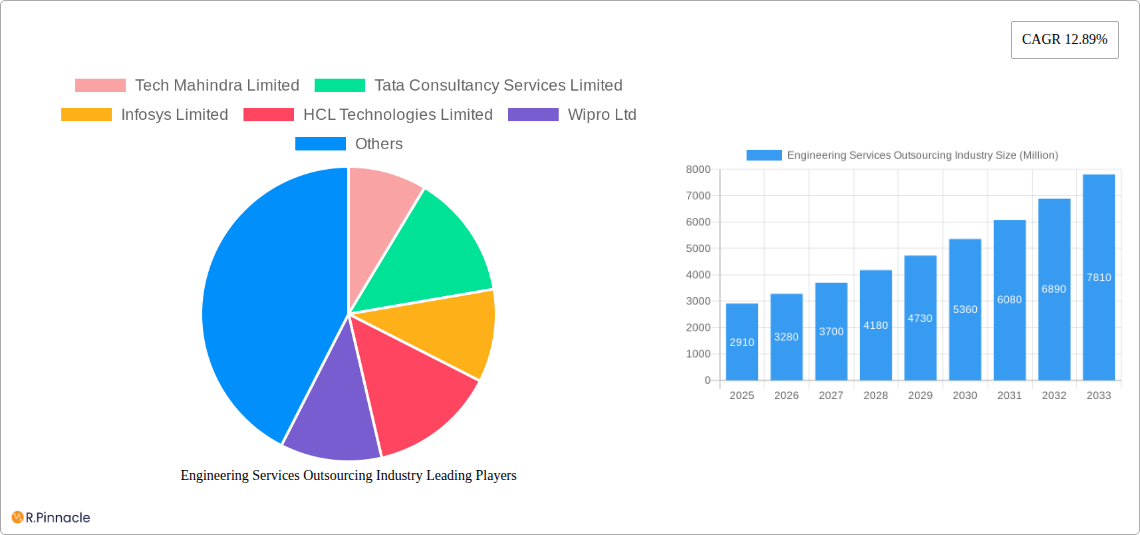
Engineering Services Outsourcing Industry Market Size (In Billion)
Major players like Tech Mahindra, Tata Consultancy Services, Infosys, HCL Technologies, Wipro, Capgemini, Accenture, and others are significantly contributing to this market expansion. These companies leverage their extensive experience, global reach, and technological capabilities to deliver a wide range of engineering services, including product design and development, testing, and manufacturing support. The industry is segmented by service type (e.g., mechanical, electrical, software), industry vertical (e.g., automotive, aerospace, manufacturing), and geography. While specific regional breakdowns are not provided, we can anticipate that North America, Europe, and Asia-Pacific will continue to be major market contributors, reflecting the high concentration of engineering-intensive industries in these regions. The competitive landscape remains dynamic, with established players continually innovating and new entrants emerging to cater to the growing demand for specialized services. Future growth will likely be influenced by factors such as global economic conditions, technological advancements, and regulatory changes.
Engineering Services Outsourcing Industry Company Market Share
Engineering Services Outsourcing Industry Report: 2019-2033
This comprehensive report provides an in-depth analysis of the Engineering Services Outsourcing (ESO) industry, offering invaluable insights for industry professionals, investors, and strategic decision-makers. Covering the period 2019-2033, with a base year of 2025 and a forecast period of 2025-2033, this report meticulously examines market dynamics, technological advancements, key players, and future growth prospects. The global ESO market is projected to reach xx Million by 2033, exhibiting a Compound Annual Growth Rate (CAGR) of xx%.
Engineering Services Outsourcing Industry Market Structure & Innovation Trends
The Engineering Services Outsourcing market exhibits a moderately concentrated structure, with several large multinational corporations holding significant market share. Key players like Tata Consultancy Services Limited, Infosys Limited, and Tech Mahindra Limited dominate the landscape, collectively accounting for an estimated xx% of the global market in 2024. However, several mid-sized and smaller specialized firms also contribute significantly to the overall market value, particularly in niche segments.
- Market Concentration: High, with top 5 players controlling xx% of market share in 2024.
- Innovation Drivers: Increased demand for digital transformation, automation, and Industry 4.0 technologies.
- Regulatory Frameworks: Varying regulations across different geographies impact operational costs and compliance requirements.
- Product Substitutes: Limited direct substitutes, but internal engineering departments pose a competitive challenge.
- End-User Demographics: Predominantly large enterprises and multinational corporations across diverse industries.
- M&A Activities: Significant M&A activity in recent years, with deal values exceeding xx Million in 2024, driven by consolidation and expansion into new markets and technologies. Many deals focused on acquiring specialized skills and technologies.
Engineering Services Outsourcing Industry Market Dynamics & Trends
The ESO market is experiencing robust growth, fueled by several key factors. The rising adoption of digital technologies across various industries is a primary driver, creating significant demand for outsourcing engineering services to reduce costs and accelerate innovation. Furthermore, the increasing complexity of engineering projects and a global shortage of skilled engineers are contributing to the market's expansion. Technological disruptions, such as the rise of AI and machine learning, are reshaping the ESO landscape, enabling greater automation and improved efficiency. Consumer preference for faster product development cycles and enhanced product quality further fuels the demand for specialized ESO services. Competitive dynamics are characterized by intense rivalry among leading players, focusing on pricing, service offerings, and geographical expansion. The market penetration rate for ESO services is projected to reach xx% by 2033. Market growth is expected to remain robust, with a projected CAGR of xx% during the forecast period.
Dominant Regions & Segments in Engineering Services Outsourcing Industry
The Asia-Pacific region holds a dominant position in the global ESO market, driven by several factors:
- Key Drivers:
- Large and growing pool of skilled engineering talent.
- Favorable government policies and infrastructure development.
- Cost-effective labor and operational expenses.
- Increasing domestic demand from rapidly developing economies.
- Dominance Analysis: The region's dominance is attributed to its robust engineering talent pool and cost advantages. India, in particular, has emerged as a major hub for ESO services, attracting significant investments and establishing itself as a global leader. North America and Europe also represent significant markets, characterized by high technological sophistication and substantial demand for specialized engineering expertise.
Engineering Services Outsourcing Industry Product Innovations
Recent product innovations in the ESO sector include the development of advanced simulation and modeling tools, the integration of AI and machine learning into engineering processes, and the rise of cloud-based engineering platforms. These innovations enhance efficiency, accuracy, and collaboration, leading to faster product development cycles and improved product quality. The increasing adoption of these technologies gives companies a competitive edge, enabling them to provide higher-value services and capture a greater market share.
Report Scope & Segmentation Analysis
This report segments the ESO market by service type (e.g., product design and development, manufacturing engineering, testing and validation), industry vertical (e.g., automotive, aerospace, healthcare), and geography. Each segment exhibits unique growth characteristics and competitive dynamics. For example, the automotive segment is experiencing rapid growth due to the increasing adoption of electric vehicles and autonomous driving technologies, while the healthcare segment is witnessing growth driven by the need for medical device development and regulatory compliance. Market size estimations for each segment are provided for the historical period (2019-2024), base year (2025), and forecast period (2025-2033), along with growth projections and competitive landscape analyses.
Key Drivers of Engineering Services Outsourcing Industry Growth
Several factors drive the growth of the ESO industry. These include:
- Technological advancements: Automation, AI, and cloud computing are transforming engineering processes, boosting efficiency and productivity.
- Economic factors: Cost reduction through outsourcing remains a key driver for companies across various sectors.
- Regulatory changes: Government initiatives promoting digitalization and innovation in various industries create demand for ESO services.
Challenges in the Engineering Services Outsourcing Industry Sector
The ESO industry faces several challenges, including:
- Data security and intellectual property concerns.
- Maintaining consistent quality and communication across different geographical locations.
- Managing complex regulatory environments. These issues impact profitability and efficiency, resulting in potentially xx Million in lost revenue annually.
Emerging Opportunities in Engineering Services Outsourcing Industry
The ESO sector presents numerous opportunities:
- Expansion into new emerging markets.
- Development of specialized services targeting niche industries.
- Leveraging emerging technologies like blockchain and IoT to enhance service offerings.
Leading Players in the Engineering Services Outsourcing Industry Market
- Tech Mahindra Limited
- Tata Consultancy Services Limited
- Infosys Limited
- HCL Technologies Limited
- Wipro Ltd
- Capgemini Technology Services India Limited
- Globallogic Inc
- Accenture
- RLE International Inc
- ASAP Holding GmbH
- Tata Technologies
Key Developments in Engineering Services Outsourcing Industry
- April 2023: Marks and Spencer PLC extends its relationship with Tata Consultancy Services (TCS) for a major technology modernization program, aiming to improve customer experience, drive online growth, and enhance supply chain efficiency. This signifies a substantial investment in digital transformation within the retail sector and highlights the increasing role of ESO in driving business growth.
- February 2023: Tech Mahindra partners with Saudi Arabia's Ministry of Communication and Information Technology to establish a Data & AI and Cloud Centre of Excellence, indicating the growing importance of data-driven technologies and the expanding ESO market in the Middle East.
Future Outlook for Engineering Services Outsourcing Industry Market
The ESO market is poised for continued growth, driven by ongoing digital transformation initiatives and increasing demand for specialized engineering expertise across various industries. The adoption of advanced technologies such as AI and machine learning will further enhance efficiency and innovation, while the expansion into new markets presents significant opportunities for growth and expansion. Strategic partnerships and M&A activities will continue to shape the competitive landscape, leading to increased consolidation and specialization within the industry. The future growth potential of the ESO industry is significant, promising substantial returns for investors and creating numerous opportunities for innovation and development.
Engineering Services Outsourcing Industry Segmentation
-
1. Services
- 1.1. Designing
- 1.2. Prototyping
- 1.3. System Integration
- 1.4. Testing
- 1.5. Others
-
2. End User
- 2.1. Automotive
- 2.2. Industrial
- 2.3. Consumer Electronics And Semiconductors
- 2.4. Telecom
- 2.5. Others
Engineering Services Outsourcing Industry Segmentation By Geography
-
1. North America
- 1.1. United States
- 1.2. Canada
- 1.3. Mexico
-
2. Europe
- 2.1. United Kingdom
- 2.2. Germany
- 2.3. France
- 2.4. Italy
- 2.5. Spain
- 2.6. Rest of Europe
-
3. Asia Pacific
- 3.1. China
- 3.2. India
- 3.3. Japan
- 3.4. South Korea
- 3.5. Thailand
- 3.6. Indonesia
- 3.7. Rest of Asia pacific
- 4. Rest of the World

Engineering Services Outsourcing Industry Regional Market Share
Geographic Coverage of Engineering Services Outsourcing Industry
Engineering Services Outsourcing Industry REPORT HIGHLIGHTS
| Aspects | Details |
|---|---|
| Study Period | 2020-2034 |
| Base Year | 2025 |
| Estimated Year | 2026 |
| Forecast Period | 2026-2034 |
| Historical Period | 2020-2025 |
| Growth Rate | CAGR of 12.89% from 2020-2034 |
| Segmentation |
|
Table of Contents
- 1. Introduction
- 1.1. Research Scope
- 1.2. Market Segmentation
- 1.3. Research Objective
- 1.4. Definitions and Assumptions
- 2. Executive Summary
- 2.1. Market Snapshot
- 3. Market Dynamics
- 3.1. Market Drivers
- 3.2. Market Restrains
- 3.3. Market Trends
- 3.4. Market Opportunities
- 4. Market Factor Analysis
- 4.1. Porters Five Forces
- 4.1.1. Bargaining Power of Suppliers
- 4.1.2. Bargaining Power of Buyers
- 4.1.3. Threat of New Entrants
- 4.1.4. Threat of Substitutes
- 4.1.5. Competitive Rivalry
- 4.2. PESTEL analysis
- 4.3. BCG Analysis
- 4.3.1. Stars (High Growth, High Market Share)
- 4.3.2. Cash Cows (Low Growth, High Market Share)
- 4.3.3. Question Mark (High Growth, Low Market Share)
- 4.3.4. Dogs (Low Growth, Low Market Share)
- 4.4. Ansoff Matrix Analysis
- 4.5. Supply Chain Analysis
- 4.6. Regulatory Landscape
- 4.7. Current Market Potential and Opportunity Assessment (TAM–SAM–SOM Framework)
- 4.8. PRI Analyst Note
- 4.1. Porters Five Forces
- 5. Market Analysis, Insights and Forecast 2021-2033
- 5.1. Market Analysis, Insights and Forecast - by Services
- 5.1.1. Designing
- 5.1.2. Prototyping
- 5.1.3. System Integration
- 5.1.4. Testing
- 5.1.5. Others
- 5.2. Market Analysis, Insights and Forecast - by End User
- 5.2.1. Automotive
- 5.2.2. Industrial
- 5.2.3. Consumer Electronics And Semiconductors
- 5.2.4. Telecom
- 5.2.5. Others
- 5.3. Market Analysis, Insights and Forecast - by Region
- 5.3.1. North America
- 5.3.2. Europe
- 5.3.3. Asia Pacific
- 5.3.4. Rest of the World
- 5.1. Market Analysis, Insights and Forecast - by Services
- 6. Global Engineering Services Outsourcing Industry Analysis, Insights and Forecast, 2021-2033
- 6.1. Market Analysis, Insights and Forecast - by Services
- 6.1.1. Designing
- 6.1.2. Prototyping
- 6.1.3. System Integration
- 6.1.4. Testing
- 6.1.5. Others
- 6.2. Market Analysis, Insights and Forecast - by End User
- 6.2.1. Automotive
- 6.2.2. Industrial
- 6.2.3. Consumer Electronics And Semiconductors
- 6.2.4. Telecom
- 6.2.5. Others
- 6.1. Market Analysis, Insights and Forecast - by Services
- 7. North America Engineering Services Outsourcing Industry Analysis, Insights and Forecast, 2020-2032
- 7.1. Market Analysis, Insights and Forecast - by Services
- 7.1.1. Designing
- 7.1.2. Prototyping
- 7.1.3. System Integration
- 7.1.4. Testing
- 7.1.5. Others
- 7.2. Market Analysis, Insights and Forecast - by End User
- 7.2.1. Automotive
- 7.2.2. Industrial
- 7.2.3. Consumer Electronics And Semiconductors
- 7.2.4. Telecom
- 7.2.5. Others
- 7.1. Market Analysis, Insights and Forecast - by Services
- 8. Europe Engineering Services Outsourcing Industry Analysis, Insights and Forecast, 2020-2032
- 8.1. Market Analysis, Insights and Forecast - by Services
- 8.1.1. Designing
- 8.1.2. Prototyping
- 8.1.3. System Integration
- 8.1.4. Testing
- 8.1.5. Others
- 8.2. Market Analysis, Insights and Forecast - by End User
- 8.2.1. Automotive
- 8.2.2. Industrial
- 8.2.3. Consumer Electronics And Semiconductors
- 8.2.4. Telecom
- 8.2.5. Others
- 8.1. Market Analysis, Insights and Forecast - by Services
- 9. Asia Pacific Engineering Services Outsourcing Industry Analysis, Insights and Forecast, 2020-2032
- 9.1. Market Analysis, Insights and Forecast - by Services
- 9.1.1. Designing
- 9.1.2. Prototyping
- 9.1.3. System Integration
- 9.1.4. Testing
- 9.1.5. Others
- 9.2. Market Analysis, Insights and Forecast - by End User
- 9.2.1. Automotive
- 9.2.2. Industrial
- 9.2.3. Consumer Electronics And Semiconductors
- 9.2.4. Telecom
- 9.2.5. Others
- 9.1. Market Analysis, Insights and Forecast - by Services
- 10. Rest of the World Engineering Services Outsourcing Industry Analysis, Insights and Forecast, 2020-2032
- 10.1. Market Analysis, Insights and Forecast - by Services
- 10.1.1. Designing
- 10.1.2. Prototyping
- 10.1.3. System Integration
- 10.1.4. Testing
- 10.1.5. Others
- 10.2. Market Analysis, Insights and Forecast - by End User
- 10.2.1. Automotive
- 10.2.2. Industrial
- 10.2.3. Consumer Electronics And Semiconductors
- 10.2.4. Telecom
- 10.2.5. Others
- 10.1. Market Analysis, Insights and Forecast - by Services
- 11. Competitive Analysis
- 11.1. Company Profiles
- 11.1.1 Tech Mahindra Limited
- 11.1.1.1. Company Overview
- 11.1.1.2. Products
- 11.1.1.3. Company Financials
- 11.1.1.4. SWOT Analysis
- 11.1.2 Tata Consultancy Services Limited
- 11.1.2.1. Company Overview
- 11.1.2.2. Products
- 11.1.2.3. Company Financials
- 11.1.2.4. SWOT Analysis
- 11.1.3 Infosys Limited
- 11.1.3.1. Company Overview
- 11.1.3.2. Products
- 11.1.3.3. Company Financials
- 11.1.3.4. SWOT Analysis
- 11.1.4 HCL Technologies Limited
- 11.1.4.1. Company Overview
- 11.1.4.2. Products
- 11.1.4.3. Company Financials
- 11.1.4.4. SWOT Analysis
- 11.1.5 Wipro Ltd
- 11.1.5.1. Company Overview
- 11.1.5.2. Products
- 11.1.5.3. Company Financials
- 11.1.5.4. SWOT Analysis
- 11.1.6 Capgemini Technology Services India Limited
- 11.1.6.1. Company Overview
- 11.1.6.2. Products
- 11.1.6.3. Company Financials
- 11.1.6.4. SWOT Analysis
- 11.1.7 Globallogic Inc
- 11.1.7.1. Company Overview
- 11.1.7.2. Products
- 11.1.7.3. Company Financials
- 11.1.7.4. SWOT Analysis
- 11.1.8 Accenture
- 11.1.8.1. Company Overview
- 11.1.8.2. Products
- 11.1.8.3. Company Financials
- 11.1.8.4. SWOT Analysis
- 11.1.9 RLE International Inc
- 11.1.9.1. Company Overview
- 11.1.9.2. Products
- 11.1.9.3. Company Financials
- 11.1.9.4. SWOT Analysis
- 11.1.10 ASAP Holding GmbH
- 11.1.10.1. Company Overview
- 11.1.10.2. Products
- 11.1.10.3. Company Financials
- 11.1.10.4. SWOT Analysis
- 11.1.11 Tata Technologies**List Not Exhaustive
- 11.1.11.1. Company Overview
- 11.1.11.2. Products
- 11.1.11.3. Company Financials
- 11.1.11.4. SWOT Analysis
- 11.1.1 Tech Mahindra Limited
- 11.2. Market Entropy
- 11.2.1 Company's Key Areas Served
- 11.2.2 Recent Developments
- 11.3. Company Market Share Analysis 2025
- 11.3.1 Top 5 Companies Market Share Analysis
- 11.3.2 Top 3 Companies Market Share Analysis
- 11.4. List of Potential Customers
- 12. Research Methodology
List of Figures
- Figure 1: Global Engineering Services Outsourcing Industry Revenue Breakdown (Million, %) by Region 2025 & 2033
- Figure 2: Global Engineering Services Outsourcing Industry Volume Breakdown (Trillion, %) by Region 2025 & 2033
- Figure 3: North America Engineering Services Outsourcing Industry Revenue (Million), by Services 2025 & 2033
- Figure 4: North America Engineering Services Outsourcing Industry Volume (Trillion), by Services 2025 & 2033
- Figure 5: North America Engineering Services Outsourcing Industry Revenue Share (%), by Services 2025 & 2033
- Figure 6: North America Engineering Services Outsourcing Industry Volume Share (%), by Services 2025 & 2033
- Figure 7: North America Engineering Services Outsourcing Industry Revenue (Million), by End User 2025 & 2033
- Figure 8: North America Engineering Services Outsourcing Industry Volume (Trillion), by End User 2025 & 2033
- Figure 9: North America Engineering Services Outsourcing Industry Revenue Share (%), by End User 2025 & 2033
- Figure 10: North America Engineering Services Outsourcing Industry Volume Share (%), by End User 2025 & 2033
- Figure 11: North America Engineering Services Outsourcing Industry Revenue (Million), by Country 2025 & 2033
- Figure 12: North America Engineering Services Outsourcing Industry Volume (Trillion), by Country 2025 & 2033
- Figure 13: North America Engineering Services Outsourcing Industry Revenue Share (%), by Country 2025 & 2033
- Figure 14: North America Engineering Services Outsourcing Industry Volume Share (%), by Country 2025 & 2033
- Figure 15: Europe Engineering Services Outsourcing Industry Revenue (Million), by Services 2025 & 2033
- Figure 16: Europe Engineering Services Outsourcing Industry Volume (Trillion), by Services 2025 & 2033
- Figure 17: Europe Engineering Services Outsourcing Industry Revenue Share (%), by Services 2025 & 2033
- Figure 18: Europe Engineering Services Outsourcing Industry Volume Share (%), by Services 2025 & 2033
- Figure 19: Europe Engineering Services Outsourcing Industry Revenue (Million), by End User 2025 & 2033
- Figure 20: Europe Engineering Services Outsourcing Industry Volume (Trillion), by End User 2025 & 2033
- Figure 21: Europe Engineering Services Outsourcing Industry Revenue Share (%), by End User 2025 & 2033
- Figure 22: Europe Engineering Services Outsourcing Industry Volume Share (%), by End User 2025 & 2033
- Figure 23: Europe Engineering Services Outsourcing Industry Revenue (Million), by Country 2025 & 2033
- Figure 24: Europe Engineering Services Outsourcing Industry Volume (Trillion), by Country 2025 & 2033
- Figure 25: Europe Engineering Services Outsourcing Industry Revenue Share (%), by Country 2025 & 2033
- Figure 26: Europe Engineering Services Outsourcing Industry Volume Share (%), by Country 2025 & 2033
- Figure 27: Asia Pacific Engineering Services Outsourcing Industry Revenue (Million), by Services 2025 & 2033
- Figure 28: Asia Pacific Engineering Services Outsourcing Industry Volume (Trillion), by Services 2025 & 2033
- Figure 29: Asia Pacific Engineering Services Outsourcing Industry Revenue Share (%), by Services 2025 & 2033
- Figure 30: Asia Pacific Engineering Services Outsourcing Industry Volume Share (%), by Services 2025 & 2033
- Figure 31: Asia Pacific Engineering Services Outsourcing Industry Revenue (Million), by End User 2025 & 2033
- Figure 32: Asia Pacific Engineering Services Outsourcing Industry Volume (Trillion), by End User 2025 & 2033
- Figure 33: Asia Pacific Engineering Services Outsourcing Industry Revenue Share (%), by End User 2025 & 2033
- Figure 34: Asia Pacific Engineering Services Outsourcing Industry Volume Share (%), by End User 2025 & 2033
- Figure 35: Asia Pacific Engineering Services Outsourcing Industry Revenue (Million), by Country 2025 & 2033
- Figure 36: Asia Pacific Engineering Services Outsourcing Industry Volume (Trillion), by Country 2025 & 2033
- Figure 37: Asia Pacific Engineering Services Outsourcing Industry Revenue Share (%), by Country 2025 & 2033
- Figure 38: Asia Pacific Engineering Services Outsourcing Industry Volume Share (%), by Country 2025 & 2033
- Figure 39: Rest of the World Engineering Services Outsourcing Industry Revenue (Million), by Services 2025 & 2033
- Figure 40: Rest of the World Engineering Services Outsourcing Industry Volume (Trillion), by Services 2025 & 2033
- Figure 41: Rest of the World Engineering Services Outsourcing Industry Revenue Share (%), by Services 2025 & 2033
- Figure 42: Rest of the World Engineering Services Outsourcing Industry Volume Share (%), by Services 2025 & 2033
- Figure 43: Rest of the World Engineering Services Outsourcing Industry Revenue (Million), by End User 2025 & 2033
- Figure 44: Rest of the World Engineering Services Outsourcing Industry Volume (Trillion), by End User 2025 & 2033
- Figure 45: Rest of the World Engineering Services Outsourcing Industry Revenue Share (%), by End User 2025 & 2033
- Figure 46: Rest of the World Engineering Services Outsourcing Industry Volume Share (%), by End User 2025 & 2033
- Figure 47: Rest of the World Engineering Services Outsourcing Industry Revenue (Million), by Country 2025 & 2033
- Figure 48: Rest of the World Engineering Services Outsourcing Industry Volume (Trillion), by Country 2025 & 2033
- Figure 49: Rest of the World Engineering Services Outsourcing Industry Revenue Share (%), by Country 2025 & 2033
- Figure 50: Rest of the World Engineering Services Outsourcing Industry Volume Share (%), by Country 2025 & 2033
List of Tables
- Table 1: Global Engineering Services Outsourcing Industry Revenue Million Forecast, by Services 2020 & 2033
- Table 2: Global Engineering Services Outsourcing Industry Volume Trillion Forecast, by Services 2020 & 2033
- Table 3: Global Engineering Services Outsourcing Industry Revenue Million Forecast, by End User 2020 & 2033
- Table 4: Global Engineering Services Outsourcing Industry Volume Trillion Forecast, by End User 2020 & 2033
- Table 5: Global Engineering Services Outsourcing Industry Revenue Million Forecast, by Region 2020 & 2033
- Table 6: Global Engineering Services Outsourcing Industry Volume Trillion Forecast, by Region 2020 & 2033
- Table 7: Global Engineering Services Outsourcing Industry Revenue Million Forecast, by Services 2020 & 2033
- Table 8: Global Engineering Services Outsourcing Industry Volume Trillion Forecast, by Services 2020 & 2033
- Table 9: Global Engineering Services Outsourcing Industry Revenue Million Forecast, by End User 2020 & 2033
- Table 10: Global Engineering Services Outsourcing Industry Volume Trillion Forecast, by End User 2020 & 2033
- Table 11: Global Engineering Services Outsourcing Industry Revenue Million Forecast, by Country 2020 & 2033
- Table 12: Global Engineering Services Outsourcing Industry Volume Trillion Forecast, by Country 2020 & 2033
- Table 13: United States Engineering Services Outsourcing Industry Revenue (Million) Forecast, by Application 2020 & 2033
- Table 14: United States Engineering Services Outsourcing Industry Volume (Trillion) Forecast, by Application 2020 & 2033
- Table 15: Canada Engineering Services Outsourcing Industry Revenue (Million) Forecast, by Application 2020 & 2033
- Table 16: Canada Engineering Services Outsourcing Industry Volume (Trillion) Forecast, by Application 2020 & 2033
- Table 17: Mexico Engineering Services Outsourcing Industry Revenue (Million) Forecast, by Application 2020 & 2033
- Table 18: Mexico Engineering Services Outsourcing Industry Volume (Trillion) Forecast, by Application 2020 & 2033
- Table 19: Global Engineering Services Outsourcing Industry Revenue Million Forecast, by Services 2020 & 2033
- Table 20: Global Engineering Services Outsourcing Industry Volume Trillion Forecast, by Services 2020 & 2033
- Table 21: Global Engineering Services Outsourcing Industry Revenue Million Forecast, by End User 2020 & 2033
- Table 22: Global Engineering Services Outsourcing Industry Volume Trillion Forecast, by End User 2020 & 2033
- Table 23: Global Engineering Services Outsourcing Industry Revenue Million Forecast, by Country 2020 & 2033
- Table 24: Global Engineering Services Outsourcing Industry Volume Trillion Forecast, by Country 2020 & 2033
- Table 25: United Kingdom Engineering Services Outsourcing Industry Revenue (Million) Forecast, by Application 2020 & 2033
- Table 26: United Kingdom Engineering Services Outsourcing Industry Volume (Trillion) Forecast, by Application 2020 & 2033
- Table 27: Germany Engineering Services Outsourcing Industry Revenue (Million) Forecast, by Application 2020 & 2033
- Table 28: Germany Engineering Services Outsourcing Industry Volume (Trillion) Forecast, by Application 2020 & 2033
- Table 29: France Engineering Services Outsourcing Industry Revenue (Million) Forecast, by Application 2020 & 2033
- Table 30: France Engineering Services Outsourcing Industry Volume (Trillion) Forecast, by Application 2020 & 2033
- Table 31: Italy Engineering Services Outsourcing Industry Revenue (Million) Forecast, by Application 2020 & 2033
- Table 32: Italy Engineering Services Outsourcing Industry Volume (Trillion) Forecast, by Application 2020 & 2033
- Table 33: Spain Engineering Services Outsourcing Industry Revenue (Million) Forecast, by Application 2020 & 2033
- Table 34: Spain Engineering Services Outsourcing Industry Volume (Trillion) Forecast, by Application 2020 & 2033
- Table 35: Rest of Europe Engineering Services Outsourcing Industry Revenue (Million) Forecast, by Application 2020 & 2033
- Table 36: Rest of Europe Engineering Services Outsourcing Industry Volume (Trillion) Forecast, by Application 2020 & 2033
- Table 37: Global Engineering Services Outsourcing Industry Revenue Million Forecast, by Services 2020 & 2033
- Table 38: Global Engineering Services Outsourcing Industry Volume Trillion Forecast, by Services 2020 & 2033
- Table 39: Global Engineering Services Outsourcing Industry Revenue Million Forecast, by End User 2020 & 2033
- Table 40: Global Engineering Services Outsourcing Industry Volume Trillion Forecast, by End User 2020 & 2033
- Table 41: Global Engineering Services Outsourcing Industry Revenue Million Forecast, by Country 2020 & 2033
- Table 42: Global Engineering Services Outsourcing Industry Volume Trillion Forecast, by Country 2020 & 2033
- Table 43: China Engineering Services Outsourcing Industry Revenue (Million) Forecast, by Application 2020 & 2033
- Table 44: China Engineering Services Outsourcing Industry Volume (Trillion) Forecast, by Application 2020 & 2033
- Table 45: India Engineering Services Outsourcing Industry Revenue (Million) Forecast, by Application 2020 & 2033
- Table 46: India Engineering Services Outsourcing Industry Volume (Trillion) Forecast, by Application 2020 & 2033
- Table 47: Japan Engineering Services Outsourcing Industry Revenue (Million) Forecast, by Application 2020 & 2033
- Table 48: Japan Engineering Services Outsourcing Industry Volume (Trillion) Forecast, by Application 2020 & 2033
- Table 49: South Korea Engineering Services Outsourcing Industry Revenue (Million) Forecast, by Application 2020 & 2033
- Table 50: South Korea Engineering Services Outsourcing Industry Volume (Trillion) Forecast, by Application 2020 & 2033
- Table 51: Thailand Engineering Services Outsourcing Industry Revenue (Million) Forecast, by Application 2020 & 2033
- Table 52: Thailand Engineering Services Outsourcing Industry Volume (Trillion) Forecast, by Application 2020 & 2033
- Table 53: Indonesia Engineering Services Outsourcing Industry Revenue (Million) Forecast, by Application 2020 & 2033
- Table 54: Indonesia Engineering Services Outsourcing Industry Volume (Trillion) Forecast, by Application 2020 & 2033
- Table 55: Rest of Asia pacific Engineering Services Outsourcing Industry Revenue (Million) Forecast, by Application 2020 & 2033
- Table 56: Rest of Asia pacific Engineering Services Outsourcing Industry Volume (Trillion) Forecast, by Application 2020 & 2033
- Table 57: Global Engineering Services Outsourcing Industry Revenue Million Forecast, by Services 2020 & 2033
- Table 58: Global Engineering Services Outsourcing Industry Volume Trillion Forecast, by Services 2020 & 2033
- Table 59: Global Engineering Services Outsourcing Industry Revenue Million Forecast, by End User 2020 & 2033
- Table 60: Global Engineering Services Outsourcing Industry Volume Trillion Forecast, by End User 2020 & 2033
- Table 61: Global Engineering Services Outsourcing Industry Revenue Million Forecast, by Country 2020 & 2033
- Table 62: Global Engineering Services Outsourcing Industry Volume Trillion Forecast, by Country 2020 & 2033
Frequently Asked Questions
1. What is the projected Compound Annual Growth Rate (CAGR) of the Engineering Services Outsourcing Industry?
The projected CAGR is approximately 12.89%.
2. Which companies are prominent players in the Engineering Services Outsourcing Industry?
Key companies in the market include Tech Mahindra Limited, Tata Consultancy Services Limited, Infosys Limited, HCL Technologies Limited, Wipro Ltd, Capgemini Technology Services India Limited, Globallogic Inc, Accenture, RLE International Inc, ASAP Holding GmbH, Tata Technologies**List Not Exhaustive.
3. What are the main segments of the Engineering Services Outsourcing Industry?
The market segments include Services, End User.
4. Can you provide details about the market size?
The market size is estimated to be USD 2.91 Million as of 2022.
5. What are some drivers contributing to market growth?
N/A
6. What are the notable trends driving market growth?
Rising Adoption of Integrated Solutions Driving the Growth of the Market.
7. Are there any restraints impacting market growth?
N/A
8. Can you provide examples of recent developments in the market?
April 2023: The relationship between Marks and Spencer PLC (M&S) and Tata Consultancy Services (TCS) has been extended to change M&S's core technology stack, increase innovation speed and resilience, and promote sustainable growth. The modernization program will enhance speed to market, lower technological debt, and boost operating model efficiency and effectiveness for M&S. M&S' strategic aims of providing better customer experience, driving online growth, leading in omnichannel and sustainability, modernizing its supply chain, increasing its worldwide reach will be expedited by the transformation into a simple, agile, data-led business.
9. What pricing options are available for accessing the report?
Pricing options include single-user, multi-user, and enterprise licenses priced at USD 4750, USD 5250, and USD 8750 respectively.
10. Is the market size provided in terms of value or volume?
The market size is provided in terms of value, measured in Million and volume, measured in Trillion.
11. Are there any specific market keywords associated with the report?
Yes, the market keyword associated with the report is "Engineering Services Outsourcing Industry," which aids in identifying and referencing the specific market segment covered.
12. How do I determine which pricing option suits my needs best?
The pricing options vary based on user requirements and access needs. Individual users may opt for single-user licenses, while businesses requiring broader access may choose multi-user or enterprise licenses for cost-effective access to the report.
13. Are there any additional resources or data provided in the Engineering Services Outsourcing Industry report?
While the report offers comprehensive insights, it's advisable to review the specific contents or supplementary materials provided to ascertain if additional resources or data are available.
14. How can I stay updated on further developments or reports in the Engineering Services Outsourcing Industry?
To stay informed about further developments, trends, and reports in the Engineering Services Outsourcing Industry, consider subscribing to industry newsletters, following relevant companies and organizations, or regularly checking reputable industry news sources and publications.
Methodology
Step 1 - Identification of Relevant Samples Size from Population Database


Step 2 - Approaches for Defining Global Market Size (Value, Volume* & Price*)

Note*: In applicable scenarios
Step 3 - Data Sources
Primary Research
- Web Analytics
- Survey Reports
- Research Institute
- Latest Research Reports
- Opinion Leaders
Secondary Research
- Annual Reports
- White Paper
- Latest Press Release
- Industry Association
- Paid Database
- Investor Presentations

Step 4 - Data Triangulation
Involves using different sources of information in order to increase the validity of a study
These sources are likely to be stakeholders in a program - participants, other researchers, program staff, other community members, and so on.
Then we put all data in single framework & apply various statistical tools to find out the dynamic on the market.
During the analysis stage, feedback from the stakeholder groups would be compared to determine areas of agreement as well as areas of divergence