


Key Insights
The global erectile dysfunction (ED) pills market is projected to reach $3.12 billion by 2025, with an estimated compound annual growth rate (CAGR) of 9.2% from 2025 to 2033. This expansion is driven by the increasing incidence of ED, particularly in aging male populations worldwide. Enhanced awareness of treatment solutions and improved healthcare access, especially in emerging economies, are further accelerating market growth. The ongoing introduction of advanced formulations, including extended-release options and those with reduced side effects, also contributes to market dynamics. Additionally, the growing adoption of e-pharmacies and telehealth services enhances accessibility and convenience for ED medication, widening the market's reach. Key growth restraints include high treatment expenses, potential adverse effects, and the availability of less effective alternative therapies.
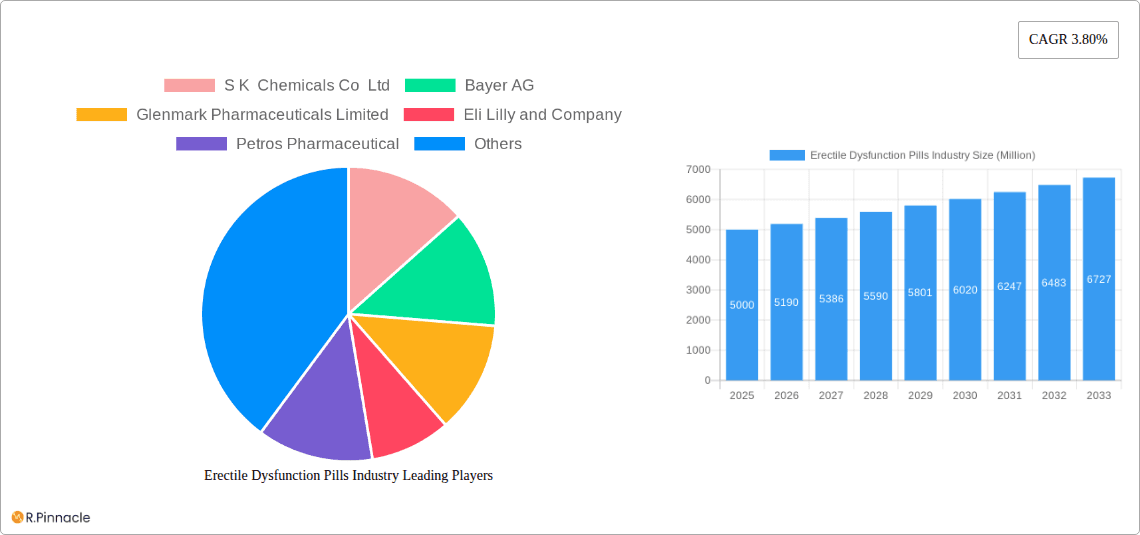
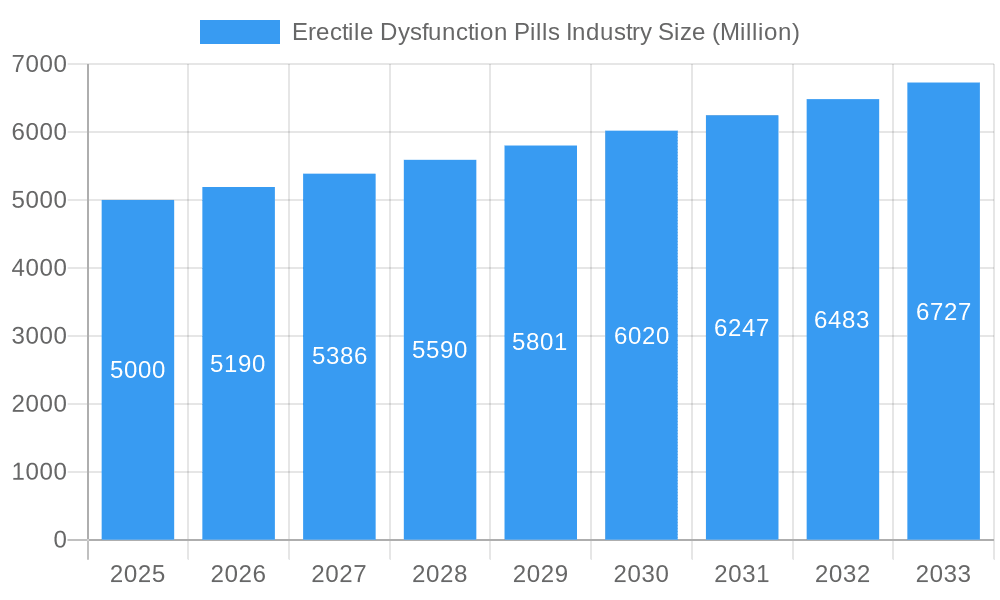
Erectile Dysfunction Pills Industry Market Size (In Billion)

Market segmentation highlights the dominance of oral medications such as sildenafil citrate, tadalafil, and vardenafil, attributed to established brand recognition and physician preference. The retail pharmacy channel remains the primary distribution route, with online pharmacies experiencing rapid growth due to patient privacy and convenience benefits. Geographically, North America and Europe currently lead market shares, supported by substantial healthcare investments and effective awareness initiatives. However, significant growth is anticipated in the Asia-Pacific and other emerging markets, driven by rising healthcare spending and an expanding middle class with better access to modern medical treatments. Leading companies, including Pfizer Inc., Eli Lilly and Company, and Bayer AG, are actively pursuing innovation and market expansion through strategic collaborations, new product introductions, and global distribution strategies. The long-term forecast for the ED pills market remains robust, fueled by demographic trends and continuous advancements in therapeutic approaches.
Erectile Dysfunction Pills Industry Company Market Share
Erectile Dysfunction Pills Industry Report: 2019-2033
This comprehensive report provides a detailed analysis of the Erectile Dysfunction Pills market, offering invaluable insights for industry professionals, investors, and strategists. With a study period spanning 2019-2033, a base year of 2025, and a forecast period of 2025-2033, this report leverages rigorous data analysis to project market trends and identify lucrative opportunities. The report covers key market segments, leading players including Pfizer Inc, Eli Lilly and Company, and Bayer AG, and significant industry developments. Expect detailed analysis of market size (in Millions), CAGR, and competitive landscapes, empowering you to make informed business decisions.
Erectile Dysfunction Pills Industry Market Structure & Innovation Trends
The Erectile Dysfunction Pills market exhibits a moderately concentrated structure, with key players like Pfizer Inc, Eli Lilly and Company, and Bayer AG holding significant market share. However, the presence of several smaller players fosters competition and innovation. Market share data for 2024 indicates Pfizer holds approximately xx% share, followed by Eli Lilly with xx%, and Bayer with xx%. The remaining share is distributed among other companies mentioned earlier. The market is driven by continuous innovation in drug formulations, including sublingual tablets and topical creams, aiming to improve efficacy and patient convenience. Stringent regulatory frameworks govern the development and marketing of these drugs, necessitating extensive clinical trials and approvals. Substitutes exist, such as penile injections and vacuum devices, but oral pills remain the dominant treatment choice due to their convenience. The end-user demographics primarily comprise adult males aged 40-70, with a growing incidence of erectile dysfunction among younger age groups due to lifestyle factors. M&A activity in this sector has been moderate in recent years, with deal values totaling approximately $xx Million in the past five years, primarily focused on expanding product portfolios and market reach.
Erectile Dysfunction Pills Industry Market Dynamics & Trends
The Erectile Dysfunction Pills market is witnessing robust growth, projected at a CAGR of xx% during the forecast period (2025-2033). This growth is driven by several factors, including increasing prevalence of erectile dysfunction, rising awareness about treatment options, and growing adoption of online pharmacies. Technological advancements in drug delivery systems, such as sublingual tablets and topical creams, are enhancing convenience and efficacy, further boosting market penetration. Changing consumer preferences favor convenient and discreet treatment options. Competitive dynamics are characterized by intense competition among established players, along with the emergence of new players with innovative products. This competitive landscape fuels further innovation and price competitiveness. Market penetration is currently estimated at xx% in developed countries and xx% in emerging markets, showing significant room for growth, especially in regions with increasing healthcare awareness and access.
Dominant Regions & Segments in Erectile Dysfunction Pills Industry
- Dominant Region: North America currently holds the largest market share in the Erectile Dysfunction Pills industry, driven by high healthcare expenditure, robust healthcare infrastructure, and significant prevalence of erectile dysfunction.
- Dominant Product Segment: Sildenafil citrate (Viagra) remains the leading product segment, benefiting from its long-established brand recognition and widespread availability.
- Dominant Distribution Channel: Retail pharmacies continue to be the dominant distribution channel, offering accessibility and established customer relationships. However, the online pharmacy segment is witnessing significant growth due to convenience and privacy.
Key drivers for the dominance of North America include robust healthcare infrastructure, high per capita income, and greater awareness of erectile dysfunction treatments. In contrast, emerging markets offer significant growth potential driven by increasing healthcare spending, growing middle class, and rising awareness about treatment options.
Erectile Dysfunction Pills Industry Product Innovations
Recent product innovations focus on improving efficacy, convenience, and tolerability. This includes the development of sublingual formulations for faster absorption, topical creams for enhanced discretion, and improved formulations with fewer side effects. These innovations cater to evolving patient needs and preferences, leading to increased market competitiveness and overall growth. The focus on patient experience and better outcomes is driving the innovation landscape.
Report Scope & Segmentation Analysis
This report segments the Erectile Dysfunction Pills market based on product type (Viagra, Cialis, Levitra/Staxyn, Stendra/Spedra, Zydena, Vitaros, Other Products) and distribution channel (Hospital Pharmacies, Retail Pharmacies, Online Pharmacies). Each segment's growth projections, market sizes, and competitive dynamics are analyzed in detail. The market is expected to witness significant growth across all segments during the forecast period, with the online pharmacy segment exhibiting the highest growth rate.
Key Drivers of Erectile Dysfunction Pills Industry Growth
Several factors contribute to the growth of the Erectile Dysfunction Pills industry. The increasing prevalence of erectile dysfunction among men is a key driver. Additionally, growing awareness of available treatment options and improved access to healthcare are fueling market expansion. Technological advancements in drug delivery systems and the rising adoption of online pharmacies further contribute to industry growth.
Challenges in the Erectile Dysfunction Pills Industry Sector
The Erectile Dysfunction Pills industry faces challenges such as stringent regulatory hurdles for new drug approvals, potentially leading to increased development costs and longer time-to-market. Supply chain disruptions can impact the availability of raw materials and finished products, affecting market supply. Furthermore, intense competition among established players and the emergence of generic drugs create pricing pressures. These challenges could potentially limit market growth if not managed effectively.
Emerging Opportunities in Erectile Dysfunction Pills Industry
Emerging opportunities include the development of novel drug formulations with improved efficacy and fewer side effects. Expanding into untapped markets, particularly in developing countries, presents significant growth potential. Personalized medicine approaches tailored to individual patient needs are gaining traction, creating new avenues for innovation and revenue generation.
Leading Players in the Erectile Dysfunction Pills Industry Market
Key Developments in Erectile Dysfunction Pills Industry Industry
- September 2021: iX Biopharma signed an agreement with CRPCG for licensing, supply, and distribution of Wafesil in China.
- September 2021: Almus launched Almus Erectile Dysfunction Relief 50mg Film-Coated Tablets in the UK.
Future Outlook for Erectile Dysfunction Pills Industry Market
The Erectile Dysfunction Pills market is poised for continued growth, driven by increasing prevalence, technological advancements, and expansion into new markets. Strategic partnerships, product diversification, and a focus on personalized medicine will be key factors in shaping future market dynamics and unlocking significant growth opportunities. The market's future potential is strong, particularly in regions with rising healthcare expenditure and increasing awareness of erectile dysfunction.
Erectile Dysfunction Pills Industry Segmentation
-
1. Product
- 1.1. Viagra (sildenafil citrate)
- 1.2. Cialis (Tadalafil)
- 1.3. Levitra/Staxyn (vardenafil)
- 1.4. Stendra/Spedra (avanafil)
- 1.5. Zydena (udenafil)
- 1.6. Vitaros (Alprostadil Cream)
- 1.7. Other Products
-
2. Distribution Channel
- 2.1. Hospital Pharmacies
- 2.2. Retail Pharmacies
- 2.3. Online Pharmacies
Erectile Dysfunction Pills Industry Segmentation By Geography
-
1. North America
- 1.1. United States
- 1.2. Canada
- 1.3. Mexico
-
2. Europe
- 2.1. Germany
- 2.2. United Kingdom
- 2.3. France
- 2.4. Italy
- 2.5. Spain
- 2.6. Rest of Europe
-
3. Asia Pacific
- 3.1. China
- 3.2. Japan
- 3.3. India
- 3.4. Australia
- 3.5. South Korea
- 3.6. Rest of Asia Pacific
-
4. Middle East and Africa
- 4.1. GCC
- 4.2. South Africa
- 4.3. Rest of Middle East and Africa
-
5. South America
- 5.1. Brazil
- 5.2. Argentina
- 5.3. Rest of South America
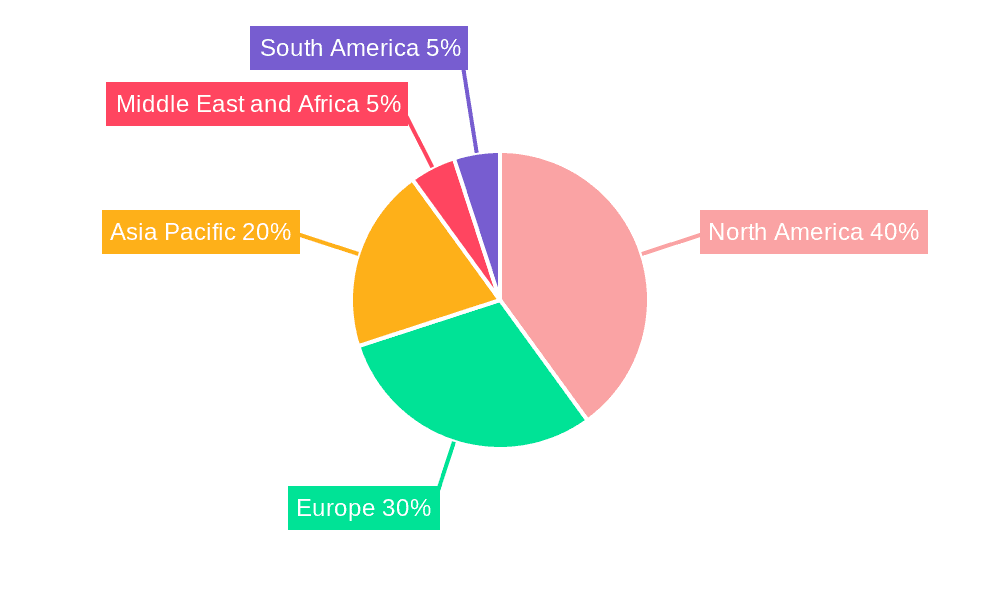
Erectile Dysfunction Pills Industry Regional Market Share
Geographic Coverage of Erectile Dysfunction Pills Industry
Erectile Dysfunction Pills Industry REPORT HIGHLIGHTS
| Aspects | Details |
|---|---|
| Study Period | 2020-2034 |
| Base Year | 2025 |
| Estimated Year | 2026 |
| Forecast Period | 2026-2034 |
| Historical Period | 2020-2025 |
| Growth Rate | CAGR of 9.2% from 2020-2034 |
| Segmentation |
|
Table of Contents
- 1. Introduction
- 1.1. Research Scope
- 1.2. Market Segmentation
- 1.3. Research Methodology
- 1.4. Definitions and Assumptions
- 2. Executive Summary
- 2.1. Introduction
- 3. Market Dynamics
- 3.1. Introduction
- 3.2. Market Drivers
- 3.2.1. Rising Adoption of a Sedentary Lifestyle Along with the Associated Stress; Rising Geriatric Population; Comorbidity between Erectile Dysfunction and Heart Diseases and Diabetes
- 3.3. Market Restrains
- 3.3.1. Reluctance of Patients to Seek Treatment; Poor Patient Adherence to ED Drugs
- 3.4. Market Trends
- 3.4.1. The Viagra (sildenafil citrate) Segment is Expected to Dominate the Market
- 4. Market Factor Analysis
- 4.1. Porters Five Forces
- 4.2. Supply/Value Chain
- 4.3. PESTEL analysis
- 4.4. Market Entropy
- 4.5. Patent/Trademark Analysis
- 5. Global Erectile Dysfunction Pills Industry Analysis, Insights and Forecast, 2020-2032
- 5.1. Market Analysis, Insights and Forecast - by Product
- 5.1.1. Viagra (sildenafil citrate)
- 5.1.2. Cialis (Tadalafil)
- 5.1.3. Levitra/Staxyn (vardenafil)
- 5.1.4. Stendra/Spedra (avanafil)
- 5.1.5. Zydena (udenafil)
- 5.1.6. Vitaros (Alprostadil Cream)
- 5.1.7. Other Products
- 5.2. Market Analysis, Insights and Forecast - by Distribution Channel
- 5.2.1. Hospital Pharmacies
- 5.2.2. Retail Pharmacies
- 5.2.3. Online Pharmacies
- 5.3. Market Analysis, Insights and Forecast - by Region
- 5.3.1. North America
- 5.3.2. Europe
- 5.3.3. Asia Pacific
- 5.3.4. Middle East and Africa
- 5.3.5. South America
- 5.1. Market Analysis, Insights and Forecast - by Product
- 6. North America Erectile Dysfunction Pills Industry Analysis, Insights and Forecast, 2020-2032
- 6.1. Market Analysis, Insights and Forecast - by Product
- 6.1.1. Viagra (sildenafil citrate)
- 6.1.2. Cialis (Tadalafil)
- 6.1.3. Levitra/Staxyn (vardenafil)
- 6.1.4. Stendra/Spedra (avanafil)
- 6.1.5. Zydena (udenafil)
- 6.1.6. Vitaros (Alprostadil Cream)
- 6.1.7. Other Products
- 6.2. Market Analysis, Insights and Forecast - by Distribution Channel
- 6.2.1. Hospital Pharmacies
- 6.2.2. Retail Pharmacies
- 6.2.3. Online Pharmacies
- 6.1. Market Analysis, Insights and Forecast - by Product
- 7. Europe Erectile Dysfunction Pills Industry Analysis, Insights and Forecast, 2020-2032
- 7.1. Market Analysis, Insights and Forecast - by Product
- 7.1.1. Viagra (sildenafil citrate)
- 7.1.2. Cialis (Tadalafil)
- 7.1.3. Levitra/Staxyn (vardenafil)
- 7.1.4. Stendra/Spedra (avanafil)
- 7.1.5. Zydena (udenafil)
- 7.1.6. Vitaros (Alprostadil Cream)
- 7.1.7. Other Products
- 7.2. Market Analysis, Insights and Forecast - by Distribution Channel
- 7.2.1. Hospital Pharmacies
- 7.2.2. Retail Pharmacies
- 7.2.3. Online Pharmacies
- 7.1. Market Analysis, Insights and Forecast - by Product
- 8. Asia Pacific Erectile Dysfunction Pills Industry Analysis, Insights and Forecast, 2020-2032
- 8.1. Market Analysis, Insights and Forecast - by Product
- 8.1.1. Viagra (sildenafil citrate)
- 8.1.2. Cialis (Tadalafil)
- 8.1.3. Levitra/Staxyn (vardenafil)
- 8.1.4. Stendra/Spedra (avanafil)
- 8.1.5. Zydena (udenafil)
- 8.1.6. Vitaros (Alprostadil Cream)
- 8.1.7. Other Products
- 8.2. Market Analysis, Insights and Forecast - by Distribution Channel
- 8.2.1. Hospital Pharmacies
- 8.2.2. Retail Pharmacies
- 8.2.3. Online Pharmacies
- 8.1. Market Analysis, Insights and Forecast - by Product
- 9. Middle East and Africa Erectile Dysfunction Pills Industry Analysis, Insights and Forecast, 2020-2032
- 9.1. Market Analysis, Insights and Forecast - by Product
- 9.1.1. Viagra (sildenafil citrate)
- 9.1.2. Cialis (Tadalafil)
- 9.1.3. Levitra/Staxyn (vardenafil)
- 9.1.4. Stendra/Spedra (avanafil)
- 9.1.5. Zydena (udenafil)
- 9.1.6. Vitaros (Alprostadil Cream)
- 9.1.7. Other Products
- 9.2. Market Analysis, Insights and Forecast - by Distribution Channel
- 9.2.1. Hospital Pharmacies
- 9.2.2. Retail Pharmacies
- 9.2.3. Online Pharmacies
- 9.1. Market Analysis, Insights and Forecast - by Product
- 10. South America Erectile Dysfunction Pills Industry Analysis, Insights and Forecast, 2020-2032
- 10.1. Market Analysis, Insights and Forecast - by Product
- 10.1.1. Viagra (sildenafil citrate)
- 10.1.2. Cialis (Tadalafil)
- 10.1.3. Levitra/Staxyn (vardenafil)
- 10.1.4. Stendra/Spedra (avanafil)
- 10.1.5. Zydena (udenafil)
- 10.1.6. Vitaros (Alprostadil Cream)
- 10.1.7. Other Products
- 10.2. Market Analysis, Insights and Forecast - by Distribution Channel
- 10.2.1. Hospital Pharmacies
- 10.2.2. Retail Pharmacies
- 10.2.3. Online Pharmacies
- 10.1. Market Analysis, Insights and Forecast - by Product
- 11. Competitive Analysis
- 11.1. Global Market Share Analysis 2025
- 11.2. Company Profiles
- 11.2.1 S K Chemicals Co Ltd
- 11.2.1.1. Overview
- 11.2.1.2. Products
- 11.2.1.3. SWOT Analysis
- 11.2.1.4. Recent Developments
- 11.2.1.5. Financials (Based on Availability)
- 11.2.2 Bayer AG
- 11.2.2.1. Overview
- 11.2.2.2. Products
- 11.2.2.3. SWOT Analysis
- 11.2.2.4. Recent Developments
- 11.2.2.5. Financials (Based on Availability)
- 11.2.3 Glenmark Pharmaceuticals Limited
- 11.2.3.1. Overview
- 11.2.3.2. Products
- 11.2.3.3. SWOT Analysis
- 11.2.3.4. Recent Developments
- 11.2.3.5. Financials (Based on Availability)
- 11.2.4 Eli Lilly and Company
- 11.2.4.1. Overview
- 11.2.4.2. Products
- 11.2.4.3. SWOT Analysis
- 11.2.4.4. Recent Developments
- 11.2.4.5. Financials (Based on Availability)
- 11.2.5 Petros Pharmaceutical
- 11.2.5.1. Overview
- 11.2.5.2. Products
- 11.2.5.3. SWOT Analysis
- 11.2.5.4. Recent Developments
- 11.2.5.5. Financials (Based on Availability)
- 11.2.6 Teva Pharmaceutical Industries Ltd
- 11.2.6.1. Overview
- 11.2.6.2. Products
- 11.2.6.3. SWOT Analysis
- 11.2.6.4. Recent Developments
- 11.2.6.5. Financials (Based on Availability)
- 11.2.7 Apricus Biosciences Inc
- 11.2.7.1. Overview
- 11.2.7.2. Products
- 11.2.7.3. SWOT Analysis
- 11.2.7.4. Recent Developments
- 11.2.7.5. Financials (Based on Availability)
- 11.2.8 Cipla Ltd
- 11.2.8.1. Overview
- 11.2.8.2. Products
- 11.2.8.3. SWOT Analysis
- 11.2.8.4. Recent Developments
- 11.2.8.5. Financials (Based on Availability)
- 11.2.9 Lupin Limited
- 11.2.9.1. Overview
- 11.2.9.2. Products
- 11.2.9.3. SWOT Analysis
- 11.2.9.4. Recent Developments
- 11.2.9.5. Financials (Based on Availability)
- 11.2.10 VIVUS Inc
- 11.2.10.1. Overview
- 11.2.10.2. Products
- 11.2.10.3. SWOT Analysis
- 11.2.10.4. Recent Developments
- 11.2.10.5. Financials (Based on Availability)
- 11.2.11 GlaxoSmithKline PLC
- 11.2.11.1. Overview
- 11.2.11.2. Products
- 11.2.11.3. SWOT Analysis
- 11.2.11.4. Recent Developments
- 11.2.11.5. Financials (Based on Availability)
- 11.2.12 Pfizer Inc
- 11.2.12.1. Overview
- 11.2.12.2. Products
- 11.2.12.3. SWOT Analysis
- 11.2.12.4. Recent Developments
- 11.2.12.5. Financials (Based on Availability)
- 11.2.1 S K Chemicals Co Ltd
List of Figures
- Figure 1: Global Erectile Dysfunction Pills Industry Revenue Breakdown (billion, %) by Region 2025 & 2033
- Figure 2: Global Erectile Dysfunction Pills Industry Volume Breakdown (K Unit, %) by Region 2025 & 2033
- Figure 3: North America Erectile Dysfunction Pills Industry Revenue (billion), by Product 2025 & 2033
- Figure 4: North America Erectile Dysfunction Pills Industry Volume (K Unit), by Product 2025 & 2033
- Figure 5: North America Erectile Dysfunction Pills Industry Revenue Share (%), by Product 2025 & 2033
- Figure 6: North America Erectile Dysfunction Pills Industry Volume Share (%), by Product 2025 & 2033
- Figure 7: North America Erectile Dysfunction Pills Industry Revenue (billion), by Distribution Channel 2025 & 2033
- Figure 8: North America Erectile Dysfunction Pills Industry Volume (K Unit), by Distribution Channel 2025 & 2033
- Figure 9: North America Erectile Dysfunction Pills Industry Revenue Share (%), by Distribution Channel 2025 & 2033
- Figure 10: North America Erectile Dysfunction Pills Industry Volume Share (%), by Distribution Channel 2025 & 2033
- Figure 11: North America Erectile Dysfunction Pills Industry Revenue (billion), by Country 2025 & 2033
- Figure 12: North America Erectile Dysfunction Pills Industry Volume (K Unit), by Country 2025 & 2033
- Figure 13: North America Erectile Dysfunction Pills Industry Revenue Share (%), by Country 2025 & 2033
- Figure 14: North America Erectile Dysfunction Pills Industry Volume Share (%), by Country 2025 & 2033
- Figure 15: Europe Erectile Dysfunction Pills Industry Revenue (billion), by Product 2025 & 2033
- Figure 16: Europe Erectile Dysfunction Pills Industry Volume (K Unit), by Product 2025 & 2033
- Figure 17: Europe Erectile Dysfunction Pills Industry Revenue Share (%), by Product 2025 & 2033
- Figure 18: Europe Erectile Dysfunction Pills Industry Volume Share (%), by Product 2025 & 2033
- Figure 19: Europe Erectile Dysfunction Pills Industry Revenue (billion), by Distribution Channel 2025 & 2033
- Figure 20: Europe Erectile Dysfunction Pills Industry Volume (K Unit), by Distribution Channel 2025 & 2033
- Figure 21: Europe Erectile Dysfunction Pills Industry Revenue Share (%), by Distribution Channel 2025 & 2033
- Figure 22: Europe Erectile Dysfunction Pills Industry Volume Share (%), by Distribution Channel 2025 & 2033
- Figure 23: Europe Erectile Dysfunction Pills Industry Revenue (billion), by Country 2025 & 2033
- Figure 24: Europe Erectile Dysfunction Pills Industry Volume (K Unit), by Country 2025 & 2033
- Figure 25: Europe Erectile Dysfunction Pills Industry Revenue Share (%), by Country 2025 & 2033
- Figure 26: Europe Erectile Dysfunction Pills Industry Volume Share (%), by Country 2025 & 2033
- Figure 27: Asia Pacific Erectile Dysfunction Pills Industry Revenue (billion), by Product 2025 & 2033
- Figure 28: Asia Pacific Erectile Dysfunction Pills Industry Volume (K Unit), by Product 2025 & 2033
- Figure 29: Asia Pacific Erectile Dysfunction Pills Industry Revenue Share (%), by Product 2025 & 2033
- Figure 30: Asia Pacific Erectile Dysfunction Pills Industry Volume Share (%), by Product 2025 & 2033
- Figure 31: Asia Pacific Erectile Dysfunction Pills Industry Revenue (billion), by Distribution Channel 2025 & 2033
- Figure 32: Asia Pacific Erectile Dysfunction Pills Industry Volume (K Unit), by Distribution Channel 2025 & 2033
- Figure 33: Asia Pacific Erectile Dysfunction Pills Industry Revenue Share (%), by Distribution Channel 2025 & 2033
- Figure 34: Asia Pacific Erectile Dysfunction Pills Industry Volume Share (%), by Distribution Channel 2025 & 2033
- Figure 35: Asia Pacific Erectile Dysfunction Pills Industry Revenue (billion), by Country 2025 & 2033
- Figure 36: Asia Pacific Erectile Dysfunction Pills Industry Volume (K Unit), by Country 2025 & 2033
- Figure 37: Asia Pacific Erectile Dysfunction Pills Industry Revenue Share (%), by Country 2025 & 2033
- Figure 38: Asia Pacific Erectile Dysfunction Pills Industry Volume Share (%), by Country 2025 & 2033
- Figure 39: Middle East and Africa Erectile Dysfunction Pills Industry Revenue (billion), by Product 2025 & 2033
- Figure 40: Middle East and Africa Erectile Dysfunction Pills Industry Volume (K Unit), by Product 2025 & 2033
- Figure 41: Middle East and Africa Erectile Dysfunction Pills Industry Revenue Share (%), by Product 2025 & 2033
- Figure 42: Middle East and Africa Erectile Dysfunction Pills Industry Volume Share (%), by Product 2025 & 2033
- Figure 43: Middle East and Africa Erectile Dysfunction Pills Industry Revenue (billion), by Distribution Channel 2025 & 2033
- Figure 44: Middle East and Africa Erectile Dysfunction Pills Industry Volume (K Unit), by Distribution Channel 2025 & 2033
- Figure 45: Middle East and Africa Erectile Dysfunction Pills Industry Revenue Share (%), by Distribution Channel 2025 & 2033
- Figure 46: Middle East and Africa Erectile Dysfunction Pills Industry Volume Share (%), by Distribution Channel 2025 & 2033
- Figure 47: Middle East and Africa Erectile Dysfunction Pills Industry Revenue (billion), by Country 2025 & 2033
- Figure 48: Middle East and Africa Erectile Dysfunction Pills Industry Volume (K Unit), by Country 2025 & 2033
- Figure 49: Middle East and Africa Erectile Dysfunction Pills Industry Revenue Share (%), by Country 2025 & 2033
- Figure 50: Middle East and Africa Erectile Dysfunction Pills Industry Volume Share (%), by Country 2025 & 2033
- Figure 51: South America Erectile Dysfunction Pills Industry Revenue (billion), by Product 2025 & 2033
- Figure 52: South America Erectile Dysfunction Pills Industry Volume (K Unit), by Product 2025 & 2033
- Figure 53: South America Erectile Dysfunction Pills Industry Revenue Share (%), by Product 2025 & 2033
- Figure 54: South America Erectile Dysfunction Pills Industry Volume Share (%), by Product 2025 & 2033
- Figure 55: South America Erectile Dysfunction Pills Industry Revenue (billion), by Distribution Channel 2025 & 2033
- Figure 56: South America Erectile Dysfunction Pills Industry Volume (K Unit), by Distribution Channel 2025 & 2033
- Figure 57: South America Erectile Dysfunction Pills Industry Revenue Share (%), by Distribution Channel 2025 & 2033
- Figure 58: South America Erectile Dysfunction Pills Industry Volume Share (%), by Distribution Channel 2025 & 2033
- Figure 59: South America Erectile Dysfunction Pills Industry Revenue (billion), by Country 2025 & 2033
- Figure 60: South America Erectile Dysfunction Pills Industry Volume (K Unit), by Country 2025 & 2033
- Figure 61: South America Erectile Dysfunction Pills Industry Revenue Share (%), by Country 2025 & 2033
- Figure 62: South America Erectile Dysfunction Pills Industry Volume Share (%), by Country 2025 & 2033
List of Tables
- Table 1: Global Erectile Dysfunction Pills Industry Revenue billion Forecast, by Product 2020 & 2033
- Table 2: Global Erectile Dysfunction Pills Industry Volume K Unit Forecast, by Product 2020 & 2033
- Table 3: Global Erectile Dysfunction Pills Industry Revenue billion Forecast, by Distribution Channel 2020 & 2033
- Table 4: Global Erectile Dysfunction Pills Industry Volume K Unit Forecast, by Distribution Channel 2020 & 2033
- Table 5: Global Erectile Dysfunction Pills Industry Revenue billion Forecast, by Region 2020 & 2033
- Table 6: Global Erectile Dysfunction Pills Industry Volume K Unit Forecast, by Region 2020 & 2033
- Table 7: Global Erectile Dysfunction Pills Industry Revenue billion Forecast, by Product 2020 & 2033
- Table 8: Global Erectile Dysfunction Pills Industry Volume K Unit Forecast, by Product 2020 & 2033
- Table 9: Global Erectile Dysfunction Pills Industry Revenue billion Forecast, by Distribution Channel 2020 & 2033
- Table 10: Global Erectile Dysfunction Pills Industry Volume K Unit Forecast, by Distribution Channel 2020 & 2033
- Table 11: Global Erectile Dysfunction Pills Industry Revenue billion Forecast, by Country 2020 & 2033
- Table 12: Global Erectile Dysfunction Pills Industry Volume K Unit Forecast, by Country 2020 & 2033
- Table 13: United States Erectile Dysfunction Pills Industry Revenue (billion) Forecast, by Application 2020 & 2033
- Table 14: United States Erectile Dysfunction Pills Industry Volume (K Unit) Forecast, by Application 2020 & 2033
- Table 15: Canada Erectile Dysfunction Pills Industry Revenue (billion) Forecast, by Application 2020 & 2033
- Table 16: Canada Erectile Dysfunction Pills Industry Volume (K Unit) Forecast, by Application 2020 & 2033
- Table 17: Mexico Erectile Dysfunction Pills Industry Revenue (billion) Forecast, by Application 2020 & 2033
- Table 18: Mexico Erectile Dysfunction Pills Industry Volume (K Unit) Forecast, by Application 2020 & 2033
- Table 19: Global Erectile Dysfunction Pills Industry Revenue billion Forecast, by Product 2020 & 2033
- Table 20: Global Erectile Dysfunction Pills Industry Volume K Unit Forecast, by Product 2020 & 2033
- Table 21: Global Erectile Dysfunction Pills Industry Revenue billion Forecast, by Distribution Channel 2020 & 2033
- Table 22: Global Erectile Dysfunction Pills Industry Volume K Unit Forecast, by Distribution Channel 2020 & 2033
- Table 23: Global Erectile Dysfunction Pills Industry Revenue billion Forecast, by Country 2020 & 2033
- Table 24: Global Erectile Dysfunction Pills Industry Volume K Unit Forecast, by Country 2020 & 2033
- Table 25: Germany Erectile Dysfunction Pills Industry Revenue (billion) Forecast, by Application 2020 & 2033
- Table 26: Germany Erectile Dysfunction Pills Industry Volume (K Unit) Forecast, by Application 2020 & 2033
- Table 27: United Kingdom Erectile Dysfunction Pills Industry Revenue (billion) Forecast, by Application 2020 & 2033
- Table 28: United Kingdom Erectile Dysfunction Pills Industry Volume (K Unit) Forecast, by Application 2020 & 2033
- Table 29: France Erectile Dysfunction Pills Industry Revenue (billion) Forecast, by Application 2020 & 2033
- Table 30: France Erectile Dysfunction Pills Industry Volume (K Unit) Forecast, by Application 2020 & 2033
- Table 31: Italy Erectile Dysfunction Pills Industry Revenue (billion) Forecast, by Application 2020 & 2033
- Table 32: Italy Erectile Dysfunction Pills Industry Volume (K Unit) Forecast, by Application 2020 & 2033
- Table 33: Spain Erectile Dysfunction Pills Industry Revenue (billion) Forecast, by Application 2020 & 2033
- Table 34: Spain Erectile Dysfunction Pills Industry Volume (K Unit) Forecast, by Application 2020 & 2033
- Table 35: Rest of Europe Erectile Dysfunction Pills Industry Revenue (billion) Forecast, by Application 2020 & 2033
- Table 36: Rest of Europe Erectile Dysfunction Pills Industry Volume (K Unit) Forecast, by Application 2020 & 2033
- Table 37: Global Erectile Dysfunction Pills Industry Revenue billion Forecast, by Product 2020 & 2033
- Table 38: Global Erectile Dysfunction Pills Industry Volume K Unit Forecast, by Product 2020 & 2033
- Table 39: Global Erectile Dysfunction Pills Industry Revenue billion Forecast, by Distribution Channel 2020 & 2033
- Table 40: Global Erectile Dysfunction Pills Industry Volume K Unit Forecast, by Distribution Channel 2020 & 2033
- Table 41: Global Erectile Dysfunction Pills Industry Revenue billion Forecast, by Country 2020 & 2033
- Table 42: Global Erectile Dysfunction Pills Industry Volume K Unit Forecast, by Country 2020 & 2033
- Table 43: China Erectile Dysfunction Pills Industry Revenue (billion) Forecast, by Application 2020 & 2033
- Table 44: China Erectile Dysfunction Pills Industry Volume (K Unit) Forecast, by Application 2020 & 2033
- Table 45: Japan Erectile Dysfunction Pills Industry Revenue (billion) Forecast, by Application 2020 & 2033
- Table 46: Japan Erectile Dysfunction Pills Industry Volume (K Unit) Forecast, by Application 2020 & 2033
- Table 47: India Erectile Dysfunction Pills Industry Revenue (billion) Forecast, by Application 2020 & 2033
- Table 48: India Erectile Dysfunction Pills Industry Volume (K Unit) Forecast, by Application 2020 & 2033
- Table 49: Australia Erectile Dysfunction Pills Industry Revenue (billion) Forecast, by Application 2020 & 2033
- Table 50: Australia Erectile Dysfunction Pills Industry Volume (K Unit) Forecast, by Application 2020 & 2033
- Table 51: South Korea Erectile Dysfunction Pills Industry Revenue (billion) Forecast, by Application 2020 & 2033
- Table 52: South Korea Erectile Dysfunction Pills Industry Volume (K Unit) Forecast, by Application 2020 & 2033
- Table 53: Rest of Asia Pacific Erectile Dysfunction Pills Industry Revenue (billion) Forecast, by Application 2020 & 2033
- Table 54: Rest of Asia Pacific Erectile Dysfunction Pills Industry Volume (K Unit) Forecast, by Application 2020 & 2033
- Table 55: Global Erectile Dysfunction Pills Industry Revenue billion Forecast, by Product 2020 & 2033
- Table 56: Global Erectile Dysfunction Pills Industry Volume K Unit Forecast, by Product 2020 & 2033
- Table 57: Global Erectile Dysfunction Pills Industry Revenue billion Forecast, by Distribution Channel 2020 & 2033
- Table 58: Global Erectile Dysfunction Pills Industry Volume K Unit Forecast, by Distribution Channel 2020 & 2033
- Table 59: Global Erectile Dysfunction Pills Industry Revenue billion Forecast, by Country 2020 & 2033
- Table 60: Global Erectile Dysfunction Pills Industry Volume K Unit Forecast, by Country 2020 & 2033
- Table 61: GCC Erectile Dysfunction Pills Industry Revenue (billion) Forecast, by Application 2020 & 2033
- Table 62: GCC Erectile Dysfunction Pills Industry Volume (K Unit) Forecast, by Application 2020 & 2033
- Table 63: South Africa Erectile Dysfunction Pills Industry Revenue (billion) Forecast, by Application 2020 & 2033
- Table 64: South Africa Erectile Dysfunction Pills Industry Volume (K Unit) Forecast, by Application 2020 & 2033
- Table 65: Rest of Middle East and Africa Erectile Dysfunction Pills Industry Revenue (billion) Forecast, by Application 2020 & 2033
- Table 66: Rest of Middle East and Africa Erectile Dysfunction Pills Industry Volume (K Unit) Forecast, by Application 2020 & 2033
- Table 67: Global Erectile Dysfunction Pills Industry Revenue billion Forecast, by Product 2020 & 2033
- Table 68: Global Erectile Dysfunction Pills Industry Volume K Unit Forecast, by Product 2020 & 2033
- Table 69: Global Erectile Dysfunction Pills Industry Revenue billion Forecast, by Distribution Channel 2020 & 2033
- Table 70: Global Erectile Dysfunction Pills Industry Volume K Unit Forecast, by Distribution Channel 2020 & 2033
- Table 71: Global Erectile Dysfunction Pills Industry Revenue billion Forecast, by Country 2020 & 2033
- Table 72: Global Erectile Dysfunction Pills Industry Volume K Unit Forecast, by Country 2020 & 2033
- Table 73: Brazil Erectile Dysfunction Pills Industry Revenue (billion) Forecast, by Application 2020 & 2033
- Table 74: Brazil Erectile Dysfunction Pills Industry Volume (K Unit) Forecast, by Application 2020 & 2033
- Table 75: Argentina Erectile Dysfunction Pills Industry Revenue (billion) Forecast, by Application 2020 & 2033
- Table 76: Argentina Erectile Dysfunction Pills Industry Volume (K Unit) Forecast, by Application 2020 & 2033
- Table 77: Rest of South America Erectile Dysfunction Pills Industry Revenue (billion) Forecast, by Application 2020 & 2033
- Table 78: Rest of South America Erectile Dysfunction Pills Industry Volume (K Unit) Forecast, by Application 2020 & 2033
Frequently Asked Questions
1. What is the projected Compound Annual Growth Rate (CAGR) of the Erectile Dysfunction Pills Industry?
The projected CAGR is approximately 9.2%.
2. Which companies are prominent players in the Erectile Dysfunction Pills Industry?
Key companies in the market include S K Chemicals Co Ltd, Bayer AG, Glenmark Pharmaceuticals Limited, Eli Lilly and Company, Petros Pharmaceutical, Teva Pharmaceutical Industries Ltd, Apricus Biosciences Inc, Cipla Ltd, Lupin Limited, VIVUS Inc, GlaxoSmithKline PLC, Pfizer Inc.
3. What are the main segments of the Erectile Dysfunction Pills Industry?
The market segments include Product, Distribution Channel.
4. Can you provide details about the market size?
The market size is estimated to be USD 3.12 billion as of 2022.
5. What are some drivers contributing to market growth?
Rising Adoption of a Sedentary Lifestyle Along with the Associated Stress; Rising Geriatric Population; Comorbidity between Erectile Dysfunction and Heart Diseases and Diabetes.
6. What are the notable trends driving market growth?
The Viagra (sildenafil citrate) Segment is Expected to Dominate the Market.
7. Are there any restraints impacting market growth?
Reluctance of Patients to Seek Treatment; Poor Patient Adherence to ED Drugs.
8. Can you provide examples of recent developments in the market?
In September 2021, iX Biopharma, through its wholly-owned subsidiary, signed an agreement with CRPCG for the licensing, supply, and distribution of Wafesil, a sublingual sildenafil wafer for the treatment of male erectile dysfunction, in China.
9. What pricing options are available for accessing the report?
Pricing options include single-user, multi-user, and enterprise licenses priced at USD 4750, USD 5250, and USD 8750 respectively.
10. Is the market size provided in terms of value or volume?
The market size is provided in terms of value, measured in billion and volume, measured in K Unit.
11. Are there any specific market keywords associated with the report?
Yes, the market keyword associated with the report is "Erectile Dysfunction Pills Industry," which aids in identifying and referencing the specific market segment covered.
12. How do I determine which pricing option suits my needs best?
The pricing options vary based on user requirements and access needs. Individual users may opt for single-user licenses, while businesses requiring broader access may choose multi-user or enterprise licenses for cost-effective access to the report.
13. Are there any additional resources or data provided in the Erectile Dysfunction Pills Industry report?
While the report offers comprehensive insights, it's advisable to review the specific contents or supplementary materials provided to ascertain if additional resources or data are available.
14. How can I stay updated on further developments or reports in the Erectile Dysfunction Pills Industry?
To stay informed about further developments, trends, and reports in the Erectile Dysfunction Pills Industry, consider subscribing to industry newsletters, following relevant companies and organizations, or regularly checking reputable industry news sources and publications.
Methodology
Step 1 - Identification of Relevant Samples Size from Population Database


Step 2 - Approaches for Defining Global Market Size (Value, Volume* & Price*)

Note*: In applicable scenarios
Step 3 - Data Sources
Primary Research
- Web Analytics
- Survey Reports
- Research Institute
- Latest Research Reports
- Opinion Leaders
Secondary Research
- Annual Reports
- White Paper
- Latest Press Release
- Industry Association
- Paid Database
- Investor Presentations

Step 4 - Data Triangulation
Involves using different sources of information in order to increase the validity of a study
These sources are likely to be stakeholders in a program - participants, other researchers, program staff, other community members, and so on.
Then we put all data in single framework & apply various statistical tools to find out the dynamic on the market.
During the analysis stage, feedback from the stakeholder groups would be compared to determine areas of agreement as well as areas of divergence