

Key Insights
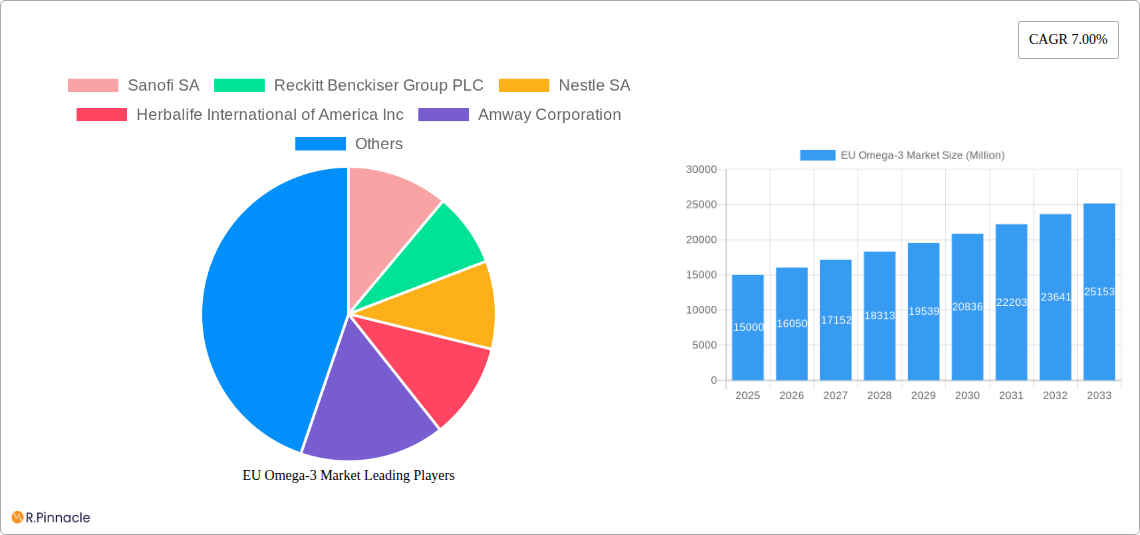
The European Union Omega-3 market is projected to reach $3.59 billion by 2025, exhibiting a compound annual growth rate (CAGR) of 7.00% from 2025 to 2033. This significant expansion is primarily driven by heightened consumer awareness of Omega-3's extensive health benefits, including its critical role in cardiovascular wellness, cognitive function, and inflammation reduction. The increasing incidence of chronic conditions such as heart disease and arthritis, coupled with a growing geriatric population, further bolsters market demand. Moreover, the expanding availability of Omega-3 fortified functional foods, dietary supplements, and infant nutrition products through diverse retail channels like supermarkets, pharmacies, and online platforms enhances market accessibility and fuels growth.
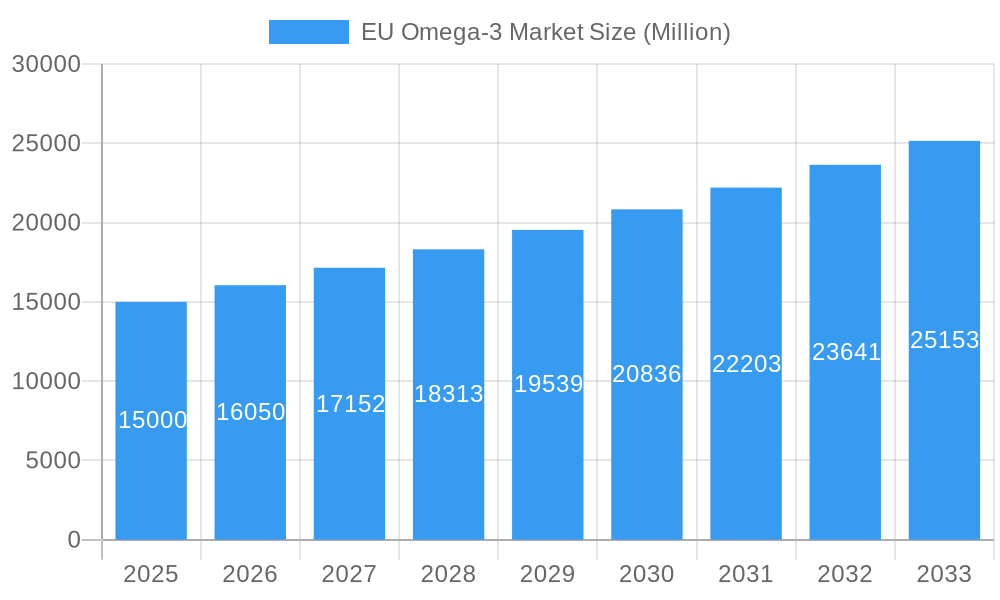
EU Omega-3 Market Market Size (In Billion)
The EU Omega-3 market is segmented by product type, including functional foods, dietary supplements, infant nutrition, pet food and feed, pharmaceutical, and clinical nutrition. Distribution channels encompass grocery retailers, pharmacies, health stores, and internet retailing. Key national markets within the EU include Germany, the United Kingdom, France, Italy, and Spain, which together constitute a significant market share. The competitive environment features established global corporations such as Sanofi SA, Reckitt Benckiser Group PLC, Nestlé SA, and Unilever PLC, alongside agile niche players. Leading companies are prioritizing product innovation, strategic collaborations, and the expansion of their distribution footprints to secure a competitive advantage. Future market trajectory will be shaped by ongoing scientific validation of health benefits, the advancement of personalized nutrition, and shifting consumer preferences towards natural and sustainable offerings.
EU Omega-3 Market Company Market Share
EU Omega-3 Market: A Comprehensive Report (2019-2033)
This in-depth report provides a comprehensive analysis of the EU Omega-3 market, covering the period 2019-2033. It offers invaluable insights into market dynamics, segmentation, key players, and future growth potential, equipping industry professionals with actionable intelligence for strategic decision-making. The report utilizes data from the historical period (2019-2024), the base year (2025), and provides estimations for 2025, with a forecast extending to 2033. Market values are expressed in Millions.
EU Omega-3 Market Market Structure & Innovation Trends
This section analyzes the competitive landscape of the EU Omega-3 market, focusing on market concentration, innovation drivers, regulatory frameworks, and M&A activities. The market is moderately consolidated, with key players such as Sanofi SA, Reckitt Benckiser Group PLC, Nestlé SA, and Unilever PLC holding significant market share. However, the presence of numerous smaller players indicates a dynamic market with room for growth and innovation.
Market Concentration: The market exhibits a Herfindahl-Hirschman Index (HHI) of xx, suggesting a moderately concentrated market. The top 5 players collectively hold approximately xx% of the market share, leaving ample opportunity for smaller companies.
Innovation Drivers: The EU Omega-3 market is driven by innovation across several fronts:
- Product diversification: Development of novel omega-3 delivery systems, including advanced formulations with enhanced bioavailability.
- Sustainability initiatives: Growing consumer demand for sustainably sourced omega-3s fuels investments in algae-based production and responsible fishing practices.
- Technological advancements: Improved extraction and purification techniques drive cost reductions and enhance product quality.
Regulatory Frameworks: EU regulations regarding food supplements and functional foods significantly impact product development and labeling requirements, requiring stringent quality control and safety testing.
Product Substitutes: Other sources of essential fatty acids, such as flaxseed oil and chia seeds, present some level of competition, although omega-3s from fish oil and algae remain dominant due to their higher concentration of EPA and DHA.
End-User Demographics: The increasing prevalence of cardiovascular diseases and growing health consciousness among consumers drives the demand for omega-3 supplements across various age groups.
M&A Activities: The market has seen moderate M&A activity in recent years, with deal values averaging approximately xx Million per transaction. These acquisitions primarily focus on expanding product portfolios and accessing new markets.
EU Omega-3 Market Market Dynamics & Trends
The EU Omega-3 market is characterized by robust growth, driven by multiple factors. Consumer awareness regarding the health benefits of omega-3 fatty acids, such as cardiovascular health and brain function, has significantly increased. This heightened consumer awareness, coupled with supportive scientific evidence, fuels the demand for omega-3-rich products. The market demonstrates a Compound Annual Growth Rate (CAGR) of xx% during the forecast period (2025-2033). Market penetration is currently at approximately xx%, with significant potential for further expansion. Technological disruptions such as the development of more sustainable omega-3 sources and advanced delivery systems are shaping market dynamics. Intense competition among established players and emerging companies fuels innovation and drives down prices.
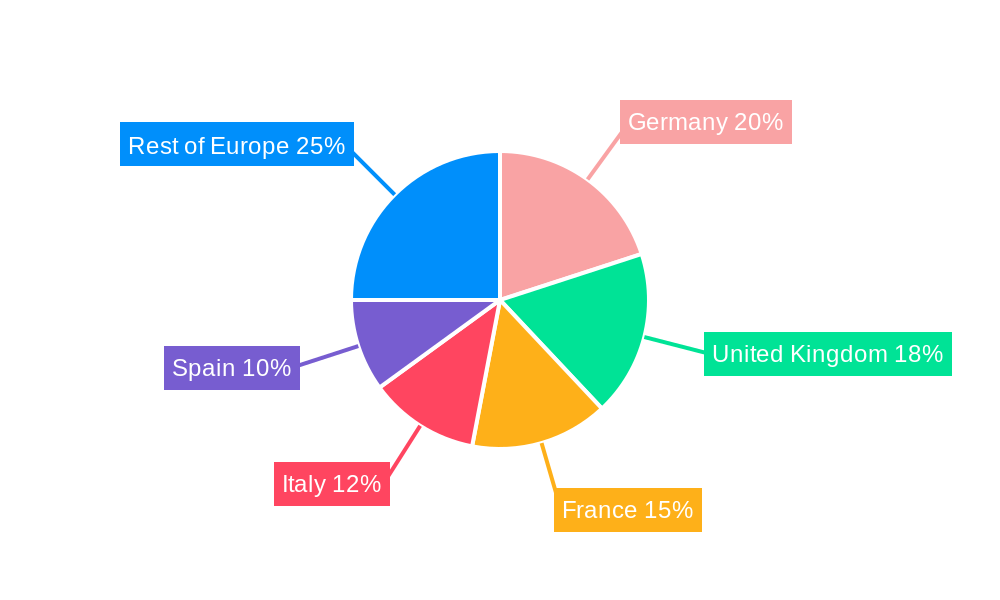
Dominant Regions & Segments in EU Omega-3 Market
Germany, the United Kingdom, and France are the leading markets within the EU, driven by high consumer spending on health and wellness products and established distribution networks.
Key Drivers:
- Germany: Strong health-conscious culture and high per capita disposable income.
- United Kingdom: Large population, robust retail infrastructure, and increased awareness of omega-3 benefits.
- France: Growing consumer interest in natural health solutions and increasing prevalence of chronic diseases.
Dominant Segments:
- Product Type: Dietary supplements constitute the largest segment, driven by ease of consumption and targeted health benefits. The functional food segment is also growing rapidly as manufacturers incorporate omega-3s into a wide range of products.
- Distribution Channel: Grocery retailers are the primary distribution channel, but online retailing shows considerable growth, offering increased convenience and product choice to consumers.
Country-Specific Analysis: While Germany, the UK, and France dominate, other countries such as Spain and Italy present considerable growth potential. Russia shows a slower growth rate due to economic factors.
EU Omega-3 Market Product Innovations
Recent innovations include the development of microalgae-derived omega-3 supplements, offering a sustainable alternative to fish oil, along with the introduction of novel delivery systems such as liposomal formulations for enhanced absorption. These innovations, coupled with the development of omega-3-enriched functional foods, cater to evolving consumer preferences for convenient and effective products. The market is witnessing a shift towards higher quality, sustainably sourced omega-3s with improved bioavailability and targeted health benefits.
Report Scope & Segmentation Analysis
This report segments the EU Omega-3 market by Product Type (Functional Food, Dietary Supplements, Infant Nutrition, Pet Food and Feed, Pharmaceutical, Clinical Nutrition) and Distribution Channel (Grocery Retailers, Pharmacies, Health Stores, Internet Retailing, Other Distribution Channels). The geographical segmentation encompasses Germany, the United Kingdom, France, Italy, Russia, Spain, and the Rest of Europe. Each segment's growth projections, market sizes, and competitive dynamics are analyzed in detail. For example, the Dietary Supplements segment is projected to witness robust growth at a CAGR of xx%, driven by its wide accessibility and targeted health claims.
Key Drivers of EU Omega-3 Market Growth
The EU Omega-3 market's growth is fuelled by rising consumer awareness of omega-3 health benefits, increased prevalence of chronic diseases, supportive regulatory frameworks promoting healthy diets, and technological advancements facilitating sustainable production and improved product quality. The growing popularity of vegan and vegetarian lifestyles also drives demand for plant-based omega-3 sources, stimulating innovation in algae-based supplements.
Challenges in the EU Omega-3 Market Sector
The market faces challenges, including fluctuating raw material prices due to factors like overfishing and climate change, stringent regulatory requirements impacting product development and launch timelines, and intense competition among various players with diverse product offerings. Maintaining supply chain stability and managing consumer perceptions regarding the sustainability of sourcing are additional concerns. The high cost of production for some omega-3 sources also limits market access for some demographics.
Emerging Opportunities in EU Omega-3 Market
Growing demand for personalized nutrition and functional foods presents a significant opportunity. Technological advancements in delivery systems that enhance absorption and bioavailability offer growth potential. Expansion into niche segments, such as specialized omega-3 supplements for athletes or individuals with specific health needs, presents another opportunity. Additionally, tapping into the growing market for sustainable and ethically sourced products can drive future growth.
Leading Players in the EU Omega-3 Market Market
- Sanofi SA
- Reckitt Benckiser Group PLC
- Nestlé SA
- Herbalife International of America Inc
- Amway Corporation
- Procter and Gamble Company
- Anpario Plc
- Unilever Plc
- Royal DSM
- Archer Daniels Midland Company
Key Developments in EU Omega-3 Market Industry
- September 2022: Inspired Pet Nutrition launched Harrington's Wet Puppy Food (UK), incorporating salmon oil as an omega-3 source.
- January 2022: Procter and Gamble Company launched Seven Seas omega-3 Max supplement (UK), focusing on heart, bone, and brain health.
- October 2021: Anpario Plc launched a microalgae-derived omega-3 supplement for animal feed, boosting omega-3 content in meat, milk, and eggs.
Future Outlook for EU Omega-3 Market Market
The EU Omega-3 market is poised for sustained growth, driven by continued consumer demand, ongoing scientific research validating health benefits, and the introduction of innovative products and sustainable sourcing methods. Strategic partnerships, focusing on R&D and expanding distribution networks, will be critical for market leadership. The increasing focus on personalized nutrition and preventative healthcare presents significant opportunities for players to develop targeted omega-3 solutions and further penetrate the market.
EU Omega-3 Market Segmentation
-
1. Product Type
- 1.1. Functional Food
- 1.2. Dietary Supplements
- 1.3. Infant Nutrition
- 1.4. Pet Food and Feed
- 1.5. Pharmaceutical
- 1.6. Clinical Nutrition
-
2. Distribution Channel
- 2.1. Grocery Retailers
- 2.2. Pharmacies
- 2.3. Health Stores
- 2.4. Internet Retailing
- 2.5. Other Distribution Channels
EU Omega-3 Market Segmentation By Geography
-
1. North America
- 1.1. United States
- 1.2. Canada
- 1.3. Mexico
-
2. South America
- 2.1. Brazil
- 2.2. Argentina
- 2.3. Rest of South America
-
3. Europe
- 3.1. United Kingdom
- 3.2. Germany
- 3.3. France
- 3.4. Italy
- 3.5. Spain
- 3.6. Russia
- 3.7. Benelux
- 3.8. Nordics
- 3.9. Rest of Europe
-
4. Middle East & Africa
- 4.1. Turkey
- 4.2. Israel
- 4.3. GCC
- 4.4. North Africa
- 4.5. South Africa
- 4.6. Rest of Middle East & Africa
-
5. Asia Pacific
- 5.1. China
- 5.2. India
- 5.3. Japan
- 5.4. South Korea
- 5.5. ASEAN
- 5.6. Oceania
- 5.7. Rest of Asia Pacific
EU Omega-3 Market Regional Market Share
Geographic Coverage of EU Omega-3 Market
EU Omega-3 Market REPORT HIGHLIGHTS
| Aspects | Details |
|---|---|
| Study Period | 2020-2034 |
| Base Year | 2025 |
| Estimated Year | 2026 |
| Forecast Period | 2026-2034 |
| Historical Period | 2020-2025 |
| Growth Rate | CAGR of 7% from 2020-2034 |
| Segmentation |
|
Table of Contents
- 1. Introduction
- 1.1. Research Scope
- 1.2. Market Segmentation
- 1.3. Research Objective
- 1.4. Definitions and Assumptions
- 2. Executive Summary
- 2.1. Market Snapshot
- 3. Market Dynamics
- 3.1. Market Drivers
- 3.2. Market Restrains
- 3.3. Market Trends
- 3.4. Market Opportunities
- 4. Market Factor Analysis
- 4.1. Porters Five Forces
- 4.1.1. Bargaining Power of Suppliers
- 4.1.2. Bargaining Power of Buyers
- 4.1.3. Threat of New Entrants
- 4.1.4. Threat of Substitutes
- 4.1.5. Competitive Rivalry
- 4.2. PESTEL analysis
- 4.3. BCG Analysis
- 4.3.1. Stars (High Growth, High Market Share)
- 4.3.2. Cash Cows (Low Growth, High Market Share)
- 4.3.3. Question Mark (High Growth, Low Market Share)
- 4.3.4. Dogs (Low Growth, Low Market Share)
- 4.4. Ansoff Matrix Analysis
- 4.5. Supply Chain Analysis
- 4.6. Regulatory Landscape
- 4.7. Current Market Potential and Opportunity Assessment (TAM–SAM–SOM Framework)
- 4.8. PRI Analyst Note
- 4.1. Porters Five Forces
- 5. Market Analysis, Insights and Forecast 2021-2033
- 5.1. Market Analysis, Insights and Forecast - by Product Type
- 5.1.1. Functional Food
- 5.1.2. Dietary Supplements
- 5.1.3. Infant Nutrition
- 5.1.4. Pet Food and Feed
- 5.1.5. Pharmaceutical
- 5.1.6. Clinical Nutrition
- 5.2. Market Analysis, Insights and Forecast - by Distribution Channel
- 5.2.1. Grocery Retailers
- 5.2.2. Pharmacies
- 5.2.3. Health Stores
- 5.2.4. Internet Retailing
- 5.2.5. Other Distribution Channels
- 5.3. Market Analysis, Insights and Forecast - by Region
- 5.3.1. North America
- 5.3.2. South America
- 5.3.3. Europe
- 5.3.4. Middle East & Africa
- 5.3.5. Asia Pacific
- 5.1. Market Analysis, Insights and Forecast - by Product Type
- 6. Global EU Omega-3 Market Analysis, Insights and Forecast, 2021-2033
- 6.1. Market Analysis, Insights and Forecast - by Product Type
- 6.1.1. Functional Food
- 6.1.2. Dietary Supplements
- 6.1.3. Infant Nutrition
- 6.1.4. Pet Food and Feed
- 6.1.5. Pharmaceutical
- 6.1.6. Clinical Nutrition
- 6.2. Market Analysis, Insights and Forecast - by Distribution Channel
- 6.2.1. Grocery Retailers
- 6.2.2. Pharmacies
- 6.2.3. Health Stores
- 6.2.4. Internet Retailing
- 6.2.5. Other Distribution Channels
- 6.1. Market Analysis, Insights and Forecast - by Product Type
- 7. North America EU Omega-3 Market Analysis, Insights and Forecast, 2020-2032
- 7.1. Market Analysis, Insights and Forecast - by Product Type
- 7.1.1. Functional Food
- 7.1.2. Dietary Supplements
- 7.1.3. Infant Nutrition
- 7.1.4. Pet Food and Feed
- 7.1.5. Pharmaceutical
- 7.1.6. Clinical Nutrition
- 7.2. Market Analysis, Insights and Forecast - by Distribution Channel
- 7.2.1. Grocery Retailers
- 7.2.2. Pharmacies
- 7.2.3. Health Stores
- 7.2.4. Internet Retailing
- 7.2.5. Other Distribution Channels
- 7.1. Market Analysis, Insights and Forecast - by Product Type
- 8. South America EU Omega-3 Market Analysis, Insights and Forecast, 2020-2032
- 8.1. Market Analysis, Insights and Forecast - by Product Type
- 8.1.1. Functional Food
- 8.1.2. Dietary Supplements
- 8.1.3. Infant Nutrition
- 8.1.4. Pet Food and Feed
- 8.1.5. Pharmaceutical
- 8.1.6. Clinical Nutrition
- 8.2. Market Analysis, Insights and Forecast - by Distribution Channel
- 8.2.1. Grocery Retailers
- 8.2.2. Pharmacies
- 8.2.3. Health Stores
- 8.2.4. Internet Retailing
- 8.2.5. Other Distribution Channels
- 8.1. Market Analysis, Insights and Forecast - by Product Type
- 9. Europe EU Omega-3 Market Analysis, Insights and Forecast, 2020-2032
- 9.1. Market Analysis, Insights and Forecast - by Product Type
- 9.1.1. Functional Food
- 9.1.2. Dietary Supplements
- 9.1.3. Infant Nutrition
- 9.1.4. Pet Food and Feed
- 9.1.5. Pharmaceutical
- 9.1.6. Clinical Nutrition
- 9.2. Market Analysis, Insights and Forecast - by Distribution Channel
- 9.2.1. Grocery Retailers
- 9.2.2. Pharmacies
- 9.2.3. Health Stores
- 9.2.4. Internet Retailing
- 9.2.5. Other Distribution Channels
- 9.1. Market Analysis, Insights and Forecast - by Product Type
- 10. Middle East & Africa EU Omega-3 Market Analysis, Insights and Forecast, 2020-2032
- 10.1. Market Analysis, Insights and Forecast - by Product Type
- 10.1.1. Functional Food
- 10.1.2. Dietary Supplements
- 10.1.3. Infant Nutrition
- 10.1.4. Pet Food and Feed
- 10.1.5. Pharmaceutical
- 10.1.6. Clinical Nutrition
- 10.2. Market Analysis, Insights and Forecast - by Distribution Channel
- 10.2.1. Grocery Retailers
- 10.2.2. Pharmacies
- 10.2.3. Health Stores
- 10.2.4. Internet Retailing
- 10.2.5. Other Distribution Channels
- 10.1. Market Analysis, Insights and Forecast - by Product Type
- 11. Asia Pacific EU Omega-3 Market Analysis, Insights and Forecast, 2020-2032
- 11.1. Market Analysis, Insights and Forecast - by Product Type
- 11.1.1. Functional Food
- 11.1.2. Dietary Supplements
- 11.1.3. Infant Nutrition
- 11.1.4. Pet Food and Feed
- 11.1.5. Pharmaceutical
- 11.1.6. Clinical Nutrition
- 11.2. Market Analysis, Insights and Forecast - by Distribution Channel
- 11.2.1. Grocery Retailers
- 11.2.2. Pharmacies
- 11.2.3. Health Stores
- 11.2.4. Internet Retailing
- 11.2.5. Other Distribution Channels
- 11.1. Market Analysis, Insights and Forecast - by Product Type
- 12. Competitive Analysis
- 12.1. Company Profiles
- 12.1.1 Sanofi SA
- 12.1.1.1. Company Overview
- 12.1.1.2. Products
- 12.1.1.3. Company Financials
- 12.1.1.4. SWOT Analysis
- 12.1.2 Reckitt Benckiser Group PLC
- 12.1.2.1. Company Overview
- 12.1.2.2. Products
- 12.1.2.3. Company Financials
- 12.1.2.4. SWOT Analysis
- 12.1.3 Nestle SA
- 12.1.3.1. Company Overview
- 12.1.3.2. Products
- 12.1.3.3. Company Financials
- 12.1.3.4. SWOT Analysis
- 12.1.4 Herbalife International of America Inc
- 12.1.4.1. Company Overview
- 12.1.4.2. Products
- 12.1.4.3. Company Financials
- 12.1.4.4. SWOT Analysis
- 12.1.5 Amway Corporation
- 12.1.5.1. Company Overview
- 12.1.5.2. Products
- 12.1.5.3. Company Financials
- 12.1.5.4. SWOT Analysis
- 12.1.6 Procter and Gamble Company
- 12.1.6.1. Company Overview
- 12.1.6.2. Products
- 12.1.6.3. Company Financials
- 12.1.6.4. SWOT Analysis
- 12.1.7 Anpario Plc
- 12.1.7.1. Company Overview
- 12.1.7.2. Products
- 12.1.7.3. Company Financials
- 12.1.7.4. SWOT Analysis
- 12.1.8 Unilever Plc
- 12.1.8.1. Company Overview
- 12.1.8.2. Products
- 12.1.8.3. Company Financials
- 12.1.8.4. SWOT Analysis
- 12.1.9 Royal DSM
- 12.1.9.1. Company Overview
- 12.1.9.2. Products
- 12.1.9.3. Company Financials
- 12.1.9.4. SWOT Analysis
- 12.1.10 Archer Daniels Midland Company
- 12.1.10.1. Company Overview
- 12.1.10.2. Products
- 12.1.10.3. Company Financials
- 12.1.10.4. SWOT Analysis
- 12.1.1 Sanofi SA
- 12.2. Market Entropy
- 12.2.1 Company's Key Areas Served
- 12.2.2 Recent Developments
- 12.3. Company Market Share Analysis 2025
- 12.3.1 Top 5 Companies Market Share Analysis
- 12.3.2 Top 3 Companies Market Share Analysis
- 12.4. List of Potential Customers
- 13. Research Methodology
List of Figures
- Figure 1: Global EU Omega-3 Market Revenue Breakdown (billion, %) by Region 2025 & 2033
- Figure 2: North America EU Omega-3 Market Revenue (billion), by Product Type 2025 & 2033
- Figure 3: North America EU Omega-3 Market Revenue Share (%), by Product Type 2025 & 2033
- Figure 4: North America EU Omega-3 Market Revenue (billion), by Distribution Channel 2025 & 2033
- Figure 5: North America EU Omega-3 Market Revenue Share (%), by Distribution Channel 2025 & 2033
- Figure 6: North America EU Omega-3 Market Revenue (billion), by Country 2025 & 2033
- Figure 7: North America EU Omega-3 Market Revenue Share (%), by Country 2025 & 2033
- Figure 8: South America EU Omega-3 Market Revenue (billion), by Product Type 2025 & 2033
- Figure 9: South America EU Omega-3 Market Revenue Share (%), by Product Type 2025 & 2033
- Figure 10: South America EU Omega-3 Market Revenue (billion), by Distribution Channel 2025 & 2033
- Figure 11: South America EU Omega-3 Market Revenue Share (%), by Distribution Channel 2025 & 2033
- Figure 12: South America EU Omega-3 Market Revenue (billion), by Country 2025 & 2033
- Figure 13: South America EU Omega-3 Market Revenue Share (%), by Country 2025 & 2033
- Figure 14: Europe EU Omega-3 Market Revenue (billion), by Product Type 2025 & 2033
- Figure 15: Europe EU Omega-3 Market Revenue Share (%), by Product Type 2025 & 2033
- Figure 16: Europe EU Omega-3 Market Revenue (billion), by Distribution Channel 2025 & 2033
- Figure 17: Europe EU Omega-3 Market Revenue Share (%), by Distribution Channel 2025 & 2033
- Figure 18: Europe EU Omega-3 Market Revenue (billion), by Country 2025 & 2033
- Figure 19: Europe EU Omega-3 Market Revenue Share (%), by Country 2025 & 2033
- Figure 20: Middle East & Africa EU Omega-3 Market Revenue (billion), by Product Type 2025 & 2033
- Figure 21: Middle East & Africa EU Omega-3 Market Revenue Share (%), by Product Type 2025 & 2033
- Figure 22: Middle East & Africa EU Omega-3 Market Revenue (billion), by Distribution Channel 2025 & 2033
- Figure 23: Middle East & Africa EU Omega-3 Market Revenue Share (%), by Distribution Channel 2025 & 2033
- Figure 24: Middle East & Africa EU Omega-3 Market Revenue (billion), by Country 2025 & 2033
- Figure 25: Middle East & Africa EU Omega-3 Market Revenue Share (%), by Country 2025 & 2033
- Figure 26: Asia Pacific EU Omega-3 Market Revenue (billion), by Product Type 2025 & 2033
- Figure 27: Asia Pacific EU Omega-3 Market Revenue Share (%), by Product Type 2025 & 2033
- Figure 28: Asia Pacific EU Omega-3 Market Revenue (billion), by Distribution Channel 2025 & 2033
- Figure 29: Asia Pacific EU Omega-3 Market Revenue Share (%), by Distribution Channel 2025 & 2033
- Figure 30: Asia Pacific EU Omega-3 Market Revenue (billion), by Country 2025 & 2033
- Figure 31: Asia Pacific EU Omega-3 Market Revenue Share (%), by Country 2025 & 2033
List of Tables
- Table 1: Global EU Omega-3 Market Revenue billion Forecast, by Product Type 2020 & 2033
- Table 2: Global EU Omega-3 Market Revenue billion Forecast, by Distribution Channel 2020 & 2033
- Table 3: Global EU Omega-3 Market Revenue billion Forecast, by Region 2020 & 2033
- Table 4: Global EU Omega-3 Market Revenue billion Forecast, by Product Type 2020 & 2033
- Table 5: Global EU Omega-3 Market Revenue billion Forecast, by Distribution Channel 2020 & 2033
- Table 6: Global EU Omega-3 Market Revenue billion Forecast, by Country 2020 & 2033
- Table 7: United States EU Omega-3 Market Revenue (billion) Forecast, by Application 2020 & 2033
- Table 8: Canada EU Omega-3 Market Revenue (billion) Forecast, by Application 2020 & 2033
- Table 9: Mexico EU Omega-3 Market Revenue (billion) Forecast, by Application 2020 & 2033
- Table 10: Global EU Omega-3 Market Revenue billion Forecast, by Product Type 2020 & 2033
- Table 11: Global EU Omega-3 Market Revenue billion Forecast, by Distribution Channel 2020 & 2033
- Table 12: Global EU Omega-3 Market Revenue billion Forecast, by Country 2020 & 2033
- Table 13: Brazil EU Omega-3 Market Revenue (billion) Forecast, by Application 2020 & 2033
- Table 14: Argentina EU Omega-3 Market Revenue (billion) Forecast, by Application 2020 & 2033
- Table 15: Rest of South America EU Omega-3 Market Revenue (billion) Forecast, by Application 2020 & 2033
- Table 16: Global EU Omega-3 Market Revenue billion Forecast, by Product Type 2020 & 2033
- Table 17: Global EU Omega-3 Market Revenue billion Forecast, by Distribution Channel 2020 & 2033
- Table 18: Global EU Omega-3 Market Revenue billion Forecast, by Country 2020 & 2033
- Table 19: United Kingdom EU Omega-3 Market Revenue (billion) Forecast, by Application 2020 & 2033
- Table 20: Germany EU Omega-3 Market Revenue (billion) Forecast, by Application 2020 & 2033
- Table 21: France EU Omega-3 Market Revenue (billion) Forecast, by Application 2020 & 2033
- Table 22: Italy EU Omega-3 Market Revenue (billion) Forecast, by Application 2020 & 2033
- Table 23: Spain EU Omega-3 Market Revenue (billion) Forecast, by Application 2020 & 2033
- Table 24: Russia EU Omega-3 Market Revenue (billion) Forecast, by Application 2020 & 2033
- Table 25: Benelux EU Omega-3 Market Revenue (billion) Forecast, by Application 2020 & 2033
- Table 26: Nordics EU Omega-3 Market Revenue (billion) Forecast, by Application 2020 & 2033
- Table 27: Rest of Europe EU Omega-3 Market Revenue (billion) Forecast, by Application 2020 & 2033
- Table 28: Global EU Omega-3 Market Revenue billion Forecast, by Product Type 2020 & 2033
- Table 29: Global EU Omega-3 Market Revenue billion Forecast, by Distribution Channel 2020 & 2033
- Table 30: Global EU Omega-3 Market Revenue billion Forecast, by Country 2020 & 2033
- Table 31: Turkey EU Omega-3 Market Revenue (billion) Forecast, by Application 2020 & 2033
- Table 32: Israel EU Omega-3 Market Revenue (billion) Forecast, by Application 2020 & 2033
- Table 33: GCC EU Omega-3 Market Revenue (billion) Forecast, by Application 2020 & 2033
- Table 34: North Africa EU Omega-3 Market Revenue (billion) Forecast, by Application 2020 & 2033
- Table 35: South Africa EU Omega-3 Market Revenue (billion) Forecast, by Application 2020 & 2033
- Table 36: Rest of Middle East & Africa EU Omega-3 Market Revenue (billion) Forecast, by Application 2020 & 2033
- Table 37: Global EU Omega-3 Market Revenue billion Forecast, by Product Type 2020 & 2033
- Table 38: Global EU Omega-3 Market Revenue billion Forecast, by Distribution Channel 2020 & 2033
- Table 39: Global EU Omega-3 Market Revenue billion Forecast, by Country 2020 & 2033
- Table 40: China EU Omega-3 Market Revenue (billion) Forecast, by Application 2020 & 2033
- Table 41: India EU Omega-3 Market Revenue (billion) Forecast, by Application 2020 & 2033
- Table 42: Japan EU Omega-3 Market Revenue (billion) Forecast, by Application 2020 & 2033
- Table 43: South Korea EU Omega-3 Market Revenue (billion) Forecast, by Application 2020 & 2033
- Table 44: ASEAN EU Omega-3 Market Revenue (billion) Forecast, by Application 2020 & 2033
- Table 45: Oceania EU Omega-3 Market Revenue (billion) Forecast, by Application 2020 & 2033
- Table 46: Rest of Asia Pacific EU Omega-3 Market Revenue (billion) Forecast, by Application 2020 & 2033
Frequently Asked Questions
1. What is the projected Compound Annual Growth Rate (CAGR) of the EU Omega-3 Market?
The projected CAGR is approximately 7%.
2. Which companies are prominent players in the EU Omega-3 Market?
Key companies in the market include Sanofi SA, Reckitt Benckiser Group PLC, Nestle SA, Herbalife International of America Inc, Amway Corporation, Procter and Gamble Company, Anpario Plc, Unilever Plc, Royal DSM, Archer Daniels Midland Company.
3. What are the main segments of the EU Omega-3 Market?
The market segments include Product Type, Distribution Channel.
4. Can you provide details about the market size?
The market size is estimated to be USD 3.59 billion as of 2022.
5. What are some drivers contributing to market growth?
Increasing Sports Participation; Increasing Awareness about Health and Fitness.
6. What are the notable trends driving market growth?
Health Benefits Associated with Omega-3 Consumption.
7. Are there any restraints impacting market growth?
Adverse Effects of Over consumption of Products.
8. Can you provide examples of recent developments in the market?
September 2022: Inspired Pet Nutrition launched Harrington's Wet Puppy Food. The product is available in chicken flavor. The product is made with salmon oil as a source of omega-3. The product is available in the United Kingdom.
9. What pricing options are available for accessing the report?
Pricing options include single-user, multi-user, and enterprise licenses priced at USD 4750, USD 5250, and USD 8750 respectively.
10. Is the market size provided in terms of value or volume?
The market size is provided in terms of value, measured in billion.
11. Are there any specific market keywords associated with the report?
Yes, the market keyword associated with the report is "EU Omega-3 Market," which aids in identifying and referencing the specific market segment covered.
12. How do I determine which pricing option suits my needs best?
The pricing options vary based on user requirements and access needs. Individual users may opt for single-user licenses, while businesses requiring broader access may choose multi-user or enterprise licenses for cost-effective access to the report.
13. Are there any additional resources or data provided in the EU Omega-3 Market report?
While the report offers comprehensive insights, it's advisable to review the specific contents or supplementary materials provided to ascertain if additional resources or data are available.
14. How can I stay updated on further developments or reports in the EU Omega-3 Market?
To stay informed about further developments, trends, and reports in the EU Omega-3 Market, consider subscribing to industry newsletters, following relevant companies and organizations, or regularly checking reputable industry news sources and publications.
Methodology
Step 1 - Identification of Relevant Samples Size from Population Database


Step 2 - Approaches for Defining Global Market Size (Value, Volume* & Price*)

Note*: In applicable scenarios
Step 3 - Data Sources
Primary Research
- Web Analytics
- Survey Reports
- Research Institute
- Latest Research Reports
- Opinion Leaders
Secondary Research
- Annual Reports
- White Paper
- Latest Press Release
- Industry Association
- Paid Database
- Investor Presentations

Step 4 - Data Triangulation
Involves using different sources of information in order to increase the validity of a study
These sources are likely to be stakeholders in a program - participants, other researchers, program staff, other community members, and so on.
Then we put all data in single framework & apply various statistical tools to find out the dynamic on the market.
During the analysis stage, feedback from the stakeholder groups would be compared to determine areas of agreement as well as areas of divergence