
Key Insights
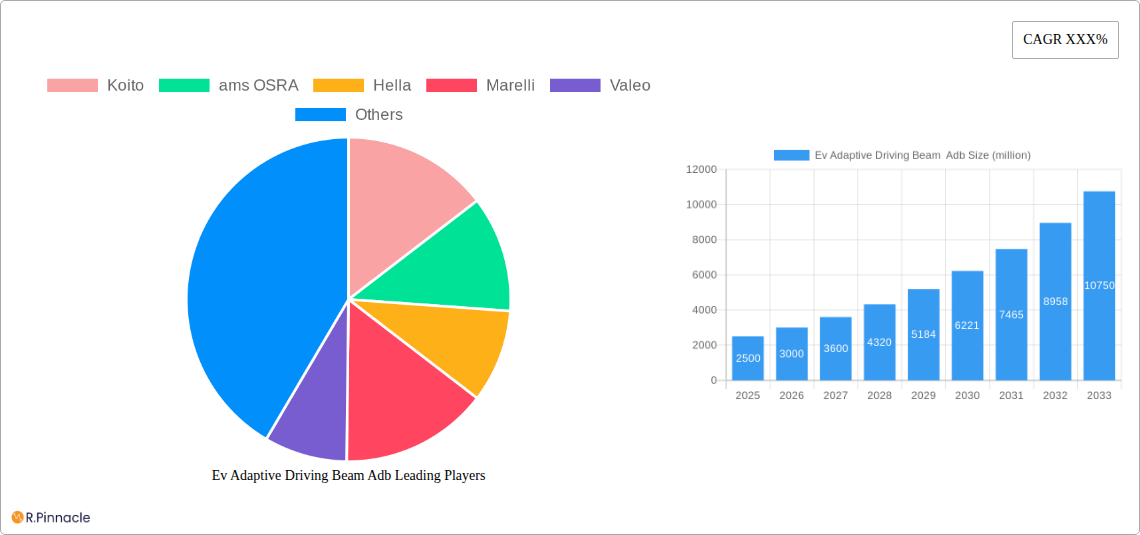
The global EV Adaptive Driving Beam (ADB) market is experiencing robust growth, driven by the increasing adoption of electric vehicles (EVs) and stringent safety regulations worldwide. The market's expansion is fueled by the technological advancements in ADB systems, offering enhanced visibility and safety features compared to conventional lighting systems. These advancements include improved sensor technology, sophisticated light control algorithms, and the integration of high-resolution cameras and LiDAR for precise beam shaping. The market is segmented based on vehicle type (passenger cars, commercial vehicles), technology (LED, laser), and geographic region. Key players like Koito, ams OSRAM, Hella, and others are investing heavily in R&D to develop innovative ADB systems that meet the evolving demands of the automotive industry. The rising demand for advanced driver-assistance systems (ADAS) and autonomous driving capabilities further boosts the market’s prospects. While initial costs remain a barrier to widespread adoption, decreasing production costs and government incentives are expected to accelerate market penetration.
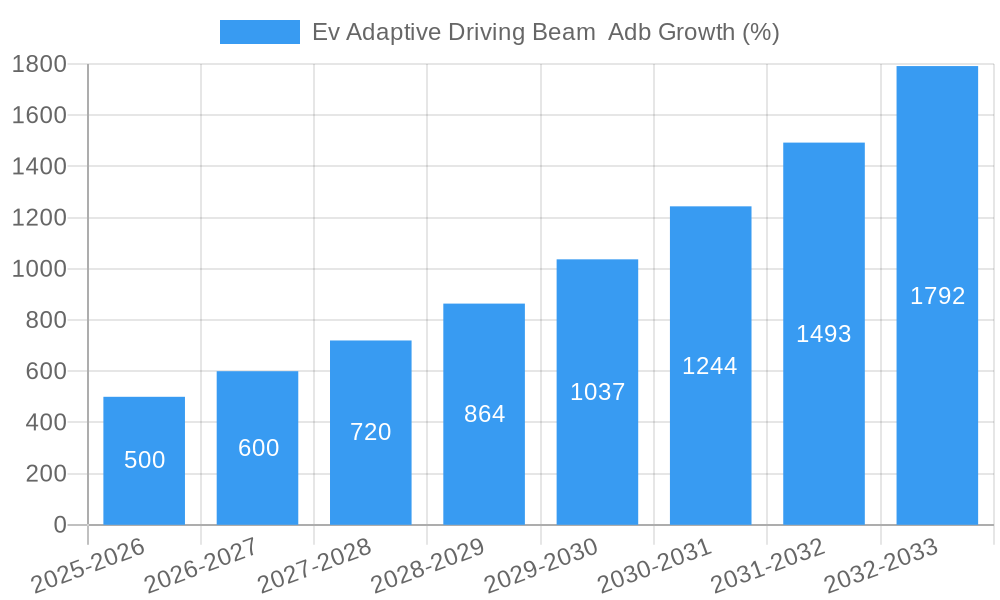
The forecast period (2025-2033) anticipates a substantial increase in market value, propelled by the escalating demand for safer and more efficient lighting solutions in EVs. The competitive landscape is characterized by a mix of established automotive lighting suppliers and emerging technology companies. Strategic partnerships, mergers, and acquisitions are common strategies used to expand market share and enhance technological capabilities. Regulatory pressures for enhanced vehicle safety and fuel efficiency regulations are also instrumental in driving the adoption of EV ADB systems. Regional variations in market growth will be influenced by factors such as infrastructure development, government policies, and consumer preferences. North America and Europe are expected to dominate the market initially, followed by a gradual rise in adoption in Asia-Pacific and other emerging markets.
EV Adaptive Driving Beam (ADB) Market Report: 2019-2033
This comprehensive report provides an in-depth analysis of the global EV Adaptive Driving Beam (ADB) market, offering invaluable insights for industry professionals, investors, and strategic decision-makers. Covering the period from 2019 to 2033, with a base year of 2025 and a forecast period from 2025 to 2033, this report meticulously examines market dynamics, technological advancements, and competitive landscapes. The report projects a xx million market value by 2033, indicating substantial growth opportunities.
EV Adaptive Driving Beam ADB Market Structure & Innovation Trends
This section analyzes the market concentration, highlighting the competitive landscape and market share distribution among key players. The report explores innovation drivers, including advancements in LED technology, software algorithms, and sensor integration. Regulatory frameworks impacting ADB adoption are also discussed, along with an examination of product substitutes and their market impact. The analysis incorporates end-user demographics, focusing on the evolving needs of EV consumers. Finally, the section details significant mergers and acquisitions (M&A) activities in the industry, including deal values (where available).
- Market Share: Koito holds an estimated xx% market share in 2025, followed by Valeo at xx% and Hella at xx%. Other significant players include Magna, Marelli, and Stanley.
- M&A Activity: The report details xx million worth of M&A activity between 2019 and 2024, primarily driven by strategic alliances and technology acquisitions. xx major deals are analyzed in detail.
- Innovation Drivers: Advancements in sensor technology, AI-powered software, and miniaturization of components are key drivers.
- Regulatory Landscape: The report covers the evolving global regulations surrounding ADB technology and their impact on market growth.
EV Adaptive Driving Beam ADB Market Dynamics & Trends
This section delves into the key factors influencing market growth. The analysis covers market growth drivers, including the rising adoption of EVs and increasing demand for enhanced safety features. It examines technological disruptions, such as the emergence of LiDAR integration and improved camera systems. Consumer preferences for advanced driver-assistance systems (ADAS) are also explored, alongside an in-depth competitive analysis, including pricing strategies, product differentiation, and market positioning of major players. The report projects a Compound Annual Growth Rate (CAGR) of xx% during the forecast period (2025-2033), with market penetration reaching xx% by 2033.
Dominant Regions & Segments in EV Adaptive Driving Beam ADB
This section identifies the leading regions and segments within the EV ADB market. The report provides a detailed analysis of the factors contributing to the dominance of specific regions, including economic policies promoting EV adoption, robust infrastructure development, and high consumer demand. Specific countries within these leading regions are highlighted.
- Key Drivers for Leading Region (e.g., North America):
- Strong government support for EV adoption and ADAS technologies.
- Well-developed automotive manufacturing infrastructure.
- High consumer disposable income and preference for advanced safety features.
Detailed analysis follows focusing on the factors driving regional dominance. Similarly, segment-level dominance, such as premium vs. mass-market vehicles, is analysed in detail within the report.
EV Adaptive Driving Beam ADB Product Innovations
This section summarizes recent product developments, highlighting key innovations, applications, and competitive advantages. It emphasizes the technological advancements driving market expansion and the successful integration of ADB technology into various EV models. The report underscores how these innovations improve safety and driving experience, leading to increased consumer demand.
Report Scope & Segmentation Analysis
The report segments the EV ADB market by various factors, including vehicle type (passenger cars, commercial vehicles), technology (LED, laser), and region (North America, Europe, Asia-Pacific, etc.). Each segment's growth projections, market size (in millions), and competitive dynamics are meticulously analyzed.
Key Drivers of EV Adaptive Driving Beam ADB Growth
The growth of the EV ADB market is propelled by several key factors: technological advancements leading to improved performance and reduced costs; favorable government regulations and incentives promoting ADAS adoption; and the rising consumer demand for enhanced safety features and advanced driver-assistance technologies. The increasing adoption of EVs further fuels this growth.
Challenges in the EV Adaptive Driving Beam ADB Sector
The EV ADB market faces several challenges, including high initial costs, the complexity of integrating ADB systems into vehicles, potential supply chain disruptions impacting component availability, and ongoing competition among manufacturers. Regulatory hurdles in certain regions could also hinder market expansion. These challenges are quantified and their impact assessed.
Emerging Opportunities in EV Adaptive Driving Beam ADB
Emerging opportunities include the growing adoption of autonomous driving technologies, expansion into new markets, and the development of more cost-effective ADB systems. The integration of ADB with other ADAS features and the potential for software-defined lighting also presents significant opportunities.
Leading Players in the EV Adaptive Driving Beam ADB Market
- Koito
- ams OSRAM
- Hella
- Marelli
- Valeo
- Stanley
- Hyundai Mobis
- Magna
- Varroc
- FLEX-N-GATE
- ZKW Group
- SL corporation
- Xingyu Automotive Lighting Systems
- HASCO Vision Technology
- Ledman Optoelectronic
Key Developments in EV Adaptive Driving Beam ADB Industry
- 2022 Q4: Koito launched a new generation of ADB systems with improved performance and reduced energy consumption.
- 2023 Q1: A strategic partnership was formed between Valeo and a sensor technology company to enhance ADB capabilities. (Further developments with specific years and months will be included in the full report.)
Future Outlook for EV Adaptive Driving Beam ADB Market
The future of the EV ADB market is promising. Continued technological advancements, rising consumer demand, and supportive government policies will fuel significant growth. Strategic partnerships and investments in R&D will further enhance the capabilities of ADB systems, leading to increased market penetration and revenue generation in the coming years. The market is poised for significant expansion, driven by advancements in artificial intelligence, sensor fusion, and improved software algorithms.
Ev Adaptive Driving Beam Adb Segmentation
-
1. Application
- 1.1. BEV
- 1.2. PHEV
-
2. Type
- 2.1. FAS-Cam
- 2.2. HCM
- 2.3. LDM
- 2.4. Others
Ev Adaptive Driving Beam Adb Segmentation By Geography
-
1. North America
- 1.1. United States
- 1.2. Canada
- 1.3. Mexico
-
2. South America
- 2.1. Brazil
- 2.2. Argentina
- 2.3. Rest of South America
-
3. Europe
- 3.1. United Kingdom
- 3.2. Germany
- 3.3. France
- 3.4. Italy
- 3.5. Spain
- 3.6. Russia
- 3.7. Benelux
- 3.8. Nordics
- 3.9. Rest of Europe
-
4. Middle East & Africa
- 4.1. Turkey
- 4.2. Israel
- 4.3. GCC
- 4.4. North Africa
- 4.5. South Africa
- 4.6. Rest of Middle East & Africa
-
5. Asia Pacific
- 5.1. China
- 5.2. India
- 5.3. Japan
- 5.4. South Korea
- 5.5. ASEAN
- 5.6. Oceania
- 5.7. Rest of Asia Pacific

Ev Adaptive Driving Beam Adb REPORT HIGHLIGHTS
| Aspects | Details |
|---|---|
| Study Period | 2019-2033 |
| Base Year | 2024 |
| Estimated Year | 2025 |
| Forecast Period | 2025-2033 |
| Historical Period | 2019-2024 |
| Growth Rate | CAGR of XXX% from 2019-2033 |
| Segmentation |
|
Table of Contents
- 1. Introduction
- 1.1. Research Scope
- 1.2. Market Segmentation
- 1.3. Research Methodology
- 1.4. Definitions and Assumptions
- 2. Executive Summary
- 2.1. Introduction
- 3. Market Dynamics
- 3.1. Introduction
- 3.2. Market Drivers
- 3.3. Market Restrains
- 3.4. Market Trends
- 4. Market Factor Analysis
- 4.1. Porters Five Forces
- 4.2. Supply/Value Chain
- 4.3. PESTEL analysis
- 4.4. Market Entropy
- 4.5. Patent/Trademark Analysis
- 5. Global Ev Adaptive Driving Beam Adb Analysis, Insights and Forecast, 2019-2031
- 5.1. Market Analysis, Insights and Forecast - by Application
- 5.1.1. BEV
- 5.1.2. PHEV
- 5.2. Market Analysis, Insights and Forecast - by Type
- 5.2.1. FAS-Cam
- 5.2.2. HCM
- 5.2.3. LDM
- 5.2.4. Others
- 5.3. Market Analysis, Insights and Forecast - by Region
- 5.3.1. North America
- 5.3.2. South America
- 5.3.3. Europe
- 5.3.4. Middle East & Africa
- 5.3.5. Asia Pacific
- 5.1. Market Analysis, Insights and Forecast - by Application
- 6. North America Ev Adaptive Driving Beam Adb Analysis, Insights and Forecast, 2019-2031
- 6.1. Market Analysis, Insights and Forecast - by Application
- 6.1.1. BEV
- 6.1.2. PHEV
- 6.2. Market Analysis, Insights and Forecast - by Type
- 6.2.1. FAS-Cam
- 6.2.2. HCM
- 6.2.3. LDM
- 6.2.4. Others
- 6.1. Market Analysis, Insights and Forecast - by Application
- 7. South America Ev Adaptive Driving Beam Adb Analysis, Insights and Forecast, 2019-2031
- 7.1. Market Analysis, Insights and Forecast - by Application
- 7.1.1. BEV
- 7.1.2. PHEV
- 7.2. Market Analysis, Insights and Forecast - by Type
- 7.2.1. FAS-Cam
- 7.2.2. HCM
- 7.2.3. LDM
- 7.2.4. Others
- 7.1. Market Analysis, Insights and Forecast - by Application
- 8. Europe Ev Adaptive Driving Beam Adb Analysis, Insights and Forecast, 2019-2031
- 8.1. Market Analysis, Insights and Forecast - by Application
- 8.1.1. BEV
- 8.1.2. PHEV
- 8.2. Market Analysis, Insights and Forecast - by Type
- 8.2.1. FAS-Cam
- 8.2.2. HCM
- 8.2.3. LDM
- 8.2.4. Others
- 8.1. Market Analysis, Insights and Forecast - by Application
- 9. Middle East & Africa Ev Adaptive Driving Beam Adb Analysis, Insights and Forecast, 2019-2031
- 9.1. Market Analysis, Insights and Forecast - by Application
- 9.1.1. BEV
- 9.1.2. PHEV
- 9.2. Market Analysis, Insights and Forecast - by Type
- 9.2.1. FAS-Cam
- 9.2.2. HCM
- 9.2.3. LDM
- 9.2.4. Others
- 9.1. Market Analysis, Insights and Forecast - by Application
- 10. Asia Pacific Ev Adaptive Driving Beam Adb Analysis, Insights and Forecast, 2019-2031
- 10.1. Market Analysis, Insights and Forecast - by Application
- 10.1.1. BEV
- 10.1.2. PHEV
- 10.2. Market Analysis, Insights and Forecast - by Type
- 10.2.1. FAS-Cam
- 10.2.2. HCM
- 10.2.3. LDM
- 10.2.4. Others
- 10.1. Market Analysis, Insights and Forecast - by Application
- 11. Competitive Analysis
- 11.1. Global Market Share Analysis 2024
- 11.2. Company Profiles
- 11.2.1 Koito
- 11.2.1.1. Overview
- 11.2.1.2. Products
- 11.2.1.3. SWOT Analysis
- 11.2.1.4. Recent Developments
- 11.2.1.5. Financials (Based on Availability)
- 11.2.2 ams OSRA
- 11.2.2.1. Overview
- 11.2.2.2. Products
- 11.2.2.3. SWOT Analysis
- 11.2.2.4. Recent Developments
- 11.2.2.5. Financials (Based on Availability)
- 11.2.3 Hella
- 11.2.3.1. Overview
- 11.2.3.2. Products
- 11.2.3.3. SWOT Analysis
- 11.2.3.4. Recent Developments
- 11.2.3.5. Financials (Based on Availability)
- 11.2.4 Marelli
- 11.2.4.1. Overview
- 11.2.4.2. Products
- 11.2.4.3. SWOT Analysis
- 11.2.4.4. Recent Developments
- 11.2.4.5. Financials (Based on Availability)
- 11.2.5 Valeo
- 11.2.5.1. Overview
- 11.2.5.2. Products
- 11.2.5.3. SWOT Analysis
- 11.2.5.4. Recent Developments
- 11.2.5.5. Financials (Based on Availability)
- 11.2.6 Stanley
- 11.2.6.1. Overview
- 11.2.6.2. Products
- 11.2.6.3. SWOT Analysis
- 11.2.6.4. Recent Developments
- 11.2.6.5. Financials (Based on Availability)
- 11.2.7 Hyundai Mobis
- 11.2.7.1. Overview
- 11.2.7.2. Products
- 11.2.7.3. SWOT Analysis
- 11.2.7.4. Recent Developments
- 11.2.7.5. Financials (Based on Availability)
- 11.2.8 Magna
- 11.2.8.1. Overview
- 11.2.8.2. Products
- 11.2.8.3. SWOT Analysis
- 11.2.8.4. Recent Developments
- 11.2.8.5. Financials (Based on Availability)
- 11.2.9 Varroc
- 11.2.9.1. Overview
- 11.2.9.2. Products
- 11.2.9.3. SWOT Analysis
- 11.2.9.4. Recent Developments
- 11.2.9.5. Financials (Based on Availability)
- 11.2.10 FLEX-N-GATE
- 11.2.10.1. Overview
- 11.2.10.2. Products
- 11.2.10.3. SWOT Analysis
- 11.2.10.4. Recent Developments
- 11.2.10.5. Financials (Based on Availability)
- 11.2.11 ZKW Group
- 11.2.11.1. Overview
- 11.2.11.2. Products
- 11.2.11.3. SWOT Analysis
- 11.2.11.4. Recent Developments
- 11.2.11.5. Financials (Based on Availability)
- 11.2.12 SL corporation
- 11.2.12.1. Overview
- 11.2.12.2. Products
- 11.2.12.3. SWOT Analysis
- 11.2.12.4. Recent Developments
- 11.2.12.5. Financials (Based on Availability)
- 11.2.13 Xingyu Automotive Lighting Systems
- 11.2.13.1. Overview
- 11.2.13.2. Products
- 11.2.13.3. SWOT Analysis
- 11.2.13.4. Recent Developments
- 11.2.13.5. Financials (Based on Availability)
- 11.2.14 HASCO Vision Technology
- 11.2.14.1. Overview
- 11.2.14.2. Products
- 11.2.14.3. SWOT Analysis
- 11.2.14.4. Recent Developments
- 11.2.14.5. Financials (Based on Availability)
- 11.2.15 Ledman Optoelectroni
- 11.2.15.1. Overview
- 11.2.15.2. Products
- 11.2.15.3. SWOT Analysis
- 11.2.15.4. Recent Developments
- 11.2.15.5. Financials (Based on Availability)
- 11.2.1 Koito
List of Figures
- Figure 1: Global Ev Adaptive Driving Beam Adb Revenue Breakdown (million, %) by Region 2024 & 2032
- Figure 2: North America Ev Adaptive Driving Beam Adb Revenue (million), by Application 2024 & 2032
- Figure 3: North America Ev Adaptive Driving Beam Adb Revenue Share (%), by Application 2024 & 2032
- Figure 4: North America Ev Adaptive Driving Beam Adb Revenue (million), by Type 2024 & 2032
- Figure 5: North America Ev Adaptive Driving Beam Adb Revenue Share (%), by Type 2024 & 2032
- Figure 6: North America Ev Adaptive Driving Beam Adb Revenue (million), by Country 2024 & 2032
- Figure 7: North America Ev Adaptive Driving Beam Adb Revenue Share (%), by Country 2024 & 2032
- Figure 8: South America Ev Adaptive Driving Beam Adb Revenue (million), by Application 2024 & 2032
- Figure 9: South America Ev Adaptive Driving Beam Adb Revenue Share (%), by Application 2024 & 2032
- Figure 10: South America Ev Adaptive Driving Beam Adb Revenue (million), by Type 2024 & 2032
- Figure 11: South America Ev Adaptive Driving Beam Adb Revenue Share (%), by Type 2024 & 2032
- Figure 12: South America Ev Adaptive Driving Beam Adb Revenue (million), by Country 2024 & 2032
- Figure 13: South America Ev Adaptive Driving Beam Adb Revenue Share (%), by Country 2024 & 2032
- Figure 14: Europe Ev Adaptive Driving Beam Adb Revenue (million), by Application 2024 & 2032
- Figure 15: Europe Ev Adaptive Driving Beam Adb Revenue Share (%), by Application 2024 & 2032
- Figure 16: Europe Ev Adaptive Driving Beam Adb Revenue (million), by Type 2024 & 2032
- Figure 17: Europe Ev Adaptive Driving Beam Adb Revenue Share (%), by Type 2024 & 2032
- Figure 18: Europe Ev Adaptive Driving Beam Adb Revenue (million), by Country 2024 & 2032
- Figure 19: Europe Ev Adaptive Driving Beam Adb Revenue Share (%), by Country 2024 & 2032
- Figure 20: Middle East & Africa Ev Adaptive Driving Beam Adb Revenue (million), by Application 2024 & 2032
- Figure 21: Middle East & Africa Ev Adaptive Driving Beam Adb Revenue Share (%), by Application 2024 & 2032
- Figure 22: Middle East & Africa Ev Adaptive Driving Beam Adb Revenue (million), by Type 2024 & 2032
- Figure 23: Middle East & Africa Ev Adaptive Driving Beam Adb Revenue Share (%), by Type 2024 & 2032
- Figure 24: Middle East & Africa Ev Adaptive Driving Beam Adb Revenue (million), by Country 2024 & 2032
- Figure 25: Middle East & Africa Ev Adaptive Driving Beam Adb Revenue Share (%), by Country 2024 & 2032
- Figure 26: Asia Pacific Ev Adaptive Driving Beam Adb Revenue (million), by Application 2024 & 2032
- Figure 27: Asia Pacific Ev Adaptive Driving Beam Adb Revenue Share (%), by Application 2024 & 2032
- Figure 28: Asia Pacific Ev Adaptive Driving Beam Adb Revenue (million), by Type 2024 & 2032
- Figure 29: Asia Pacific Ev Adaptive Driving Beam Adb Revenue Share (%), by Type 2024 & 2032
- Figure 30: Asia Pacific Ev Adaptive Driving Beam Adb Revenue (million), by Country 2024 & 2032
- Figure 31: Asia Pacific Ev Adaptive Driving Beam Adb Revenue Share (%), by Country 2024 & 2032
List of Tables
- Table 1: Global Ev Adaptive Driving Beam Adb Revenue million Forecast, by Region 2019 & 2032
- Table 2: Global Ev Adaptive Driving Beam Adb Revenue million Forecast, by Application 2019 & 2032
- Table 3: Global Ev Adaptive Driving Beam Adb Revenue million Forecast, by Type 2019 & 2032
- Table 4: Global Ev Adaptive Driving Beam Adb Revenue million Forecast, by Region 2019 & 2032
- Table 5: Global Ev Adaptive Driving Beam Adb Revenue million Forecast, by Application 2019 & 2032
- Table 6: Global Ev Adaptive Driving Beam Adb Revenue million Forecast, by Type 2019 & 2032
- Table 7: Global Ev Adaptive Driving Beam Adb Revenue million Forecast, by Country 2019 & 2032
- Table 8: United States Ev Adaptive Driving Beam Adb Revenue (million) Forecast, by Application 2019 & 2032
- Table 9: Canada Ev Adaptive Driving Beam Adb Revenue (million) Forecast, by Application 2019 & 2032
- Table 10: Mexico Ev Adaptive Driving Beam Adb Revenue (million) Forecast, by Application 2019 & 2032
- Table 11: Global Ev Adaptive Driving Beam Adb Revenue million Forecast, by Application 2019 & 2032
- Table 12: Global Ev Adaptive Driving Beam Adb Revenue million Forecast, by Type 2019 & 2032
- Table 13: Global Ev Adaptive Driving Beam Adb Revenue million Forecast, by Country 2019 & 2032
- Table 14: Brazil Ev Adaptive Driving Beam Adb Revenue (million) Forecast, by Application 2019 & 2032
- Table 15: Argentina Ev Adaptive Driving Beam Adb Revenue (million) Forecast, by Application 2019 & 2032
- Table 16: Rest of South America Ev Adaptive Driving Beam Adb Revenue (million) Forecast, by Application 2019 & 2032
- Table 17: Global Ev Adaptive Driving Beam Adb Revenue million Forecast, by Application 2019 & 2032
- Table 18: Global Ev Adaptive Driving Beam Adb Revenue million Forecast, by Type 2019 & 2032
- Table 19: Global Ev Adaptive Driving Beam Adb Revenue million Forecast, by Country 2019 & 2032
- Table 20: United Kingdom Ev Adaptive Driving Beam Adb Revenue (million) Forecast, by Application 2019 & 2032
- Table 21: Germany Ev Adaptive Driving Beam Adb Revenue (million) Forecast, by Application 2019 & 2032
- Table 22: France Ev Adaptive Driving Beam Adb Revenue (million) Forecast, by Application 2019 & 2032
- Table 23: Italy Ev Adaptive Driving Beam Adb Revenue (million) Forecast, by Application 2019 & 2032
- Table 24: Spain Ev Adaptive Driving Beam Adb Revenue (million) Forecast, by Application 2019 & 2032
- Table 25: Russia Ev Adaptive Driving Beam Adb Revenue (million) Forecast, by Application 2019 & 2032
- Table 26: Benelux Ev Adaptive Driving Beam Adb Revenue (million) Forecast, by Application 2019 & 2032
- Table 27: Nordics Ev Adaptive Driving Beam Adb Revenue (million) Forecast, by Application 2019 & 2032
- Table 28: Rest of Europe Ev Adaptive Driving Beam Adb Revenue (million) Forecast, by Application 2019 & 2032
- Table 29: Global Ev Adaptive Driving Beam Adb Revenue million Forecast, by Application 2019 & 2032
- Table 30: Global Ev Adaptive Driving Beam Adb Revenue million Forecast, by Type 2019 & 2032
- Table 31: Global Ev Adaptive Driving Beam Adb Revenue million Forecast, by Country 2019 & 2032
- Table 32: Turkey Ev Adaptive Driving Beam Adb Revenue (million) Forecast, by Application 2019 & 2032
- Table 33: Israel Ev Adaptive Driving Beam Adb Revenue (million) Forecast, by Application 2019 & 2032
- Table 34: GCC Ev Adaptive Driving Beam Adb Revenue (million) Forecast, by Application 2019 & 2032
- Table 35: North Africa Ev Adaptive Driving Beam Adb Revenue (million) Forecast, by Application 2019 & 2032
- Table 36: South Africa Ev Adaptive Driving Beam Adb Revenue (million) Forecast, by Application 2019 & 2032
- Table 37: Rest of Middle East & Africa Ev Adaptive Driving Beam Adb Revenue (million) Forecast, by Application 2019 & 2032
- Table 38: Global Ev Adaptive Driving Beam Adb Revenue million Forecast, by Application 2019 & 2032
- Table 39: Global Ev Adaptive Driving Beam Adb Revenue million Forecast, by Type 2019 & 2032
- Table 40: Global Ev Adaptive Driving Beam Adb Revenue million Forecast, by Country 2019 & 2032
- Table 41: China Ev Adaptive Driving Beam Adb Revenue (million) Forecast, by Application 2019 & 2032
- Table 42: India Ev Adaptive Driving Beam Adb Revenue (million) Forecast, by Application 2019 & 2032
- Table 43: Japan Ev Adaptive Driving Beam Adb Revenue (million) Forecast, by Application 2019 & 2032
- Table 44: South Korea Ev Adaptive Driving Beam Adb Revenue (million) Forecast, by Application 2019 & 2032
- Table 45: ASEAN Ev Adaptive Driving Beam Adb Revenue (million) Forecast, by Application 2019 & 2032
- Table 46: Oceania Ev Adaptive Driving Beam Adb Revenue (million) Forecast, by Application 2019 & 2032
- Table 47: Rest of Asia Pacific Ev Adaptive Driving Beam Adb Revenue (million) Forecast, by Application 2019 & 2032
Frequently Asked Questions
1. What is the projected Compound Annual Growth Rate (CAGR) of the Ev Adaptive Driving Beam Adb?
The projected CAGR is approximately XXX%.
2. Which companies are prominent players in the Ev Adaptive Driving Beam Adb?
Key companies in the market include Koito, ams OSRA, Hella, Marelli, Valeo, Stanley, Hyundai Mobis, Magna, Varroc, FLEX-N-GATE, ZKW Group, SL corporation, Xingyu Automotive Lighting Systems, HASCO Vision Technology, Ledman Optoelectroni.
3. What are the main segments of the Ev Adaptive Driving Beam Adb?
The market segments include Application, Type.
4. Can you provide details about the market size?
The market size is estimated to be USD XXX million as of 2022.
5. What are some drivers contributing to market growth?
N/A
6. What are the notable trends driving market growth?
N/A
7. Are there any restraints impacting market growth?
N/A
8. Can you provide examples of recent developments in the market?
N/A
9. What pricing options are available for accessing the report?
Pricing options include single-user, multi-user, and enterprise licenses priced at USD 4250.00, USD 6375.00, and USD 8500.00 respectively.
10. Is the market size provided in terms of value or volume?
The market size is provided in terms of value, measured in million.
11. Are there any specific market keywords associated with the report?
Yes, the market keyword associated with the report is "Ev Adaptive Driving Beam Adb," which aids in identifying and referencing the specific market segment covered.
12. How do I determine which pricing option suits my needs best?
The pricing options vary based on user requirements and access needs. Individual users may opt for single-user licenses, while businesses requiring broader access may choose multi-user or enterprise licenses for cost-effective access to the report.
13. Are there any additional resources or data provided in the Ev Adaptive Driving Beam Adb report?
While the report offers comprehensive insights, it's advisable to review the specific contents or supplementary materials provided to ascertain if additional resources or data are available.
14. How can I stay updated on further developments or reports in the Ev Adaptive Driving Beam Adb?
To stay informed about further developments, trends, and reports in the Ev Adaptive Driving Beam Adb, consider subscribing to industry newsletters, following relevant companies and organizations, or regularly checking reputable industry news sources and publications.
Methodology
Step 1 - Identification of Relevant Samples Size from Population Database


Step 2 - Approaches for Defining Global Market Size (Value, Volume* & Price*)

Note*: In applicable scenarios
Step 3 - Data Sources
Primary Research
- Web Analytics
- Survey Reports
- Research Institute
- Latest Research Reports
- Opinion Leaders
Secondary Research
- Annual Reports
- White Paper
- Latest Press Release
- Industry Association
- Paid Database
- Investor Presentations

Step 4 - Data Triangulation
Involves using different sources of information in order to increase the validity of a study
These sources are likely to be stakeholders in a program - participants, other researchers, program staff, other community members, and so on.
Then we put all data in single framework & apply various statistical tools to find out the dynamic on the market.
During the analysis stage, feedback from the stakeholder groups would be compared to determine areas of agreement as well as areas of divergence


