
Key Insights
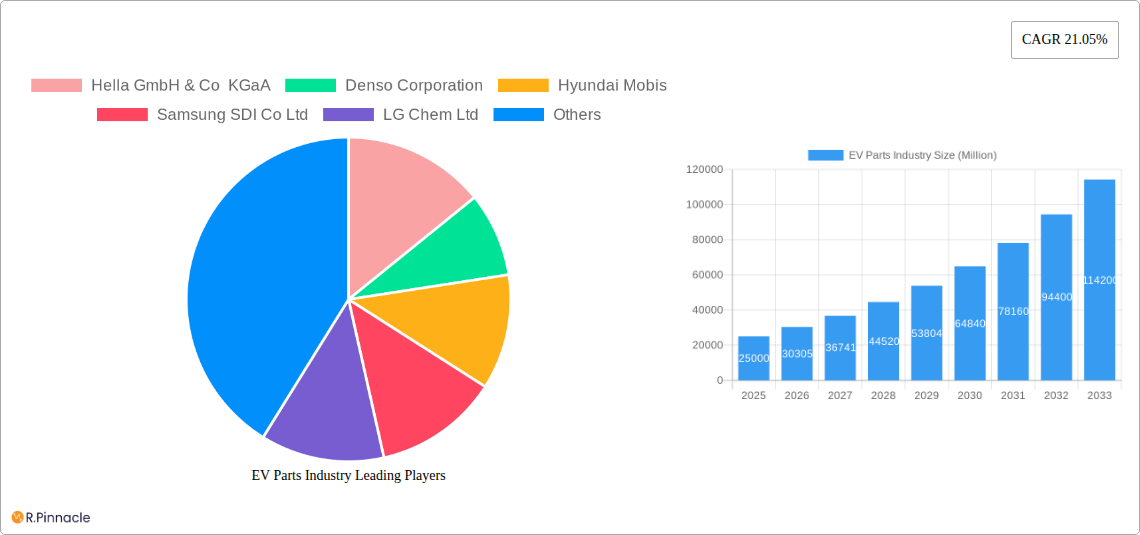
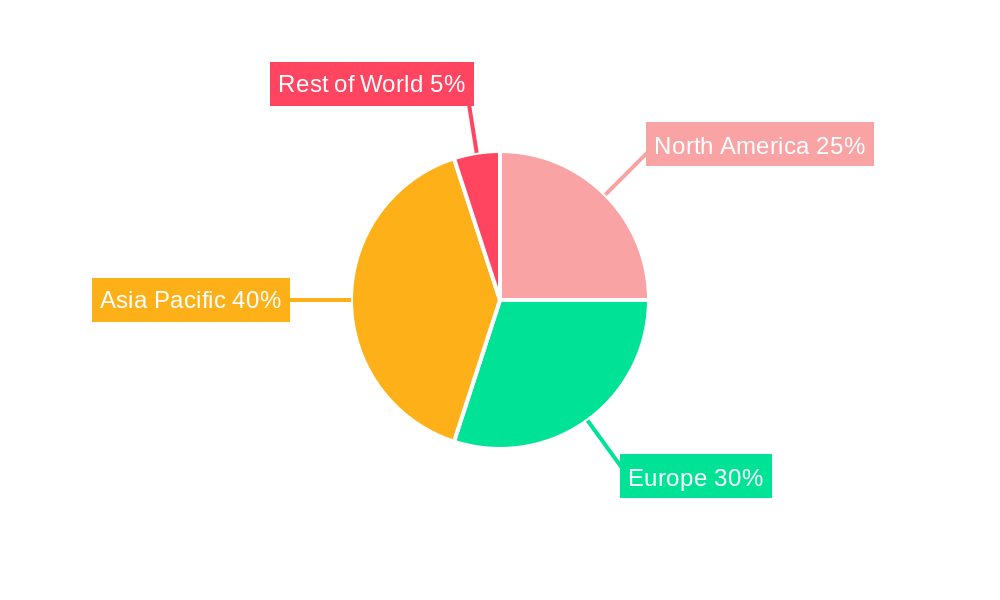
The Electric Vehicle (EV) parts market is experiencing explosive growth, fueled by the global transition to sustainable transportation. With a Compound Annual Growth Rate (CAGR) of 21.05% from 2019 to 2024, and a projected continuation of this strong growth trajectory through 2033, the market presents significant opportunities for manufacturers and investors. Key drivers include increasingly stringent emission regulations worldwide, growing consumer demand for eco-friendly vehicles, and continuous advancements in battery technology leading to improved range and reduced charging times. The market is segmented by vehicle type (passenger cars and commercial vehicles), propulsion type (Battery Electric Vehicle, Plug-in Hybrid Vehicle, Fuel Cell Electric Vehicle, Hybrid Electric Vehicle), and component type (battery packs, DC-DC converters, controllers & inverters, motors, and other components). The dominance of battery packs within the component segment reflects the crucial role of energy storage in EV performance. Leading players like Tesla, although not explicitly listed, are major indirect contributors given their significant impact on market demand and technology evolution. Established automotive parts suppliers like Bosch, Denso, and Continental are actively expanding their EV component portfolios, indicating strong competition and continuous innovation within the sector. Geographical analysis reveals a strong concentration of market activity in regions with robust EV adoption rates such as North America, Europe, and particularly Asia-Pacific, driven largely by China and South Korea’s rapid growth.
The continued growth of the EV parts market hinges on several factors. Further advancements in battery technology are crucial to address range anxiety and reduce costs. Government incentives and supportive policies remain essential in accelerating EV adoption. The development of robust charging infrastructure is also vital to facilitate widespread EV use. Challenges remain, including the supply chain constraints affecting the availability of critical raw materials like lithium and cobalt, and the need for cost reductions to make EVs more accessible to a wider consumer base. However, the long-term outlook for the EV parts market remains exceptionally positive, driven by the increasing urgency of addressing climate change and the compelling economic and environmental benefits of electric vehicles. The market's growth will likely be uneven across segments and regions, with some sectors and geographical areas outperforming others based on specific government regulations and consumer preferences.
EV Parts Industry: A Comprehensive Market Report (2019-2033)
This in-depth report provides a comprehensive analysis of the global EV parts industry, projecting a market value exceeding $XX Million by 2033. It offers invaluable insights for industry professionals, investors, and strategists seeking to navigate the rapidly evolving landscape of electric vehicle technology. The report covers the period from 2019 to 2033, with a base year of 2025 and a forecast period of 2025-2033.
EV Parts Industry Market Structure & Innovation Trends
The EV parts market is characterized by a moderately concentrated structure, with key players such as Hella GmbH & Co KGaA, Denso Corporation, Hyundai Mobis, Samsung SDI Co Ltd, LG Chem Ltd, Contemporary Amperex Technology Co Ltd, Toyota Industries Corporation, Continental AG, BorgWarner Inc, Robert Bosch GmbH, Hitachi Ltd, and Panasonic Corporation holding significant market share. However, the emergence of numerous smaller, specialized companies is also driving innovation.
- Market Share: The top 10 players account for approximately 60% of the global market, with the remaining share distributed among numerous smaller players.
- Innovation Drivers: Stringent emission regulations, growing consumer demand for eco-friendly vehicles, advancements in battery technology (e.g., solid-state batteries), and government incentives are key innovation drivers.
- Regulatory Frameworks: Government policies promoting EV adoption, including subsidies, tax breaks, and emission standards, are significantly influencing market growth.
- Product Substitutes: Internal combustion engine (ICE) vehicles remain a significant substitute, but their market share is declining due to the increasing competitiveness of EVs.
- End-User Demographics: The primary end-users are passenger car and commercial vehicle manufacturers, with a growing focus on the development of autonomous and connected vehicles.
- M&A Activities: The EV parts industry has witnessed significant M&A activity in recent years, with deal values exceeding $XX Million annually. These activities aim to enhance technological capabilities, expand market reach, and secure access to critical resources.

EV Parts Industry Market Dynamics & Trends
The EV parts market is experiencing robust growth, driven by the global shift towards electric mobility. The compound annual growth rate (CAGR) is projected to be XX% during the forecast period (2025-2033). Several factors contribute to this growth:
- Technological Disruptions: Continuous advancements in battery technology, power electronics, and electric motors are improving the performance and affordability of EVs.
- Consumer Preferences: Increasing environmental awareness and concerns about air pollution are driving consumer demand for electric vehicles.
- Competitive Dynamics: Intense competition among EV manufacturers and parts suppliers is leading to rapid innovation and cost reductions.
- Market Penetration: The market penetration rate for EVs is increasing rapidly in several regions, particularly in Europe and China, leading to significant demand for EV parts.
The market is further segmented by vehicle type (passenger cars and commercial vehicles) and propulsion type (Battery Electric Vehicle (BEV), Plug-in Hybrid Electric Vehicle (PHEV), Fuel Cell Electric Vehicle (FCEV), and Hybrid Electric Vehicle (HEV)).
Dominant Regions & Segments in EV Parts Industry
China currently holds the largest market share in the EV parts industry, driven by significant government support, a massive domestic market, and a robust manufacturing base. Europe and North America are also major markets, exhibiting strong growth potential.
- Key Drivers by Region:
- China: Government subsidies, strong domestic demand, and a large manufacturing base.
- Europe: Stringent emission regulations, supportive government policies, and high consumer acceptance of EVs.
- North America: Increasing consumer demand, investments in charging infrastructure, and government incentives.
- Dominant Segments:
- Vehicle Type: Passenger cars currently dominate the market, but the commercial vehicle segment is showing rapid growth.
- Propulsion Type: Battery Electric Vehicles (BEVs) are the fastest-growing segment, due to technological advancements and cost reductions. However, PHEVs and HEVs continue to have substantial market share.
- Component Type: Battery packs hold the largest share, followed by motors and controllers & inverters. The market for onboard chargers and other component types is also experiencing rapid growth.
EV Parts Industry Product Innovations
The EV parts industry is witnessing rapid technological advancements, including the development of high-energy-density batteries, more efficient power electronics, and advanced electric motors. These innovations are leading to improved vehicle range, performance, and affordability, making EVs increasingly competitive with ICE vehicles. Lightweight materials and improved thermal management systems are also key areas of focus.
Report Scope & Segmentation Analysis
This report provides a detailed segmentation of the EV parts market across various parameters:
- Vehicle Type: Passenger Cars and Commercial Vehicles, with projected growth rates and market sizes for each.
- Propulsion Type: BEV, PHEV, FCEV, and HEV, with an analysis of technological advancements, cost competitiveness, and market dynamics for each type.
- Component Type: Battery Packs, DC-DC Converters, Controller & Inverter, Motor, Other Component Types, and Onboard Charger, including market size projections and competitive landscapes for each component.
Key Drivers of EV Parts Industry Growth
Several key factors are driving the growth of the EV parts industry: Government regulations aimed at reducing carbon emissions, increasing consumer preference for eco-friendly vehicles, technological advancements leading to improved battery performance and reduced costs, and substantial investments in charging infrastructure and R&D by both governments and private companies are major contributors.
Challenges in the EV Parts Industry Sector
The EV parts industry faces challenges such as the high initial cost of EV batteries, potential supply chain disruptions affecting raw material availability, and intense competition among various market players. Concerns about battery life, charging infrastructure availability, and the fluctuating prices of raw materials also represent significant challenges. Addressing these issues is critical for the sustained growth of the industry.
Emerging Opportunities in EV Parts Industry
The EV parts industry presents significant opportunities for innovation and growth. The rising demand for autonomous vehicles, the development of solid-state batteries and other next-generation technologies, and the expansion of charging infrastructure in new markets offer immense potential. The increasing focus on sustainability and the circular economy is also creating new avenues for growth and innovation in the industry.
Leading Players in the EV Parts Industry Market
- Hella GmbH & Co KGaA
- Denso Corporation
- Hyundai Mobis
- Samsung SDI Co Ltd
- LG Chem Ltd
- Contemporary Amperex Technology Co Ltd
- Toyota Industries Corporation
- Continental AG
- BorgWarner Inc
- Robert Bosch GmbH
- Hitachi Ltd
- Panasonic Corporation
Key Developments in EV Parts Industry Industry
- January 2023: Robert Bosch Venture Capital GmbH invested in the formation of Beijing Kawen New Energy Vehicle Co., Ltd., focusing on battery electric and hydrogen-powered commercial vehicles and related components. This signifies a significant move towards expanding the hydrogen vehicle market segment and securing a foothold in the Chinese EV market.
- April 2022: Denso Corporation developed EV products for Toyota bZ4x and Subaru Solterra, including battery monitoring systems. This highlights the crucial role of advanced battery management systems in ensuring EV performance and safety.
- March 2022: Panasonic Corporation announced plans to potentially build a lithium-ion battery plant in the US to increase production for Tesla. This showcases the growing demand for EV batteries and the strategic investments required to meet this demand.
Future Outlook for EV Parts Industry Market
The EV parts industry is poised for continued strong growth, driven by factors such as increasing government regulations promoting EV adoption, technological advancements in battery technology and powertrain components, and expanding charging infrastructure. The development of new technologies, such as solid-state batteries and improved fast-charging capabilities, is also expected to further accelerate market growth. Strategic partnerships and collaborations among companies will likely play a critical role in shaping the future of this dynamic industry.
EV Parts Industry Segmentation
-
1. Vehicle Type
- 1.1. Passenger Cars
- 1.2. Commercial Vehicles
-
2. Propulsion Type
- 2.1. Battery Electric Vehicle
- 2.2. Plug-in Hybrid Vehicle
- 2.3. Fuel Cell Electric Vehicle
- 2.4. Hybrid Electric Vehicle
-
3. Component Type
- 3.1. Battery Packs
- 3.2. DC-DC Converters
- 3.3. Controller & Inverter
- 3.4. Motor
- 3.5. Other Component Types
- 3.6. Onboard Charger
EV Parts Industry Segmentation By Geography
-
1. North America
- 1.1. United States
- 1.2. Canada
- 1.3. Rest of North America
-
2. Europe
- 2.1. Germany
- 2.2. United Kingdom
- 2.3. France
- 2.4. Spain
- 2.5. Rest of Europe
-
3. Asia Pacific
- 3.1. China
- 3.2. India
- 3.3. Japan
- 3.4. South Korea
- 3.5. Rest of Asia Pacific
-
4. Rest of World
- 4.1. South America
- 4.2. Middle East and Africa
EV Parts Industry REPORT HIGHLIGHTS
| Aspects | Details |
|---|---|
| Study Period | 2019-2033 |
| Base Year | 2024 |
| Estimated Year | 2025 |
| Forecast Period | 2025-2033 |
| Historical Period | 2019-2024 |
| Growth Rate | CAGR of 21.05% from 2019-2033 |
| Segmentation |
|
Table of Contents
- 1. Introduction
- 1.1. Research Scope
- 1.2. Market Segmentation
- 1.3. Research Methodology
- 1.4. Definitions and Assumptions
- 2. Executive Summary
- 2.1. Introduction
- 3. Market Dynamics
- 3.1. Introduction
- 3.2. Market Drivers
- 3.2.1. Government Support and Regulations to Support EVs Adoption
- 3.3. Market Restrains
- 3.3.1. Infrastructure Limitations Can Restrict the Widespread Adoption
- 3.4. Market Trends
- 3.4.1. Increasing Investments in Electric Vehicles Driving the Market
- 4. Market Factor Analysis
- 4.1. Porters Five Forces
- 4.2. Supply/Value Chain
- 4.3. PESTEL analysis
- 4.4. Market Entropy
- 4.5. Patent/Trademark Analysis
- 5. Global EV Parts Industry Analysis, Insights and Forecast, 2019-2031
- 5.1. Market Analysis, Insights and Forecast - by Vehicle Type
- 5.1.1. Passenger Cars
- 5.1.2. Commercial Vehicles
- 5.2. Market Analysis, Insights and Forecast - by Propulsion Type
- 5.2.1. Battery Electric Vehicle
- 5.2.2. Plug-in Hybrid Vehicle
- 5.2.3. Fuel Cell Electric Vehicle
- 5.2.4. Hybrid Electric Vehicle
- 5.3. Market Analysis, Insights and Forecast - by Component Type
- 5.3.1. Battery Packs
- 5.3.2. DC-DC Converters
- 5.3.3. Controller & Inverter
- 5.3.4. Motor
- 5.3.5. Other Component Types
- 5.3.6. Onboard Charger
- 5.4. Market Analysis, Insights and Forecast - by Region
- 5.4.1. North America
- 5.4.2. Europe
- 5.4.3. Asia Pacific
- 5.4.4. Rest of World
- 5.1. Market Analysis, Insights and Forecast - by Vehicle Type
- 6. North America EV Parts Industry Analysis, Insights and Forecast, 2019-2031
- 6.1. Market Analysis, Insights and Forecast - by Vehicle Type
- 6.1.1. Passenger Cars
- 6.1.2. Commercial Vehicles
- 6.2. Market Analysis, Insights and Forecast - by Propulsion Type
- 6.2.1. Battery Electric Vehicle
- 6.2.2. Plug-in Hybrid Vehicle
- 6.2.3. Fuel Cell Electric Vehicle
- 6.2.4. Hybrid Electric Vehicle
- 6.3. Market Analysis, Insights and Forecast - by Component Type
- 6.3.1. Battery Packs
- 6.3.2. DC-DC Converters
- 6.3.3. Controller & Inverter
- 6.3.4. Motor
- 6.3.5. Other Component Types
- 6.3.6. Onboard Charger
- 6.1. Market Analysis, Insights and Forecast - by Vehicle Type
- 7. Europe EV Parts Industry Analysis, Insights and Forecast, 2019-2031
- 7.1. Market Analysis, Insights and Forecast - by Vehicle Type
- 7.1.1. Passenger Cars
- 7.1.2. Commercial Vehicles
- 7.2. Market Analysis, Insights and Forecast - by Propulsion Type
- 7.2.1. Battery Electric Vehicle
- 7.2.2. Plug-in Hybrid Vehicle
- 7.2.3. Fuel Cell Electric Vehicle
- 7.2.4. Hybrid Electric Vehicle
- 7.3. Market Analysis, Insights and Forecast - by Component Type
- 7.3.1. Battery Packs
- 7.3.2. DC-DC Converters
- 7.3.3. Controller & Inverter
- 7.3.4. Motor
- 7.3.5. Other Component Types
- 7.3.6. Onboard Charger
- 7.1. Market Analysis, Insights and Forecast - by Vehicle Type
- 8. Asia Pacific EV Parts Industry Analysis, Insights and Forecast, 2019-2031
- 8.1. Market Analysis, Insights and Forecast - by Vehicle Type
- 8.1.1. Passenger Cars
- 8.1.2. Commercial Vehicles
- 8.2. Market Analysis, Insights and Forecast - by Propulsion Type
- 8.2.1. Battery Electric Vehicle
- 8.2.2. Plug-in Hybrid Vehicle
- 8.2.3. Fuel Cell Electric Vehicle
- 8.2.4. Hybrid Electric Vehicle
- 8.3. Market Analysis, Insights and Forecast - by Component Type
- 8.3.1. Battery Packs
- 8.3.2. DC-DC Converters
- 8.3.3. Controller & Inverter
- 8.3.4. Motor
- 8.3.5. Other Component Types
- 8.3.6. Onboard Charger
- 8.1. Market Analysis, Insights and Forecast - by Vehicle Type
- 9. Rest of World EV Parts Industry Analysis, Insights and Forecast, 2019-2031
- 9.1. Market Analysis, Insights and Forecast - by Vehicle Type
- 9.1.1. Passenger Cars
- 9.1.2. Commercial Vehicles
- 9.2. Market Analysis, Insights and Forecast - by Propulsion Type
- 9.2.1. Battery Electric Vehicle
- 9.2.2. Plug-in Hybrid Vehicle
- 9.2.3. Fuel Cell Electric Vehicle
- 9.2.4. Hybrid Electric Vehicle
- 9.3. Market Analysis, Insights and Forecast - by Component Type
- 9.3.1. Battery Packs
- 9.3.2. DC-DC Converters
- 9.3.3. Controller & Inverter
- 9.3.4. Motor
- 9.3.5. Other Component Types
- 9.3.6. Onboard Charger
- 9.1. Market Analysis, Insights and Forecast - by Vehicle Type
- 10. North America EV Parts Industry Analysis, Insights and Forecast, 2019-2031
- 10.1. Market Analysis, Insights and Forecast - By Country/Sub-region
- 10.1.1 United States
- 10.1.2 Canada
- 10.1.3 Rest of North America
- 11. Europe EV Parts Industry Analysis, Insights and Forecast, 2019-2031
- 11.1. Market Analysis, Insights and Forecast - By Country/Sub-region
- 11.1.1 Germany
- 11.1.2 United Kingdom
- 11.1.3 France
- 11.1.4 Spain
- 11.1.5 Rest of Europe
- 12. Asia Pacific EV Parts Industry Analysis, Insights and Forecast, 2019-2031
- 12.1. Market Analysis, Insights and Forecast - By Country/Sub-region
- 12.1.1 China
- 12.1.2 India
- 12.1.3 Japan
- 12.1.4 South Korea
- 12.1.5 Rest of Asia Pacific
- 13. Rest of World EV Parts Industry Analysis, Insights and Forecast, 2019-2031
- 13.1. Market Analysis, Insights and Forecast - By Country/Sub-region
- 13.1.1 South America
- 13.1.2 Middle East and Africa
- 14. Competitive Analysis
- 14.1. Global Market Share Analysis 2024
- 14.2. Company Profiles
- 14.2.1 Hella GmbH & Co KGaA
- 14.2.1.1. Overview
- 14.2.1.2. Products
- 14.2.1.3. SWOT Analysis
- 14.2.1.4. Recent Developments
- 14.2.1.5. Financials (Based on Availability)
- 14.2.2 Denso Corporation
- 14.2.2.1. Overview
- 14.2.2.2. Products
- 14.2.2.3. SWOT Analysis
- 14.2.2.4. Recent Developments
- 14.2.2.5. Financials (Based on Availability)
- 14.2.3 Hyundai Mobis
- 14.2.3.1. Overview
- 14.2.3.2. Products
- 14.2.3.3. SWOT Analysis
- 14.2.3.4. Recent Developments
- 14.2.3.5. Financials (Based on Availability)
- 14.2.4 Samsung SDI Co Ltd
- 14.2.4.1. Overview
- 14.2.4.2. Products
- 14.2.4.3. SWOT Analysis
- 14.2.4.4. Recent Developments
- 14.2.4.5. Financials (Based on Availability)
- 14.2.5 LG Chem Ltd
- 14.2.5.1. Overview
- 14.2.5.2. Products
- 14.2.5.3. SWOT Analysis
- 14.2.5.4. Recent Developments
- 14.2.5.5. Financials (Based on Availability)
- 14.2.6 Contemporary Amperex Technology Co Ltd
- 14.2.6.1. Overview
- 14.2.6.2. Products
- 14.2.6.3. SWOT Analysis
- 14.2.6.4. Recent Developments
- 14.2.6.5. Financials (Based on Availability)
- 14.2.7 Toyota Industries Corporation
- 14.2.7.1. Overview
- 14.2.7.2. Products
- 14.2.7.3. SWOT Analysis
- 14.2.7.4. Recent Developments
- 14.2.7.5. Financials (Based on Availability)
- 14.2.8 Continental AG
- 14.2.8.1. Overview
- 14.2.8.2. Products
- 14.2.8.3. SWOT Analysis
- 14.2.8.4. Recent Developments
- 14.2.8.5. Financials (Based on Availability)
- 14.2.9 BorgWarner Inc
- 14.2.9.1. Overview
- 14.2.9.2. Products
- 14.2.9.3. SWOT Analysis
- 14.2.9.4. Recent Developments
- 14.2.9.5. Financials (Based on Availability)
- 14.2.10 Robert Bosch GmbH
- 14.2.10.1. Overview
- 14.2.10.2. Products
- 14.2.10.3. SWOT Analysis
- 14.2.10.4. Recent Developments
- 14.2.10.5. Financials (Based on Availability)
- 14.2.11 Hitachi Ltd*List Not Exhaustive
- 14.2.11.1. Overview
- 14.2.11.2. Products
- 14.2.11.3. SWOT Analysis
- 14.2.11.4. Recent Developments
- 14.2.11.5. Financials (Based on Availability)
- 14.2.12 Panasonic Corporation
- 14.2.12.1. Overview
- 14.2.12.2. Products
- 14.2.12.3. SWOT Analysis
- 14.2.12.4. Recent Developments
- 14.2.12.5. Financials (Based on Availability)
- 14.2.1 Hella GmbH & Co KGaA
List of Figures
- Figure 1: Global EV Parts Industry Revenue Breakdown (Million, %) by Region 2024 & 2032
- Figure 2: North America EV Parts Industry Revenue (Million), by Country 2024 & 2032
- Figure 3: North America EV Parts Industry Revenue Share (%), by Country 2024 & 2032
- Figure 4: Europe EV Parts Industry Revenue (Million), by Country 2024 & 2032
- Figure 5: Europe EV Parts Industry Revenue Share (%), by Country 2024 & 2032
- Figure 6: Asia Pacific EV Parts Industry Revenue (Million), by Country 2024 & 2032
- Figure 7: Asia Pacific EV Parts Industry Revenue Share (%), by Country 2024 & 2032
- Figure 8: Rest of World EV Parts Industry Revenue (Million), by Country 2024 & 2032
- Figure 9: Rest of World EV Parts Industry Revenue Share (%), by Country 2024 & 2032
- Figure 10: North America EV Parts Industry Revenue (Million), by Vehicle Type 2024 & 2032
- Figure 11: North America EV Parts Industry Revenue Share (%), by Vehicle Type 2024 & 2032
- Figure 12: North America EV Parts Industry Revenue (Million), by Propulsion Type 2024 & 2032
- Figure 13: North America EV Parts Industry Revenue Share (%), by Propulsion Type 2024 & 2032
- Figure 14: North America EV Parts Industry Revenue (Million), by Component Type 2024 & 2032
- Figure 15: North America EV Parts Industry Revenue Share (%), by Component Type 2024 & 2032
- Figure 16: North America EV Parts Industry Revenue (Million), by Country 2024 & 2032
- Figure 17: North America EV Parts Industry Revenue Share (%), by Country 2024 & 2032
- Figure 18: Europe EV Parts Industry Revenue (Million), by Vehicle Type 2024 & 2032
- Figure 19: Europe EV Parts Industry Revenue Share (%), by Vehicle Type 2024 & 2032
- Figure 20: Europe EV Parts Industry Revenue (Million), by Propulsion Type 2024 & 2032
- Figure 21: Europe EV Parts Industry Revenue Share (%), by Propulsion Type 2024 & 2032
- Figure 22: Europe EV Parts Industry Revenue (Million), by Component Type 2024 & 2032
- Figure 23: Europe EV Parts Industry Revenue Share (%), by Component Type 2024 & 2032
- Figure 24: Europe EV Parts Industry Revenue (Million), by Country 2024 & 2032
- Figure 25: Europe EV Parts Industry Revenue Share (%), by Country 2024 & 2032
- Figure 26: Asia Pacific EV Parts Industry Revenue (Million), by Vehicle Type 2024 & 2032
- Figure 27: Asia Pacific EV Parts Industry Revenue Share (%), by Vehicle Type 2024 & 2032
- Figure 28: Asia Pacific EV Parts Industry Revenue (Million), by Propulsion Type 2024 & 2032
- Figure 29: Asia Pacific EV Parts Industry Revenue Share (%), by Propulsion Type 2024 & 2032
- Figure 30: Asia Pacific EV Parts Industry Revenue (Million), by Component Type 2024 & 2032
- Figure 31: Asia Pacific EV Parts Industry Revenue Share (%), by Component Type 2024 & 2032
- Figure 32: Asia Pacific EV Parts Industry Revenue (Million), by Country 2024 & 2032
- Figure 33: Asia Pacific EV Parts Industry Revenue Share (%), by Country 2024 & 2032
- Figure 34: Rest of World EV Parts Industry Revenue (Million), by Vehicle Type 2024 & 2032
- Figure 35: Rest of World EV Parts Industry Revenue Share (%), by Vehicle Type 2024 & 2032
- Figure 36: Rest of World EV Parts Industry Revenue (Million), by Propulsion Type 2024 & 2032
- Figure 37: Rest of World EV Parts Industry Revenue Share (%), by Propulsion Type 2024 & 2032
- Figure 38: Rest of World EV Parts Industry Revenue (Million), by Component Type 2024 & 2032
- Figure 39: Rest of World EV Parts Industry Revenue Share (%), by Component Type 2024 & 2032
- Figure 40: Rest of World EV Parts Industry Revenue (Million), by Country 2024 & 2032
- Figure 41: Rest of World EV Parts Industry Revenue Share (%), by Country 2024 & 2032
List of Tables
- Table 1: Global EV Parts Industry Revenue Million Forecast, by Region 2019 & 2032
- Table 2: Global EV Parts Industry Revenue Million Forecast, by Vehicle Type 2019 & 2032
- Table 3: Global EV Parts Industry Revenue Million Forecast, by Propulsion Type 2019 & 2032
- Table 4: Global EV Parts Industry Revenue Million Forecast, by Component Type 2019 & 2032
- Table 5: Global EV Parts Industry Revenue Million Forecast, by Region 2019 & 2032
- Table 6: Global EV Parts Industry Revenue Million Forecast, by Country 2019 & 2032
- Table 7: United States EV Parts Industry Revenue (Million) Forecast, by Application 2019 & 2032
- Table 8: Canada EV Parts Industry Revenue (Million) Forecast, by Application 2019 & 2032
- Table 9: Rest of North America EV Parts Industry Revenue (Million) Forecast, by Application 2019 & 2032
- Table 10: Global EV Parts Industry Revenue Million Forecast, by Country 2019 & 2032
- Table 11: Germany EV Parts Industry Revenue (Million) Forecast, by Application 2019 & 2032
- Table 12: United Kingdom EV Parts Industry Revenue (Million) Forecast, by Application 2019 & 2032
- Table 13: France EV Parts Industry Revenue (Million) Forecast, by Application 2019 & 2032
- Table 14: Spain EV Parts Industry Revenue (Million) Forecast, by Application 2019 & 2032
- Table 15: Rest of Europe EV Parts Industry Revenue (Million) Forecast, by Application 2019 & 2032
- Table 16: Global EV Parts Industry Revenue Million Forecast, by Country 2019 & 2032
- Table 17: China EV Parts Industry Revenue (Million) Forecast, by Application 2019 & 2032
- Table 18: India EV Parts Industry Revenue (Million) Forecast, by Application 2019 & 2032
- Table 19: Japan EV Parts Industry Revenue (Million) Forecast, by Application 2019 & 2032
- Table 20: South Korea EV Parts Industry Revenue (Million) Forecast, by Application 2019 & 2032
- Table 21: Rest of Asia Pacific EV Parts Industry Revenue (Million) Forecast, by Application 2019 & 2032
- Table 22: Global EV Parts Industry Revenue Million Forecast, by Country 2019 & 2032
- Table 23: South America EV Parts Industry Revenue (Million) Forecast, by Application 2019 & 2032
- Table 24: Middle East and Africa EV Parts Industry Revenue (Million) Forecast, by Application 2019 & 2032
- Table 25: Global EV Parts Industry Revenue Million Forecast, by Vehicle Type 2019 & 2032
- Table 26: Global EV Parts Industry Revenue Million Forecast, by Propulsion Type 2019 & 2032
- Table 27: Global EV Parts Industry Revenue Million Forecast, by Component Type 2019 & 2032
- Table 28: Global EV Parts Industry Revenue Million Forecast, by Country 2019 & 2032
- Table 29: United States EV Parts Industry Revenue (Million) Forecast, by Application 2019 & 2032
- Table 30: Canada EV Parts Industry Revenue (Million) Forecast, by Application 2019 & 2032
- Table 31: Rest of North America EV Parts Industry Revenue (Million) Forecast, by Application 2019 & 2032
- Table 32: Global EV Parts Industry Revenue Million Forecast, by Vehicle Type 2019 & 2032
- Table 33: Global EV Parts Industry Revenue Million Forecast, by Propulsion Type 2019 & 2032
- Table 34: Global EV Parts Industry Revenue Million Forecast, by Component Type 2019 & 2032
- Table 35: Global EV Parts Industry Revenue Million Forecast, by Country 2019 & 2032
- Table 36: Germany EV Parts Industry Revenue (Million) Forecast, by Application 2019 & 2032
- Table 37: United Kingdom EV Parts Industry Revenue (Million) Forecast, by Application 2019 & 2032
- Table 38: France EV Parts Industry Revenue (Million) Forecast, by Application 2019 & 2032
- Table 39: Spain EV Parts Industry Revenue (Million) Forecast, by Application 2019 & 2032
- Table 40: Rest of Europe EV Parts Industry Revenue (Million) Forecast, by Application 2019 & 2032
- Table 41: Global EV Parts Industry Revenue Million Forecast, by Vehicle Type 2019 & 2032
- Table 42: Global EV Parts Industry Revenue Million Forecast, by Propulsion Type 2019 & 2032
- Table 43: Global EV Parts Industry Revenue Million Forecast, by Component Type 2019 & 2032
- Table 44: Global EV Parts Industry Revenue Million Forecast, by Country 2019 & 2032
- Table 45: China EV Parts Industry Revenue (Million) Forecast, by Application 2019 & 2032
- Table 46: India EV Parts Industry Revenue (Million) Forecast, by Application 2019 & 2032
- Table 47: Japan EV Parts Industry Revenue (Million) Forecast, by Application 2019 & 2032
- Table 48: South Korea EV Parts Industry Revenue (Million) Forecast, by Application 2019 & 2032
- Table 49: Rest of Asia Pacific EV Parts Industry Revenue (Million) Forecast, by Application 2019 & 2032
- Table 50: Global EV Parts Industry Revenue Million Forecast, by Vehicle Type 2019 & 2032
- Table 51: Global EV Parts Industry Revenue Million Forecast, by Propulsion Type 2019 & 2032
- Table 52: Global EV Parts Industry Revenue Million Forecast, by Component Type 2019 & 2032
- Table 53: Global EV Parts Industry Revenue Million Forecast, by Country 2019 & 2032
- Table 54: South America EV Parts Industry Revenue (Million) Forecast, by Application 2019 & 2032
- Table 55: Middle East and Africa EV Parts Industry Revenue (Million) Forecast, by Application 2019 & 2032
Frequently Asked Questions
1. What is the projected Compound Annual Growth Rate (CAGR) of the EV Parts Industry?
The projected CAGR is approximately 21.05%.
2. Which companies are prominent players in the EV Parts Industry?
Key companies in the market include Hella GmbH & Co KGaA, Denso Corporation, Hyundai Mobis, Samsung SDI Co Ltd, LG Chem Ltd, Contemporary Amperex Technology Co Ltd, Toyota Industries Corporation, Continental AG, BorgWarner Inc, Robert Bosch GmbH, Hitachi Ltd*List Not Exhaustive, Panasonic Corporation.
3. What are the main segments of the EV Parts Industry?
The market segments include Vehicle Type, Propulsion Type, Component Type.
4. Can you provide details about the market size?
The market size is estimated to be USD XX Million as of 2022.
5. What are some drivers contributing to market growth?
Government Support and Regulations to Support EVs Adoption.
6. What are the notable trends driving market growth?
Increasing Investments in Electric Vehicles Driving the Market.
7. Are there any restraints impacting market growth?
Infrastructure Limitations Can Restrict the Widespread Adoption.
8. Can you provide examples of recent developments in the market?
January 2023: Robert Bosch Venture Capital GmbH, a subsidiary of Bosch, announced that it invested in the formation of Beijing Kawen New Energy Vehicle Co., Ltd. with Boyuan Private Equity Capital Management Company Ltd., Beiqi Foton, Beijing SinoHytec Co., Ltd., and Shenzhen Fuyuan Smart Investment Partnership. Kawen Vehicle will concentrate on the research, development, manufacturing, and sale of battery electric vehicles, hydrogen-powered commercial vehicles, and related core components and systems.
9. What pricing options are available for accessing the report?
Pricing options include single-user, multi-user, and enterprise licenses priced at USD 4750, USD 5250, and USD 8750 respectively.
10. Is the market size provided in terms of value or volume?
The market size is provided in terms of value, measured in Million.
11. Are there any specific market keywords associated with the report?
Yes, the market keyword associated with the report is "EV Parts Industry," which aids in identifying and referencing the specific market segment covered.
12. How do I determine which pricing option suits my needs best?
The pricing options vary based on user requirements and access needs. Individual users may opt for single-user licenses, while businesses requiring broader access may choose multi-user or enterprise licenses for cost-effective access to the report.
13. Are there any additional resources or data provided in the EV Parts Industry report?
While the report offers comprehensive insights, it's advisable to review the specific contents or supplementary materials provided to ascertain if additional resources or data are available.
14. How can I stay updated on further developments or reports in the EV Parts Industry?
To stay informed about further developments, trends, and reports in the EV Parts Industry, consider subscribing to industry newsletters, following relevant companies and organizations, or regularly checking reputable industry news sources and publications.
Methodology
Step 1 - Identification of Relevant Samples Size from Population Database


Step 2 - Approaches for Defining Global Market Size (Value, Volume* & Price*)

Note*: In applicable scenarios
Step 3 - Data Sources
Primary Research
- Web Analytics
- Survey Reports
- Research Institute
- Latest Research Reports
- Opinion Leaders
Secondary Research
- Annual Reports
- White Paper
- Latest Press Release
- Industry Association
- Paid Database
- Investor Presentations

Step 4 - Data Triangulation
Involves using different sources of information in order to increase the validity of a study
These sources are likely to be stakeholders in a program - participants, other researchers, program staff, other community members, and so on.
Then we put all data in single framework & apply various statistical tools to find out the dynamic on the market.
During the analysis stage, feedback from the stakeholder groups would be compared to determine areas of agreement as well as areas of divergence


