

Key Insights
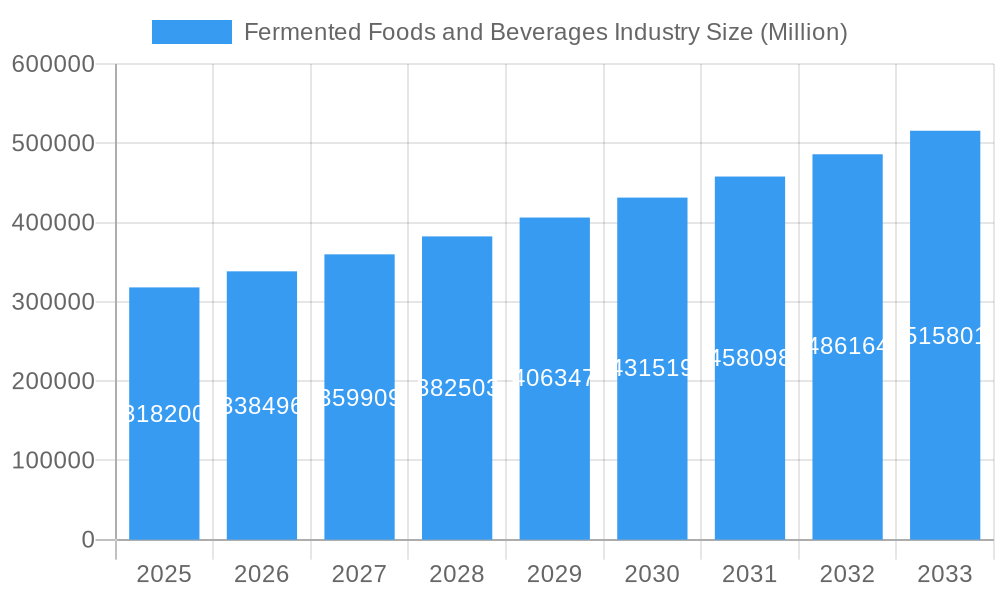
The global fermented foods and beverages market is poised for significant expansion, projected to reach USD 318.2 billion in 2025 and grow at a robust CAGR of 6.43% through 2033. This substantial growth is fueled by a growing consumer awareness of the health benefits associated with fermented products, particularly their positive impact on gut health and the immune system. The rising popularity of probiotics, prebiotics, and functional foods has directly translated into increased demand for diverse fermented offerings. Furthermore, the increasing adoption of these products in developing economies, driven by rising disposable incomes and a greater understanding of Western dietary trends, contributes significantly to market expansion.
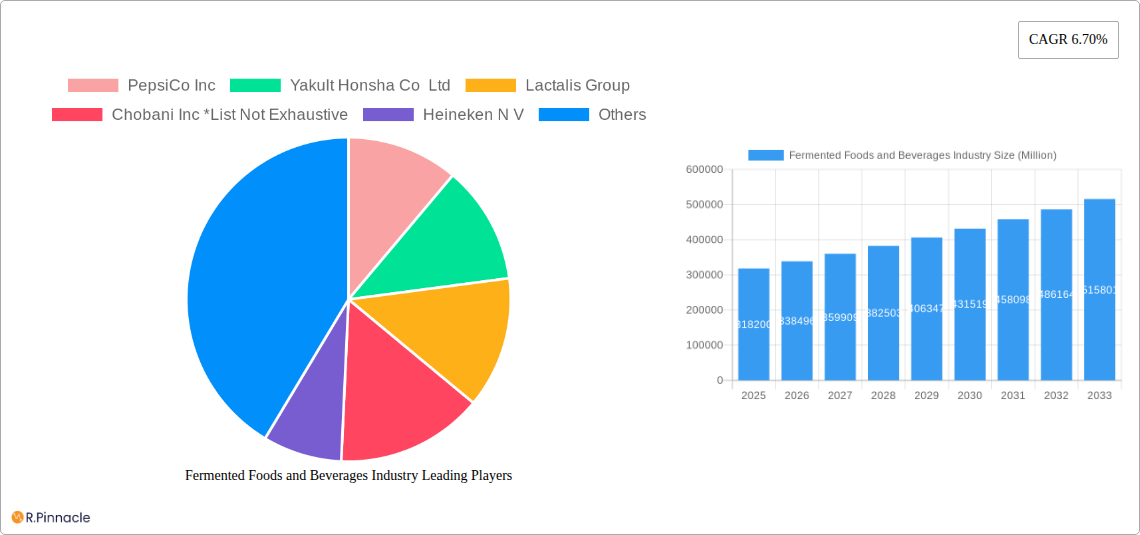
Fermented Foods and Beverages Industry Market Size (In Billion)
The market's segmentation reveals a dynamic landscape. Within the fermented food category, yogurt and yogurt drinks are leading the charge due to their widespread availability and perceived health benefits. Sauerkraut, pickles, and other fermented vegetables are gaining traction as consumers seek more natural and preservative-free food options. In the fermented beverages segment, kombucha and kefir have emerged as frontrunners, captivating health-conscious consumers with their unique flavors and probiotic content. Distribution channels are also evolving, with online retail stores witnessing remarkable growth alongside traditional supermarket and hypermarket channels, catering to the convenience-driven modern consumer. Key players like Danone, PepsiCo, and Nestle are actively investing in product innovation and market penetration to capitalize on these burgeoning trends.
Fermented Foods and Beverages Industry Company Market Share
Dive into the dynamic global Fermented Foods and Beverages Industry with this in-depth report, offering a comprehensive 14-year outlook from 2019 to 2033, with a base year and estimated year of 2025. This essential resource provides unparalleled insights for industry professionals seeking to navigate the rapidly evolving market. Explore market size, segmentation, growth drivers, challenges, and key player strategies, all underpinned by robust data and actionable intelligence. Understand the profound impact of probiotic-rich products and the growing consumer demand for gut health solutions.
Fermented Foods and Beverages Industry Market Structure & Innovation Trends
The Fermented Foods and Beverages Industry exhibits a moderately concentrated market structure, with a blend of large multinational corporations and agile niche players. Innovation is a primary driver, fueled by advancements in fermentation technologies, the discovery of novel probiotic strains, and the increasing consumer focus on health and wellness. Regulatory frameworks, particularly concerning health claims and food safety, play a significant role in shaping market entry and product development. The presence of numerous product substitutes, ranging from conventionally processed foods to functional supplements, necessitates continuous product differentiation. End-user demographics are broadening, with a growing adoption among younger and health-conscious populations across various income brackets. Mergers and acquisitions (M&A) activities are prevalent, with deal values in the billions, as larger entities seek to acquire innovative brands and expand their market reach. For instance, Nestlé's acquisition of Garden of Life highlights this trend. The market share distribution is dynamic, with leading companies constantly vying for dominance through strategic product launches and market penetration.
Fermented Foods and Beverages Industry Market Dynamics & Trends
The Fermented Foods and Beverages Industry is experiencing robust growth, propelled by a confluence of escalating consumer awareness regarding gut health and the scientifically validated benefits of probiotics. This trend is further amplified by a growing preference for natural and minimally processed foods, a segment where fermented products inherently excel. Technological advancements in fermentation processes, including precision fermentation and the development of novel starter cultures, are enhancing product quality, shelf-life, and nutritional profiles, contributing to market penetration. Consumer preferences are shifting towards a more holistic approach to health, with fermented foods and beverages being increasingly integrated into daily diets not just for their taste but for their perceived health-promoting properties, such as improved digestion and immune support. The competitive landscape is characterized by intense innovation, with companies like Danone, Nestlé, and PepsiCo investing heavily in research and development to launch new, differentiated products. The global CAGR for this sector is projected to be robust, driven by expanding distribution channels and increasing product availability worldwide.
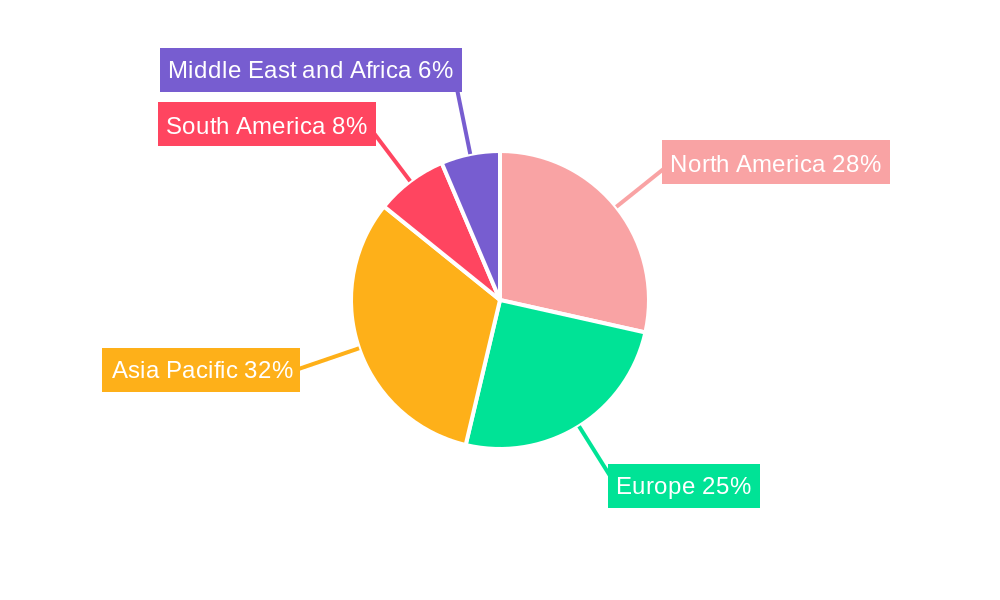
Dominant Regions & Segments in Fermented Foods and Beverages Industry
North America currently dominates the Fermented Foods and Beverages Industry, with the United States leading in market consumption and innovation. Key drivers for this dominance include high consumer disposable income, a strong awareness of health and wellness trends, and a well-established retail infrastructure supporting both traditional and online distribution. Asia Pacific is emerging as a significant growth region, fueled by increasing disposable incomes, a traditional affinity for fermented foods in many cultures, and a rapidly expanding middle class adopting Western dietary trends.
- Fermented Food Dominance:
- Yogurt: Holds the largest market share within fermented foods due to its widespread availability, diverse flavor profiles, and established consumer trust.
- Cheese: A traditional staple with significant market value, driven by its versatility and demand across various culinary applications.
- Other Fermented Food (e.g., Kimchi, Miso): Growing in popularity due to increasing global exposure to diverse cuisines and a rising interest in traditional, gut-healthy options.
- Fermented Beverage Dominance:
- Yogurt Drink/Smoothies: Leading segment due to convenience, portability, and the perceived health benefits associated with probiotics.
- Kombucha: Experiencing rapid growth driven by its perceived health benefits, unique flavor profile, and its positioning as a healthier alternative to sugary beverages.
- Kefir: Gaining traction for its rich probiotic content and digestive health benefits.
- Distribution Channel Dominance:
- Supermarket/Hypermarket: Remains the primary distribution channel, offering wide product selection and convenient access for consumers.
- Online Retail Stores: Witnessing significant growth, driven by the convenience of home delivery and the expansion of e-commerce platforms, particularly for niche and specialized fermented products.
Fermented Foods and Beverages Industry Product Innovations
Product innovation in the Fermented Foods and Beverages Industry is primarily centered on enhancing probiotic content, developing novel flavor combinations, and improving convenience. Companies are increasingly focusing on functional benefits beyond basic gut health, such as immune support, mood enhancement, and personalized nutrition. Technological advancements in encapsulation and shelf-stability are crucial for delivering live cultures effectively. Competitive advantages are being built on unique formulations, sustainable sourcing, and appealing packaging, catering to a discerning and health-conscious consumer base.
Report Scope & Segmentation Analysis
This report provides a granular analysis of the Fermented Foods and Beverages Industry, segmented by Type, including Fermented Food (Yogurt, Tofu, Tempeh, Sauerkraut/Fermented Veggies and Pickles, Cheese, Other Fermented Food) and Fermented Beverages (Yogurt Drink/Smoothies, Kombucha, Kefir, Other Fermented Beverages). Distribution channels are also comprehensively analyzed: Supermarket/Hypermarket, Convenience Store, Online Retail Stores, and Other Distribution Channels. Growth projections and market sizes are detailed for each segment, offering insights into competitive dynamics and potential growth areas within these classifications.
Key Drivers of Fermented Foods and Beverages Industry Growth
The Fermented Foods and Beverages Industry's growth is primarily driven by a rising global consciousness around health and wellness, particularly the crucial role of gut health.
- Consumer Demand for Probiotics: Increasing awareness of the health benefits associated with probiotics, including improved digestion, immune function, and overall well-being.
- Natural and Clean Label Trends: A growing preference for minimally processed foods with natural ingredients, which aligns perfectly with the inherent nature of fermented products.
- Technological Advancements: Innovations in fermentation techniques, strain discovery, and product formulation are leading to more appealing and effective products.
- Expanding Distribution Networks: Enhanced availability through supermarkets, convenience stores, and a rapidly growing online retail presence makes these products more accessible to a wider consumer base.
Challenges in the Fermented Foods and Beverages Industry Sector
Despite significant growth, the Fermented Foods and Beverages Industry faces several hurdles. Maintaining the viability and efficacy of live probiotic cultures throughout the supply chain can be challenging, impacting product quality and consumer satisfaction. Regulatory complexities surrounding health claims and product labeling across different regions can also pose a barrier to market entry and expansion. The competitive pressure from a growing number of market players, coupled with potential supply chain disruptions, necessitates robust operational strategies. Educating consumers about the specific benefits and differences between various fermented products remains an ongoing effort.
Emerging Opportunities in Fermented Foods and Beverages Industry
Emerging opportunities in the Fermented Foods and Beverages Industry lie in tapping into niche markets with specialized health benefits, such as plant-based fermented alternatives and products tailored for specific dietary needs (e.g., low-FODMAP). The continued expansion of e-commerce platforms presents a significant opportunity for direct-to-consumer sales and broader market reach. Furthermore, the development of novel fermentation technologies that enhance flavor profiles and nutritional value will be key to capturing evolving consumer preferences. Emerging economies with growing health awareness also represent untapped potential for market penetration.
Leading Players in the Fermented Foods and Beverages Industry Market
- PepsiCo Inc
- Yakult Honsha Co Ltd
- Lactalis Group
- Chobani Inc
- Heineken N V
- Constellation Brands Inc
- BioGaia
- The Boston Beer Company
- Danone S A
- Anheuser-Busch InBev SA/NV
- Fonterra Co-operative Group Limited
- Nestlé S A
Key Developments in Fermented Foods and Beverages Industry Industry
- September 2022: Garden of Life, a Nestlé brand, launched two new probiotics for kids' growth and immune health in China. Both products come in the form of solid beverages, offering a higher number of live bacteria, probiotics, and vitamin C.
- June 2022: Danone launched the new drinkable yogurt Activa+. Activa+ is a multi-benefit drinkable yogurt made with active probiotic vitamins A, D, and zinc, available in raspberry, peach, and strawberry flavors.
- May 2022: Nurture, a Fonterra Co-operative brand, launched its first brand of cultured milk in Singapore. This low-sugar, probiotic-rich, vitamin A- and D-rich cultured milk aims to provide good health and immunity.
Future Outlook for Fermented Foods and Beverages Industry Market
The future outlook for the Fermented Foods and Beverages Industry is exceptionally bright, projecting sustained and significant growth driven by an intensifying global focus on preventative health and holistic well-being. The increasing integration of probiotics into mainstream dietary habits, coupled with ongoing innovation in product development and targeted health benefits, will continue to fuel market expansion. Strategic investments in research and development, coupled with the exploration of new geographic markets and the optimization of distribution channels, particularly online retail, will be crucial for capitalizing on future growth accelerators. The industry is poised for further evolution with advancements in bio-technology and a deepening understanding of the gut microbiome's impact on overall health.
Fermented Foods and Beverages Industry Segmentation
-
1. Type
-
1.1. Fermented Food
- 1.1.1. Yogurt
- 1.1.2. Tofu
- 1.1.3. Tempeh
- 1.1.4. Sauerkraut / Fermented Veggies and Pickles
- 1.1.5. Cheese
- 1.1.6. Other Fermented Food
-
1.2. Fermented Beverages
- 1.2.1. Yogurt Drink/Smoothies
- 1.2.2. Kombucha
- 1.2.3. Kefir
- 1.2.4. Other Fermented Beverages
-
1.1. Fermented Food
-
2. Distribution Channel
- 2.1. Supermarket/Hypermarket
- 2.2. Convenience Store
- 2.3. Online Retail Stores
- 2.4. Other Distribution Channels
Fermented Foods and Beverages Industry Segmentation By Geography
-
1. North America
- 1.1. United States
- 1.2. Canada
- 1.3. Mexico
- 1.4. Rest of North America
-
2. Europe
- 2.1. Germany
- 2.2. United Kingdom
- 2.3. France
- 2.4. Russia
- 2.5. Italy
- 2.6. Spain
- 2.7. Rest of Europe
-
3. Asia Pacific
- 3.1. India
- 3.2. China
- 3.3. Australia
- 3.4. Japan
- 3.5. Rest of Asia Pacific
-
4. South America
- 4.1. Brazil
- 4.2. Argentina
- 4.3. Rest of South America
-
5. Middle East and Africa
- 5.1. United Arab Emirates
- 5.2. South Africa
- 5.3. Rest of Middle East and Africa
Fermented Foods and Beverages Industry Regional Market Share
Geographic Coverage of Fermented Foods and Beverages Industry
Fermented Foods and Beverages Industry REPORT HIGHLIGHTS
| Aspects | Details |
|---|---|
| Study Period | 2020-2034 |
| Base Year | 2025 |
| Estimated Year | 2026 |
| Forecast Period | 2026-2034 |
| Historical Period | 2020-2025 |
| Growth Rate | CAGR of 6.2% from 2020-2034 |
| Segmentation |
|
Table of Contents
- 1. Introduction
- 1.1. Research Scope
- 1.2. Market Segmentation
- 1.3. Research Objective
- 1.4. Definitions and Assumptions
- 2. Executive Summary
- 2.1. Market Snapshot
- 3. Market Dynamics
- 3.1. Market Drivers
- 3.2. Market Restrains
- 3.3. Market Trends
- 3.4. Market Opportunities
- 4. Market Factor Analysis
- 4.1. Porters Five Forces
- 4.1.1. Bargaining Power of Suppliers
- 4.1.2. Bargaining Power of Buyers
- 4.1.3. Threat of New Entrants
- 4.1.4. Threat of Substitutes
- 4.1.5. Competitive Rivalry
- 4.2. PESTEL analysis
- 4.3. BCG Analysis
- 4.3.1. Stars (High Growth, High Market Share)
- 4.3.2. Cash Cows (Low Growth, High Market Share)
- 4.3.3. Question Mark (High Growth, Low Market Share)
- 4.3.4. Dogs (Low Growth, Low Market Share)
- 4.4. Ansoff Matrix Analysis
- 4.5. Supply Chain Analysis
- 4.6. Regulatory Landscape
- 4.7. Current Market Potential and Opportunity Assessment (TAM–SAM–SOM Framework)
- 4.8. PRI Analyst Note
- 4.1. Porters Five Forces
- 5. Market Analysis, Insights and Forecast 2021-2033
- 5.1. Market Analysis, Insights and Forecast - by Type
- 5.1.1. Fermented Food
- 5.1.1.1. Yogurt
- 5.1.1.2. Tofu
- 5.1.1.3. Tempeh
- 5.1.1.4. Sauerkraut / Fermented Veggies and Pickles
- 5.1.1.5. Cheese
- 5.1.1.6. Other Fermented Food
- 5.1.2. Fermented Beverages
- 5.1.2.1. Yogurt Drink/Smoothies
- 5.1.2.2. Kombucha
- 5.1.2.3. Kefir
- 5.1.2.4. Other Fermented Beverages
- 5.1.1. Fermented Food
- 5.2. Market Analysis, Insights and Forecast - by Distribution Channel
- 5.2.1. Supermarket/Hypermarket
- 5.2.2. Convenience Store
- 5.2.3. Online Retail Stores
- 5.2.4. Other Distribution Channels
- 5.3. Market Analysis, Insights and Forecast - by Region
- 5.3.1. North America
- 5.3.2. Europe
- 5.3.3. Asia Pacific
- 5.3.4. South America
- 5.3.5. Middle East and Africa
- 5.1. Market Analysis, Insights and Forecast - by Type
- 6. Global Fermented Foods and Beverages Industry Analysis, Insights and Forecast, 2021-2033
- 6.1. Market Analysis, Insights and Forecast - by Type
- 6.1.1. Fermented Food
- 6.1.1.1. Yogurt
- 6.1.1.2. Tofu
- 6.1.1.3. Tempeh
- 6.1.1.4. Sauerkraut / Fermented Veggies and Pickles
- 6.1.1.5. Cheese
- 6.1.1.6. Other Fermented Food
- 6.1.2. Fermented Beverages
- 6.1.2.1. Yogurt Drink/Smoothies
- 6.1.2.2. Kombucha
- 6.1.2.3. Kefir
- 6.1.2.4. Other Fermented Beverages
- 6.1.1. Fermented Food
- 6.2. Market Analysis, Insights and Forecast - by Distribution Channel
- 6.2.1. Supermarket/Hypermarket
- 6.2.2. Convenience Store
- 6.2.3. Online Retail Stores
- 6.2.4. Other Distribution Channels
- 6.1. Market Analysis, Insights and Forecast - by Type
- 7. North America Fermented Foods and Beverages Industry Analysis, Insights and Forecast, 2020-2032
- 7.1. Market Analysis, Insights and Forecast - by Type
- 7.1.1. Fermented Food
- 7.1.1.1. Yogurt
- 7.1.1.2. Tofu
- 7.1.1.3. Tempeh
- 7.1.1.4. Sauerkraut / Fermented Veggies and Pickles
- 7.1.1.5. Cheese
- 7.1.1.6. Other Fermented Food
- 7.1.2. Fermented Beverages
- 7.1.2.1. Yogurt Drink/Smoothies
- 7.1.2.2. Kombucha
- 7.1.2.3. Kefir
- 7.1.2.4. Other Fermented Beverages
- 7.1.1. Fermented Food
- 7.2. Market Analysis, Insights and Forecast - by Distribution Channel
- 7.2.1. Supermarket/Hypermarket
- 7.2.2. Convenience Store
- 7.2.3. Online Retail Stores
- 7.2.4. Other Distribution Channels
- 7.1. Market Analysis, Insights and Forecast - by Type
- 8. Europe Fermented Foods and Beverages Industry Analysis, Insights and Forecast, 2020-2032
- 8.1. Market Analysis, Insights and Forecast - by Type
- 8.1.1. Fermented Food
- 8.1.1.1. Yogurt
- 8.1.1.2. Tofu
- 8.1.1.3. Tempeh
- 8.1.1.4. Sauerkraut / Fermented Veggies and Pickles
- 8.1.1.5. Cheese
- 8.1.1.6. Other Fermented Food
- 8.1.2. Fermented Beverages
- 8.1.2.1. Yogurt Drink/Smoothies
- 8.1.2.2. Kombucha
- 8.1.2.3. Kefir
- 8.1.2.4. Other Fermented Beverages
- 8.1.1. Fermented Food
- 8.2. Market Analysis, Insights and Forecast - by Distribution Channel
- 8.2.1. Supermarket/Hypermarket
- 8.2.2. Convenience Store
- 8.2.3. Online Retail Stores
- 8.2.4. Other Distribution Channels
- 8.1. Market Analysis, Insights and Forecast - by Type
- 9. Asia Pacific Fermented Foods and Beverages Industry Analysis, Insights and Forecast, 2020-2032
- 9.1. Market Analysis, Insights and Forecast - by Type
- 9.1.1. Fermented Food
- 9.1.1.1. Yogurt
- 9.1.1.2. Tofu
- 9.1.1.3. Tempeh
- 9.1.1.4. Sauerkraut / Fermented Veggies and Pickles
- 9.1.1.5. Cheese
- 9.1.1.6. Other Fermented Food
- 9.1.2. Fermented Beverages
- 9.1.2.1. Yogurt Drink/Smoothies
- 9.1.2.2. Kombucha
- 9.1.2.3. Kefir
- 9.1.2.4. Other Fermented Beverages
- 9.1.1. Fermented Food
- 9.2. Market Analysis, Insights and Forecast - by Distribution Channel
- 9.2.1. Supermarket/Hypermarket
- 9.2.2. Convenience Store
- 9.2.3. Online Retail Stores
- 9.2.4. Other Distribution Channels
- 9.1. Market Analysis, Insights and Forecast - by Type
- 10. South America Fermented Foods and Beverages Industry Analysis, Insights and Forecast, 2020-2032
- 10.1. Market Analysis, Insights and Forecast - by Type
- 10.1.1. Fermented Food
- 10.1.1.1. Yogurt
- 10.1.1.2. Tofu
- 10.1.1.3. Tempeh
- 10.1.1.4. Sauerkraut / Fermented Veggies and Pickles
- 10.1.1.5. Cheese
- 10.1.1.6. Other Fermented Food
- 10.1.2. Fermented Beverages
- 10.1.2.1. Yogurt Drink/Smoothies
- 10.1.2.2. Kombucha
- 10.1.2.3. Kefir
- 10.1.2.4. Other Fermented Beverages
- 10.1.1. Fermented Food
- 10.2. Market Analysis, Insights and Forecast - by Distribution Channel
- 10.2.1. Supermarket/Hypermarket
- 10.2.2. Convenience Store
- 10.2.3. Online Retail Stores
- 10.2.4. Other Distribution Channels
- 10.1. Market Analysis, Insights and Forecast - by Type
- 11. Middle East and Africa Fermented Foods and Beverages Industry Analysis, Insights and Forecast, 2020-2032
- 11.1. Market Analysis, Insights and Forecast - by Type
- 11.1.1. Fermented Food
- 11.1.1.1. Yogurt
- 11.1.1.2. Tofu
- 11.1.1.3. Tempeh
- 11.1.1.4. Sauerkraut / Fermented Veggies and Pickles
- 11.1.1.5. Cheese
- 11.1.1.6. Other Fermented Food
- 11.1.2. Fermented Beverages
- 11.1.2.1. Yogurt Drink/Smoothies
- 11.1.2.2. Kombucha
- 11.1.2.3. Kefir
- 11.1.2.4. Other Fermented Beverages
- 11.1.1. Fermented Food
- 11.2. Market Analysis, Insights and Forecast - by Distribution Channel
- 11.2.1. Supermarket/Hypermarket
- 11.2.2. Convenience Store
- 11.2.3. Online Retail Stores
- 11.2.4. Other Distribution Channels
- 11.1. Market Analysis, Insights and Forecast - by Type
- 12. Competitive Analysis
- 12.1. Company Profiles
- 12.1.1 PepsiCo Inc
- 12.1.1.1. Company Overview
- 12.1.1.2. Products
- 12.1.1.3. Company Financials
- 12.1.1.4. SWOT Analysis
- 12.1.2 Yakult Honsha Co Ltd
- 12.1.2.1. Company Overview
- 12.1.2.2. Products
- 12.1.2.3. Company Financials
- 12.1.2.4. SWOT Analysis
- 12.1.3 Lactalis Group
- 12.1.3.1. Company Overview
- 12.1.3.2. Products
- 12.1.3.3. Company Financials
- 12.1.3.4. SWOT Analysis
- 12.1.4 Chobani Inc *List Not Exhaustive
- 12.1.4.1. Company Overview
- 12.1.4.2. Products
- 12.1.4.3. Company Financials
- 12.1.4.4. SWOT Analysis
- 12.1.5 Heineken N V
- 12.1.5.1. Company Overview
- 12.1.5.2. Products
- 12.1.5.3. Company Financials
- 12.1.5.4. SWOT Analysis
- 12.1.6 Constellation Brands Inc
- 12.1.6.1. Company Overview
- 12.1.6.2. Products
- 12.1.6.3. Company Financials
- 12.1.6.4. SWOT Analysis
- 12.1.7 BioGaia
- 12.1.7.1. Company Overview
- 12.1.7.2. Products
- 12.1.7.3. Company Financials
- 12.1.7.4. SWOT Analysis
- 12.1.8 The Boston Beer Company
- 12.1.8.1. Company Overview
- 12.1.8.2. Products
- 12.1.8.3. Company Financials
- 12.1.8.4. SWOT Analysis
- 12.1.9 Danone S A
- 12.1.9.1. Company Overview
- 12.1.9.2. Products
- 12.1.9.3. Company Financials
- 12.1.9.4. SWOT Analysis
- 12.1.10 Anheuser-Busch InBev SA/NV
- 12.1.10.1. Company Overview
- 12.1.10.2. Products
- 12.1.10.3. Company Financials
- 12.1.10.4. SWOT Analysis
- 12.1.11 Fonterra Co-operative Group Limited
- 12.1.11.1. Company Overview
- 12.1.11.2. Products
- 12.1.11.3. Company Financials
- 12.1.11.4. SWOT Analysis
- 12.1.12 Nestlé S A
- 12.1.12.1. Company Overview
- 12.1.12.2. Products
- 12.1.12.3. Company Financials
- 12.1.12.4. SWOT Analysis
- 12.1.1 PepsiCo Inc
- 12.2. Market Entropy
- 12.2.1 Company's Key Areas Served
- 12.2.2 Recent Developments
- 12.3. Company Market Share Analysis 2025
- 12.3.1 Top 5 Companies Market Share Analysis
- 12.3.2 Top 3 Companies Market Share Analysis
- 12.4. List of Potential Customers
- 13. Research Methodology
List of Figures
- Figure 1: Global Fermented Foods and Beverages Industry Revenue Breakdown (billion, %) by Region 2025 & 2033
- Figure 2: Global Fermented Foods and Beverages Industry Volume Breakdown (K Units, %) by Region 2025 & 2033
- Figure 3: North America Fermented Foods and Beverages Industry Revenue (billion), by Type 2025 & 2033
- Figure 4: North America Fermented Foods and Beverages Industry Volume (K Units), by Type 2025 & 2033
- Figure 5: North America Fermented Foods and Beverages Industry Revenue Share (%), by Type 2025 & 2033
- Figure 6: North America Fermented Foods and Beverages Industry Volume Share (%), by Type 2025 & 2033
- Figure 7: North America Fermented Foods and Beverages Industry Revenue (billion), by Distribution Channel 2025 & 2033
- Figure 8: North America Fermented Foods and Beverages Industry Volume (K Units), by Distribution Channel 2025 & 2033
- Figure 9: North America Fermented Foods and Beverages Industry Revenue Share (%), by Distribution Channel 2025 & 2033
- Figure 10: North America Fermented Foods and Beverages Industry Volume Share (%), by Distribution Channel 2025 & 2033
- Figure 11: North America Fermented Foods and Beverages Industry Revenue (billion), by Country 2025 & 2033
- Figure 12: North America Fermented Foods and Beverages Industry Volume (K Units), by Country 2025 & 2033
- Figure 13: North America Fermented Foods and Beverages Industry Revenue Share (%), by Country 2025 & 2033
- Figure 14: North America Fermented Foods and Beverages Industry Volume Share (%), by Country 2025 & 2033
- Figure 15: Europe Fermented Foods and Beverages Industry Revenue (billion), by Type 2025 & 2033
- Figure 16: Europe Fermented Foods and Beverages Industry Volume (K Units), by Type 2025 & 2033
- Figure 17: Europe Fermented Foods and Beverages Industry Revenue Share (%), by Type 2025 & 2033
- Figure 18: Europe Fermented Foods and Beverages Industry Volume Share (%), by Type 2025 & 2033
- Figure 19: Europe Fermented Foods and Beverages Industry Revenue (billion), by Distribution Channel 2025 & 2033
- Figure 20: Europe Fermented Foods and Beverages Industry Volume (K Units), by Distribution Channel 2025 & 2033
- Figure 21: Europe Fermented Foods and Beverages Industry Revenue Share (%), by Distribution Channel 2025 & 2033
- Figure 22: Europe Fermented Foods and Beverages Industry Volume Share (%), by Distribution Channel 2025 & 2033
- Figure 23: Europe Fermented Foods and Beverages Industry Revenue (billion), by Country 2025 & 2033
- Figure 24: Europe Fermented Foods and Beverages Industry Volume (K Units), by Country 2025 & 2033
- Figure 25: Europe Fermented Foods and Beverages Industry Revenue Share (%), by Country 2025 & 2033
- Figure 26: Europe Fermented Foods and Beverages Industry Volume Share (%), by Country 2025 & 2033
- Figure 27: Asia Pacific Fermented Foods and Beverages Industry Revenue (billion), by Type 2025 & 2033
- Figure 28: Asia Pacific Fermented Foods and Beverages Industry Volume (K Units), by Type 2025 & 2033
- Figure 29: Asia Pacific Fermented Foods and Beverages Industry Revenue Share (%), by Type 2025 & 2033
- Figure 30: Asia Pacific Fermented Foods and Beverages Industry Volume Share (%), by Type 2025 & 2033
- Figure 31: Asia Pacific Fermented Foods and Beverages Industry Revenue (billion), by Distribution Channel 2025 & 2033
- Figure 32: Asia Pacific Fermented Foods and Beverages Industry Volume (K Units), by Distribution Channel 2025 & 2033
- Figure 33: Asia Pacific Fermented Foods and Beverages Industry Revenue Share (%), by Distribution Channel 2025 & 2033
- Figure 34: Asia Pacific Fermented Foods and Beverages Industry Volume Share (%), by Distribution Channel 2025 & 2033
- Figure 35: Asia Pacific Fermented Foods and Beverages Industry Revenue (billion), by Country 2025 & 2033
- Figure 36: Asia Pacific Fermented Foods and Beverages Industry Volume (K Units), by Country 2025 & 2033
- Figure 37: Asia Pacific Fermented Foods and Beverages Industry Revenue Share (%), by Country 2025 & 2033
- Figure 38: Asia Pacific Fermented Foods and Beverages Industry Volume Share (%), by Country 2025 & 2033
- Figure 39: South America Fermented Foods and Beverages Industry Revenue (billion), by Type 2025 & 2033
- Figure 40: South America Fermented Foods and Beverages Industry Volume (K Units), by Type 2025 & 2033
- Figure 41: South America Fermented Foods and Beverages Industry Revenue Share (%), by Type 2025 & 2033
- Figure 42: South America Fermented Foods and Beverages Industry Volume Share (%), by Type 2025 & 2033
- Figure 43: South America Fermented Foods and Beverages Industry Revenue (billion), by Distribution Channel 2025 & 2033
- Figure 44: South America Fermented Foods and Beverages Industry Volume (K Units), by Distribution Channel 2025 & 2033
- Figure 45: South America Fermented Foods and Beverages Industry Revenue Share (%), by Distribution Channel 2025 & 2033
- Figure 46: South America Fermented Foods and Beverages Industry Volume Share (%), by Distribution Channel 2025 & 2033
- Figure 47: South America Fermented Foods and Beverages Industry Revenue (billion), by Country 2025 & 2033
- Figure 48: South America Fermented Foods and Beverages Industry Volume (K Units), by Country 2025 & 2033
- Figure 49: South America Fermented Foods and Beverages Industry Revenue Share (%), by Country 2025 & 2033
- Figure 50: South America Fermented Foods and Beverages Industry Volume Share (%), by Country 2025 & 2033
- Figure 51: Middle East and Africa Fermented Foods and Beverages Industry Revenue (billion), by Type 2025 & 2033
- Figure 52: Middle East and Africa Fermented Foods and Beverages Industry Volume (K Units), by Type 2025 & 2033
- Figure 53: Middle East and Africa Fermented Foods and Beverages Industry Revenue Share (%), by Type 2025 & 2033
- Figure 54: Middle East and Africa Fermented Foods and Beverages Industry Volume Share (%), by Type 2025 & 2033
- Figure 55: Middle East and Africa Fermented Foods and Beverages Industry Revenue (billion), by Distribution Channel 2025 & 2033
- Figure 56: Middle East and Africa Fermented Foods and Beverages Industry Volume (K Units), by Distribution Channel 2025 & 2033
- Figure 57: Middle East and Africa Fermented Foods and Beverages Industry Revenue Share (%), by Distribution Channel 2025 & 2033
- Figure 58: Middle East and Africa Fermented Foods and Beverages Industry Volume Share (%), by Distribution Channel 2025 & 2033
- Figure 59: Middle East and Africa Fermented Foods and Beverages Industry Revenue (billion), by Country 2025 & 2033
- Figure 60: Middle East and Africa Fermented Foods and Beverages Industry Volume (K Units), by Country 2025 & 2033
- Figure 61: Middle East and Africa Fermented Foods and Beverages Industry Revenue Share (%), by Country 2025 & 2033
- Figure 62: Middle East and Africa Fermented Foods and Beverages Industry Volume Share (%), by Country 2025 & 2033
List of Tables
- Table 1: Global Fermented Foods and Beverages Industry Revenue billion Forecast, by Type 2020 & 2033
- Table 2: Global Fermented Foods and Beverages Industry Volume K Units Forecast, by Type 2020 & 2033
- Table 3: Global Fermented Foods and Beverages Industry Revenue billion Forecast, by Distribution Channel 2020 & 2033
- Table 4: Global Fermented Foods and Beverages Industry Volume K Units Forecast, by Distribution Channel 2020 & 2033
- Table 5: Global Fermented Foods and Beverages Industry Revenue billion Forecast, by Region 2020 & 2033
- Table 6: Global Fermented Foods and Beverages Industry Volume K Units Forecast, by Region 2020 & 2033
- Table 7: Global Fermented Foods and Beverages Industry Revenue billion Forecast, by Type 2020 & 2033
- Table 8: Global Fermented Foods and Beverages Industry Volume K Units Forecast, by Type 2020 & 2033
- Table 9: Global Fermented Foods and Beverages Industry Revenue billion Forecast, by Distribution Channel 2020 & 2033
- Table 10: Global Fermented Foods and Beverages Industry Volume K Units Forecast, by Distribution Channel 2020 & 2033
- Table 11: Global Fermented Foods and Beverages Industry Revenue billion Forecast, by Country 2020 & 2033
- Table 12: Global Fermented Foods and Beverages Industry Volume K Units Forecast, by Country 2020 & 2033
- Table 13: United States Fermented Foods and Beverages Industry Revenue (billion) Forecast, by Application 2020 & 2033
- Table 14: United States Fermented Foods and Beverages Industry Volume (K Units) Forecast, by Application 2020 & 2033
- Table 15: Canada Fermented Foods and Beverages Industry Revenue (billion) Forecast, by Application 2020 & 2033
- Table 16: Canada Fermented Foods and Beverages Industry Volume (K Units) Forecast, by Application 2020 & 2033
- Table 17: Mexico Fermented Foods and Beverages Industry Revenue (billion) Forecast, by Application 2020 & 2033
- Table 18: Mexico Fermented Foods and Beverages Industry Volume (K Units) Forecast, by Application 2020 & 2033
- Table 19: Rest of North America Fermented Foods and Beverages Industry Revenue (billion) Forecast, by Application 2020 & 2033
- Table 20: Rest of North America Fermented Foods and Beverages Industry Volume (K Units) Forecast, by Application 2020 & 2033
- Table 21: Global Fermented Foods and Beverages Industry Revenue billion Forecast, by Type 2020 & 2033
- Table 22: Global Fermented Foods and Beverages Industry Volume K Units Forecast, by Type 2020 & 2033
- Table 23: Global Fermented Foods and Beverages Industry Revenue billion Forecast, by Distribution Channel 2020 & 2033
- Table 24: Global Fermented Foods and Beverages Industry Volume K Units Forecast, by Distribution Channel 2020 & 2033
- Table 25: Global Fermented Foods and Beverages Industry Revenue billion Forecast, by Country 2020 & 2033
- Table 26: Global Fermented Foods and Beverages Industry Volume K Units Forecast, by Country 2020 & 2033
- Table 27: Germany Fermented Foods and Beverages Industry Revenue (billion) Forecast, by Application 2020 & 2033
- Table 28: Germany Fermented Foods and Beverages Industry Volume (K Units) Forecast, by Application 2020 & 2033
- Table 29: United Kingdom Fermented Foods and Beverages Industry Revenue (billion) Forecast, by Application 2020 & 2033
- Table 30: United Kingdom Fermented Foods and Beverages Industry Volume (K Units) Forecast, by Application 2020 & 2033
- Table 31: France Fermented Foods and Beverages Industry Revenue (billion) Forecast, by Application 2020 & 2033
- Table 32: France Fermented Foods and Beverages Industry Volume (K Units) Forecast, by Application 2020 & 2033
- Table 33: Russia Fermented Foods and Beverages Industry Revenue (billion) Forecast, by Application 2020 & 2033
- Table 34: Russia Fermented Foods and Beverages Industry Volume (K Units) Forecast, by Application 2020 & 2033
- Table 35: Italy Fermented Foods and Beverages Industry Revenue (billion) Forecast, by Application 2020 & 2033
- Table 36: Italy Fermented Foods and Beverages Industry Volume (K Units) Forecast, by Application 2020 & 2033
- Table 37: Spain Fermented Foods and Beverages Industry Revenue (billion) Forecast, by Application 2020 & 2033
- Table 38: Spain Fermented Foods and Beverages Industry Volume (K Units) Forecast, by Application 2020 & 2033
- Table 39: Rest of Europe Fermented Foods and Beverages Industry Revenue (billion) Forecast, by Application 2020 & 2033
- Table 40: Rest of Europe Fermented Foods and Beverages Industry Volume (K Units) Forecast, by Application 2020 & 2033
- Table 41: Global Fermented Foods and Beverages Industry Revenue billion Forecast, by Type 2020 & 2033
- Table 42: Global Fermented Foods and Beverages Industry Volume K Units Forecast, by Type 2020 & 2033
- Table 43: Global Fermented Foods and Beverages Industry Revenue billion Forecast, by Distribution Channel 2020 & 2033
- Table 44: Global Fermented Foods and Beverages Industry Volume K Units Forecast, by Distribution Channel 2020 & 2033
- Table 45: Global Fermented Foods and Beverages Industry Revenue billion Forecast, by Country 2020 & 2033
- Table 46: Global Fermented Foods and Beverages Industry Volume K Units Forecast, by Country 2020 & 2033
- Table 47: India Fermented Foods and Beverages Industry Revenue (billion) Forecast, by Application 2020 & 2033
- Table 48: India Fermented Foods and Beverages Industry Volume (K Units) Forecast, by Application 2020 & 2033
- Table 49: China Fermented Foods and Beverages Industry Revenue (billion) Forecast, by Application 2020 & 2033
- Table 50: China Fermented Foods and Beverages Industry Volume (K Units) Forecast, by Application 2020 & 2033
- Table 51: Australia Fermented Foods and Beverages Industry Revenue (billion) Forecast, by Application 2020 & 2033
- Table 52: Australia Fermented Foods and Beverages Industry Volume (K Units) Forecast, by Application 2020 & 2033
- Table 53: Japan Fermented Foods and Beverages Industry Revenue (billion) Forecast, by Application 2020 & 2033
- Table 54: Japan Fermented Foods and Beverages Industry Volume (K Units) Forecast, by Application 2020 & 2033
- Table 55: Rest of Asia Pacific Fermented Foods and Beverages Industry Revenue (billion) Forecast, by Application 2020 & 2033
- Table 56: Rest of Asia Pacific Fermented Foods and Beverages Industry Volume (K Units) Forecast, by Application 2020 & 2033
- Table 57: Global Fermented Foods and Beverages Industry Revenue billion Forecast, by Type 2020 & 2033
- Table 58: Global Fermented Foods and Beverages Industry Volume K Units Forecast, by Type 2020 & 2033
- Table 59: Global Fermented Foods and Beverages Industry Revenue billion Forecast, by Distribution Channel 2020 & 2033
- Table 60: Global Fermented Foods and Beverages Industry Volume K Units Forecast, by Distribution Channel 2020 & 2033
- Table 61: Global Fermented Foods and Beverages Industry Revenue billion Forecast, by Country 2020 & 2033
- Table 62: Global Fermented Foods and Beverages Industry Volume K Units Forecast, by Country 2020 & 2033
- Table 63: Brazil Fermented Foods and Beverages Industry Revenue (billion) Forecast, by Application 2020 & 2033
- Table 64: Brazil Fermented Foods and Beverages Industry Volume (K Units) Forecast, by Application 2020 & 2033
- Table 65: Argentina Fermented Foods and Beverages Industry Revenue (billion) Forecast, by Application 2020 & 2033
- Table 66: Argentina Fermented Foods and Beverages Industry Volume (K Units) Forecast, by Application 2020 & 2033
- Table 67: Rest of South America Fermented Foods and Beverages Industry Revenue (billion) Forecast, by Application 2020 & 2033
- Table 68: Rest of South America Fermented Foods and Beverages Industry Volume (K Units) Forecast, by Application 2020 & 2033
- Table 69: Global Fermented Foods and Beverages Industry Revenue billion Forecast, by Type 2020 & 2033
- Table 70: Global Fermented Foods and Beverages Industry Volume K Units Forecast, by Type 2020 & 2033
- Table 71: Global Fermented Foods and Beverages Industry Revenue billion Forecast, by Distribution Channel 2020 & 2033
- Table 72: Global Fermented Foods and Beverages Industry Volume K Units Forecast, by Distribution Channel 2020 & 2033
- Table 73: Global Fermented Foods and Beverages Industry Revenue billion Forecast, by Country 2020 & 2033
- Table 74: Global Fermented Foods and Beverages Industry Volume K Units Forecast, by Country 2020 & 2033
- Table 75: United Arab Emirates Fermented Foods and Beverages Industry Revenue (billion) Forecast, by Application 2020 & 2033
- Table 76: United Arab Emirates Fermented Foods and Beverages Industry Volume (K Units) Forecast, by Application 2020 & 2033
- Table 77: South Africa Fermented Foods and Beverages Industry Revenue (billion) Forecast, by Application 2020 & 2033
- Table 78: South Africa Fermented Foods and Beverages Industry Volume (K Units) Forecast, by Application 2020 & 2033
- Table 79: Rest of Middle East and Africa Fermented Foods and Beverages Industry Revenue (billion) Forecast, by Application 2020 & 2033
- Table 80: Rest of Middle East and Africa Fermented Foods and Beverages Industry Volume (K Units) Forecast, by Application 2020 & 2033
Frequently Asked Questions
1. What is the projected Compound Annual Growth Rate (CAGR) of the Fermented Foods and Beverages Industry?
The projected CAGR is approximately 6.2%.
2. Which companies are prominent players in the Fermented Foods and Beverages Industry?
Key companies in the market include PepsiCo Inc, Yakult Honsha Co Ltd, Lactalis Group, Chobani Inc *List Not Exhaustive, Heineken N V, Constellation Brands Inc, BioGaia, The Boston Beer Company, Danone S A, Anheuser-Busch InBev SA/NV, Fonterra Co-operative Group Limited, Nestlé S A.
3. What are the main segments of the Fermented Foods and Beverages Industry?
The market segments include Type, Distribution Channel.
4. Can you provide details about the market size?
The market size is estimated to be USD 951.2 billion as of 2022.
5. What are some drivers contributing to market growth?
Increasing Inclination Towards Health-based Food Products; Increasing Vegan Food Consumption.
6. What are the notable trends driving market growth?
Rising Awareness About the Health Benefits of Fermented Food and Beverages.
7. Are there any restraints impacting market growth?
The Risk of Contamination of Food is High.
8. Can you provide examples of recent developments in the market?
September 2022: Garden of Life, a Nestle brand, launched two new probiotics for kids' growth and immune health in China. Both products come in the form of solid beverages. The products contain a higher number of live bacteria, probiotics, and vitamin C.
9. What pricing options are available for accessing the report?
Pricing options include single-user, multi-user, and enterprise licenses priced at USD 4750, USD 5250, and USD 8750 respectively.
10. Is the market size provided in terms of value or volume?
The market size is provided in terms of value, measured in billion and volume, measured in K Units.
11. Are there any specific market keywords associated with the report?
Yes, the market keyword associated with the report is "Fermented Foods and Beverages Industry," which aids in identifying and referencing the specific market segment covered.
12. How do I determine which pricing option suits my needs best?
The pricing options vary based on user requirements and access needs. Individual users may opt for single-user licenses, while businesses requiring broader access may choose multi-user or enterprise licenses for cost-effective access to the report.
13. Are there any additional resources or data provided in the Fermented Foods and Beverages Industry report?
While the report offers comprehensive insights, it's advisable to review the specific contents or supplementary materials provided to ascertain if additional resources or data are available.
14. How can I stay updated on further developments or reports in the Fermented Foods and Beverages Industry?
To stay informed about further developments, trends, and reports in the Fermented Foods and Beverages Industry, consider subscribing to industry newsletters, following relevant companies and organizations, or regularly checking reputable industry news sources and publications.
Methodology
Step 1 - Identification of Relevant Samples Size from Population Database


Step 2 - Approaches for Defining Global Market Size (Value, Volume* & Price*)

Note*: In applicable scenarios
Step 3 - Data Sources
Primary Research
- Web Analytics
- Survey Reports
- Research Institute
- Latest Research Reports
- Opinion Leaders
Secondary Research
- Annual Reports
- White Paper
- Latest Press Release
- Industry Association
- Paid Database
- Investor Presentations

Step 4 - Data Triangulation
Involves using different sources of information in order to increase the validity of a study
These sources are likely to be stakeholders in a program - participants, other researchers, program staff, other community members, and so on.
Then we put all data in single framework & apply various statistical tools to find out the dynamic on the market.
During the analysis stage, feedback from the stakeholder groups would be compared to determine areas of agreement as well as areas of divergence