

Key Insights
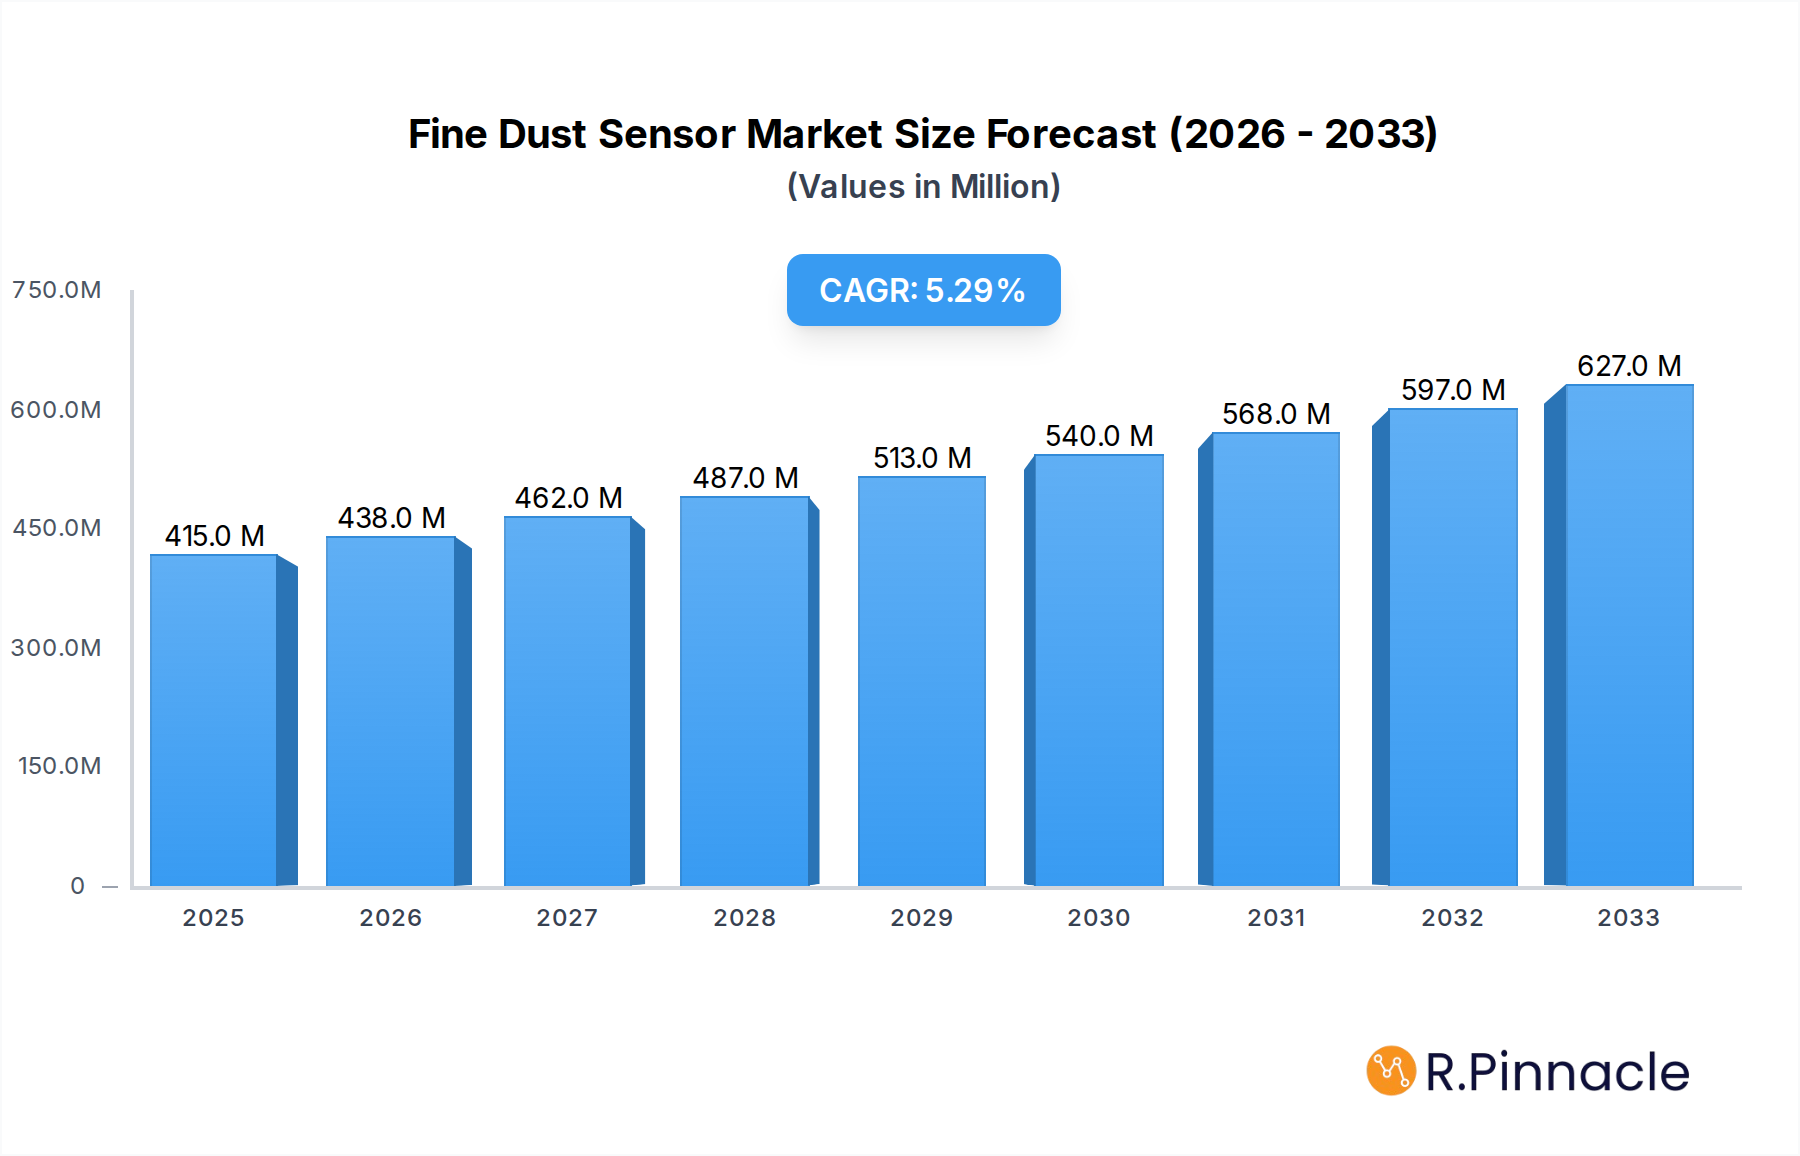
The global Fine Dust Sensor market is projected to experience robust growth, reaching an estimated $415 million in 2025 with a Compound Annual Growth Rate (CAGR) of 5.6% from 2025 to 2033. This expansion is driven by a confluence of factors, including increasing environmental regulations and a growing public awareness of air quality's impact on health. Applications in environmental monitoring are leading the charge, as governments and organizations deploy these sensors to track particulate matter levels in urban and industrial areas. The medical treatment sector is also showing significant promise, with fine dust sensors becoming integral to diagnostic tools and personal health monitoring devices. Furthermore, industrial applications are expanding, as businesses adopt these sensors for process optimization and worker safety, particularly in manufacturing and construction.

Fine Dust Sensor Market Size (In Million)
The market is characterized by a dynamic competitive landscape with key players like Siemens, Honeywell, and Panasonic Industrial Devices at the forefront. Technological advancements in sensor accuracy, miniaturization, and IoT connectivity are fueling innovation and market penetration. The sensor outputs for PM10 and PM2.5 are the dominant types, reflecting the regulatory focus on these specific particle sizes. While the market is poised for strong growth, certain restraints such as the initial cost of deployment for large-scale monitoring systems and the need for standardized calibration protocols may present challenges. However, the overarching trend towards smart cities and the increasing demand for real-time, accurate air quality data are expected to outweigh these limitations, ensuring sustained market expansion across key regions like Asia Pacific and Europe.
Fine Dust Sensor Company Market Share
Fine Dust Sensor Market: Comprehensive Analysis and Future Projections (2019-2033)
This in-depth report provides a panoramic view of the global fine dust sensor market, offering critical insights for industry stakeholders. Spanning a study period from 2019 to 2033, with a base year of 2025, the analysis delves into historical trends, current market dynamics, and future projections. We explore the intricate market structure, technological advancements, regulatory landscapes, and competitive strategies that are shaping the fine dust sensor industry. This report is an indispensable resource for manufacturers, suppliers, investors, and policymakers seeking to understand and capitalize on the evolving fine dust sensor ecosystem.
Fine Dust Sensor Market Structure & Innovation Trends
The fine dust sensor market exhibits a moderately concentrated structure, with key players investing heavily in research and development to drive innovation. Several factors contribute to the sustained innovation within this sector, including increasing global awareness of air quality and the growing demand for real-time environmental monitoring solutions. Regulatory frameworks, such as stricter emissions standards and public health initiatives, are also significant innovation drivers, pushing manufacturers to develop more accurate, sensitive, and cost-effective fine dust sensors. While direct product substitutes are limited, advancements in alternative air quality monitoring techniques could pose a future challenge. The end-user demographics are broad, encompassing industrial facilities, urban planning departments, healthcare providers, and individual consumers concerned with indoor air quality. Mergers and acquisitions (M&A) activities, with estimated deal values in the hundreds of millions, play a crucial role in market consolidation and the diffusion of new technologies. The market share distribution reflects a competitive landscape where technological leadership and strategic partnerships are paramount.
Fine Dust Sensor Market Dynamics & Trends
The fine dust sensor market is experiencing robust growth, projected to witness a Compound Annual Growth Rate (CAGR) of approximately 12% during the forecast period. This expansion is primarily fueled by escalating concerns over air pollution and its detrimental impact on public health and the environment. Government initiatives worldwide to monitor and control particulate matter emissions, coupled with increasing adoption of smart city technologies, are significant growth drivers. Technological disruptions, such as the miniaturization of sensors, enhanced power efficiency, and the integration of IoT capabilities, are enabling wider applications and improved performance. Consumer preferences are shifting towards smart, connected devices that offer real-time data and personalized environmental insights, driving demand for advanced fine dust sensor solutions in both industrial and domestic settings. Competitive dynamics are characterized by intense R&D efforts, strategic collaborations, and a focus on product differentiation. Market penetration is steadily increasing across various application segments, driven by declining sensor costs and growing awareness of the benefits of accurate particulate matter detection. The adoption of advanced materials and manufacturing processes is also contributing to enhanced sensor reliability and affordability, further accelerating market growth. The increasing prevalence of respiratory diseases and the growing demand for accurate indoor air quality monitoring in residential and commercial spaces are also significant factors propelling market expansion. Furthermore, the integration of fine dust sensors into wearable devices and other consumer electronics presents a substantial opportunity for market growth.
Dominant Regions & Segments in Fine Dust Sensor
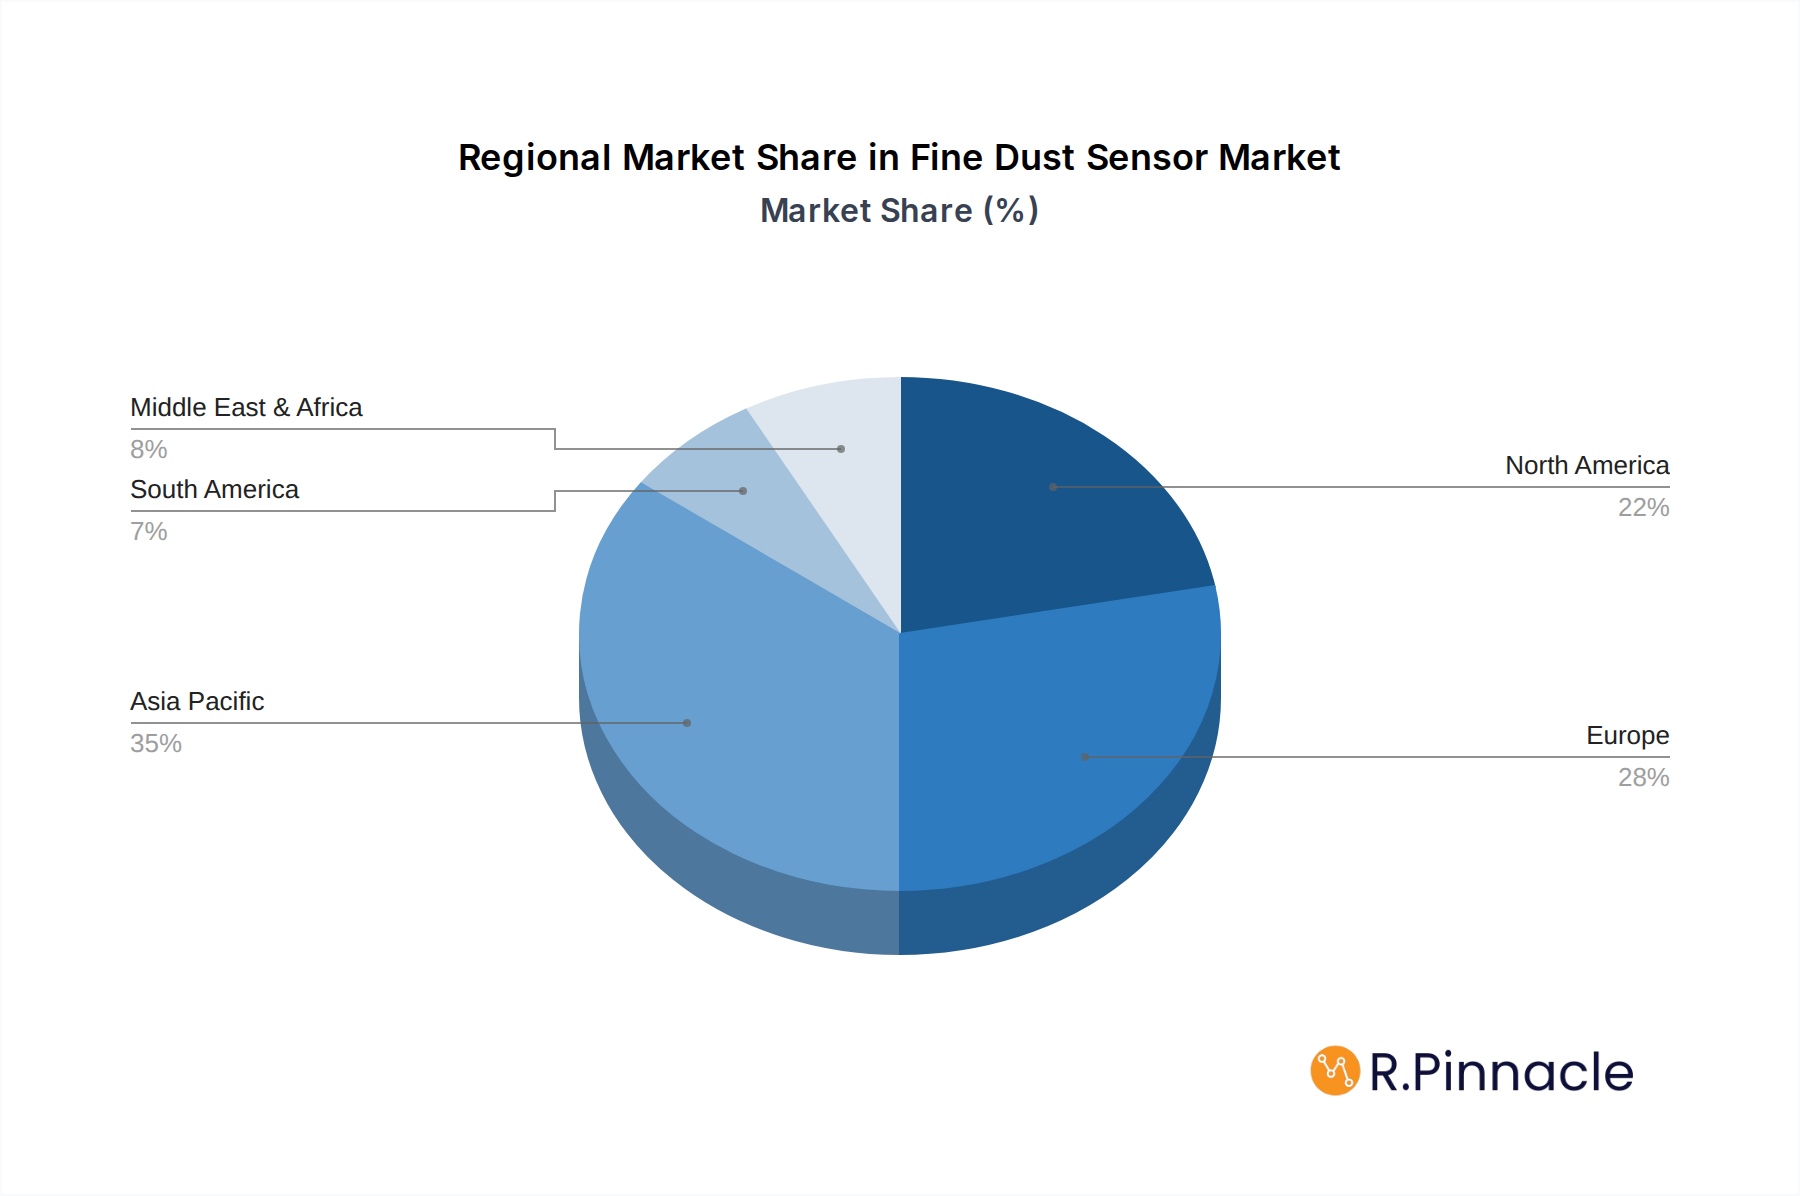
The Asia Pacific region is currently the dominant force in the global fine dust sensor market, driven by rapid industrialization, increasing urbanization, and stringent government regulations aimed at curbing air pollution. Countries like China and India, with their massive populations and significant industrial output, represent key markets with substantial demand for fine dust monitoring solutions.
- Key Drivers in Asia Pacific:
- Economic Policies: Government investments in environmental protection and smart city infrastructure.
- Infrastructure Development: Widespread deployment of air quality monitoring networks in urban centers.
- Industrial Growth: High concentration of manufacturing industries necessitating industrial pollution control.
- Public Health Awareness: Growing public concern over the health impacts of fine dust.
Within the application segments, Environmental Monitoring commands the largest market share, owing to the critical need for accurate data to assess and manage air quality in outdoor environments. This includes monitoring emissions from industrial sites, traffic, and general atmospheric particulate matter.
- Dominance of Environmental Monitoring:
- Regulatory Compliance: Essential for industries to meet environmental regulations and avoid penalties.
- Urban Planning: Crucial for city planners to develop strategies for air quality improvement.
- Research and Development: Supports scientific studies on the impact of air pollution.
In terms of sensor types, The Sensor Outputs PM2.5 segment is experiencing the fastest growth. PM2.5 particles, being smaller and more inhalable, pose a greater threat to human health, driving demand for sensors capable of accurately detecting and quantifying these fine particles.
- Growth Drivers for PM2.5 Sensors:
- Health Implications: Increased understanding of the severe health risks associated with PM2.5 exposure.
- Technological Advancements: Development of more sensitive and accurate PM2.5 detection technologies.
- Consumer Demand: Growing demand for personal air quality monitors and smart home devices.
Other significant regions include North America and Europe, where established environmental regulations and a strong focus on public health continue to drive market growth. However, the sheer scale of industrial activity and population in Asia Pacific positions it as the leading market for fine dust sensors.
Fine Dust Sensor Product Innovations
Recent product innovations in the fine dust sensor market focus on enhancing accuracy, reducing size and power consumption, and enabling seamless integration with IoT platforms. Advancements include the development of laser scattering-based sensors with improved particle counting capabilities and novel optical technologies for precise PM2.5 and PM10 detection. These innovations offer competitive advantages by providing more reliable data, enabling real-time monitoring in diverse environments, and facilitating the development of sophisticated air quality management systems. Applications are expanding beyond traditional environmental monitoring to include smart wearables, HVAC systems, and advanced industrial process controls, underscoring the evolving market fit for these sophisticated sensing solutions.
Report Scope & Segmentation Analysis
This report provides a comprehensive segmentation of the fine dust sensor market across various applications and sensor output types. The market is analyzed based on the following segments:
- Application: Agriculture, Environmental Monitoring, Industry, Medical Treatment, and Other. Each segment is projected to exhibit varied growth rates, with Environmental Monitoring expected to maintain its leading position due to ongoing regulatory pressures and public health concerns.
- Types: The Sensor Outputs PM10 and The Sensor Outputs PM2.5. The PM2.5 segment is anticipated to witness significant expansion driven by increasing awareness of health risks associated with these fine particles. Market sizes and competitive dynamics within each of these sub-segments have been thoroughly evaluated.
Key Drivers of Fine Dust Sensor Growth
Several factors are propelling the growth of the fine dust sensor market. Technologically, advancements in optical sensing and microelectromechanical systems (MEMS) have led to more accurate, compact, and affordable sensors. Economically, the rising disposable incomes in emerging economies and the increasing awareness of the economic burden of air pollution-related health issues are driving investment in air quality solutions. Regulatory frameworks, such as the EU's Ambient Air Quality Directive and the US EPA's air quality standards, mandate the monitoring of particulate matter, creating sustained demand. The proliferation of the Internet of Things (IoT) ecosystem also acts as a significant driver, enabling the seamless integration of fine dust sensors into smart devices and platforms for remote monitoring and data analysis.
Challenges in the Fine Dust Sensor Sector
Despite robust growth, the fine dust sensor sector faces several challenges. Regulatory hurdles can arise from varying standards across different regions, complicating global product deployment and compliance. Supply chain issues, including the availability of critical raw materials and the manufacturing capacity for sophisticated sensor components, can impact production volumes and lead times. Intense competitive pressures, particularly from low-cost manufacturers in certain segments, necessitate continuous innovation and cost optimization. Furthermore, the accuracy and calibration of fine dust sensors can be affected by environmental factors like humidity and temperature, requiring sophisticated algorithms and regular maintenance, which can be a barrier to widespread adoption in less controlled environments.
Emerging Opportunities in Fine Dust Sensor
Emerging opportunities in the fine dust sensor market lie in several key areas. The increasing adoption of smart home devices and the growing consumer demand for healthy indoor environments present a significant market for residential fine dust sensors. Advancements in sensor miniaturization and power efficiency are paving the way for integration into wearable technology and personal air quality monitors. The expansion of smart city initiatives globally is creating demand for extensive air quality monitoring networks, requiring scalable and cost-effective sensor solutions. Furthermore, the application of fine dust sensors in specialized sectors such as precision agriculture for monitoring airborne particles affecting crop health, and in the medical field for disease management and prevention, offers new avenues for growth.
Leading Players in the Fine Dust Sensor Market
- Cubic Sensor and Instrument
- Siemens
- Dr. Fodisch
- Omron Electronic Components
- Candle
- CEM Solutions
- Zhengzhou Winsen Electronics Technology
- ALLNET
- Honeywell
- AMETEK
- Aeroqual
- Panasonic Industrial Devices
- Elitech Technology
Key Developments in Fine Dust Sensor Industry
- 2023: Launch of next-generation, highly accurate PM2.5 sensors with enhanced IoT connectivity.
- 2022: Strategic partnerships formed between sensor manufacturers and smart home device companies to integrate fine dust monitoring.
- 2021: Significant investment in R&D for low-cost, high-performance fine dust sensors targeting emerging markets.
- 2020: Introduction of advanced algorithms for improved dust classification and differentiation from other airborne particles.
- 2019: Development of miniaturized fine dust sensors suitable for integration into wearable devices.
Future Outlook for Fine Dust Sensor Market
The future outlook for the fine dust sensor market is exceptionally bright, driven by an intensifying global focus on air quality and public health. Continued technological advancements, particularly in AI-driven data analysis and predictive modeling, will enhance the utility and accuracy of these sensors. The expanding IoT ecosystem will further facilitate the integration of fine dust sensors into a wider array of connected devices and smart infrastructure, creating new market opportunities. Strategic collaborations between sensor manufacturers, technology providers, and end-users will be crucial for developing tailored solutions for diverse applications. The increasing adoption of these sensors in emerging economies, coupled with stricter environmental regulations worldwide, will sustain robust market growth and innovation in the coming years.
Fine Dust Sensor Segmentation
-
1. Application
- 1.1. Agriculture
- 1.2. Environmental Monitoring
- 1.3. Industry
- 1.4. Medical Treatment
- 1.5. Other
-
2. Types
- 2.1. The Sensor Outputs PM10
- 2.2. The Sensor Outputs PM2.5
Fine Dust Sensor Segmentation By Geography
-
1. North America
- 1.1. United States
- 1.2. Canada
- 1.3. Mexico
-
2. South America
- 2.1. Brazil
- 2.2. Argentina
- 2.3. Rest of South America
-
3. Europe
- 3.1. United Kingdom
- 3.2. Germany
- 3.3. France
- 3.4. Italy
- 3.5. Spain
- 3.6. Russia
- 3.7. Benelux
- 3.8. Nordics
- 3.9. Rest of Europe
-
4. Middle East & Africa
- 4.1. Turkey
- 4.2. Israel
- 4.3. GCC
- 4.4. North Africa
- 4.5. South Africa
- 4.6. Rest of Middle East & Africa
-
5. Asia Pacific
- 5.1. China
- 5.2. India
- 5.3. Japan
- 5.4. South Korea
- 5.5. ASEAN
- 5.6. Oceania
- 5.7. Rest of Asia Pacific
Fine Dust Sensor Regional Market Share
Geographic Coverage of Fine Dust Sensor
Fine Dust Sensor REPORT HIGHLIGHTS
| Aspects | Details |
|---|---|
| Study Period | 2020-2034 |
| Base Year | 2025 |
| Estimated Year | 2026 |
| Forecast Period | 2026-2034 |
| Historical Period | 2020-2025 |
| Growth Rate | CAGR of 5.6% from 2020-2034 |
| Segmentation |
|
Table of Contents
- 1. Introduction
- 1.1. Research Scope
- 1.2. Market Segmentation
- 1.3. Research Methodology
- 1.4. Definitions and Assumptions
- 2. Executive Summary
- 2.1. Introduction
- 3. Market Dynamics
- 3.1. Introduction
- 3.2. Market Drivers
- 3.3. Market Restrains
- 3.4. Market Trends
- 4. Market Factor Analysis
- 4.1. Porters Five Forces
- 4.2. Supply/Value Chain
- 4.3. PESTEL analysis
- 4.4. Market Entropy
- 4.5. Patent/Trademark Analysis
- 5. Global Fine Dust Sensor Analysis, Insights and Forecast, 2020-2032
- 5.1. Market Analysis, Insights and Forecast - by Application
- 5.1.1. Agriculture
- 5.1.2. Environmental Monitoring
- 5.1.3. Industry
- 5.1.4. Medical Treatment
- 5.1.5. Other
- 5.2. Market Analysis, Insights and Forecast - by Types
- 5.2.1. The Sensor Outputs PM10
- 5.2.2. The Sensor Outputs PM2.5
- 5.3. Market Analysis, Insights and Forecast - by Region
- 5.3.1. North America
- 5.3.2. South America
- 5.3.3. Europe
- 5.3.4. Middle East & Africa
- 5.3.5. Asia Pacific
- 5.1. Market Analysis, Insights and Forecast - by Application
- 6. North America Fine Dust Sensor Analysis, Insights and Forecast, 2020-2032
- 6.1. Market Analysis, Insights and Forecast - by Application
- 6.1.1. Agriculture
- 6.1.2. Environmental Monitoring
- 6.1.3. Industry
- 6.1.4. Medical Treatment
- 6.1.5. Other
- 6.2. Market Analysis, Insights and Forecast - by Types
- 6.2.1. The Sensor Outputs PM10
- 6.2.2. The Sensor Outputs PM2.5
- 6.1. Market Analysis, Insights and Forecast - by Application
- 7. South America Fine Dust Sensor Analysis, Insights and Forecast, 2020-2032
- 7.1. Market Analysis, Insights and Forecast - by Application
- 7.1.1. Agriculture
- 7.1.2. Environmental Monitoring
- 7.1.3. Industry
- 7.1.4. Medical Treatment
- 7.1.5. Other
- 7.2. Market Analysis, Insights and Forecast - by Types
- 7.2.1. The Sensor Outputs PM10
- 7.2.2. The Sensor Outputs PM2.5
- 7.1. Market Analysis, Insights and Forecast - by Application
- 8. Europe Fine Dust Sensor Analysis, Insights and Forecast, 2020-2032
- 8.1. Market Analysis, Insights and Forecast - by Application
- 8.1.1. Agriculture
- 8.1.2. Environmental Monitoring
- 8.1.3. Industry
- 8.1.4. Medical Treatment
- 8.1.5. Other
- 8.2. Market Analysis, Insights and Forecast - by Types
- 8.2.1. The Sensor Outputs PM10
- 8.2.2. The Sensor Outputs PM2.5
- 8.1. Market Analysis, Insights and Forecast - by Application
- 9. Middle East & Africa Fine Dust Sensor Analysis, Insights and Forecast, 2020-2032
- 9.1. Market Analysis, Insights and Forecast - by Application
- 9.1.1. Agriculture
- 9.1.2. Environmental Monitoring
- 9.1.3. Industry
- 9.1.4. Medical Treatment
- 9.1.5. Other
- 9.2. Market Analysis, Insights and Forecast - by Types
- 9.2.1. The Sensor Outputs PM10
- 9.2.2. The Sensor Outputs PM2.5
- 9.1. Market Analysis, Insights and Forecast - by Application
- 10. Asia Pacific Fine Dust Sensor Analysis, Insights and Forecast, 2020-2032
- 10.1. Market Analysis, Insights and Forecast - by Application
- 10.1.1. Agriculture
- 10.1.2. Environmental Monitoring
- 10.1.3. Industry
- 10.1.4. Medical Treatment
- 10.1.5. Other
- 10.2. Market Analysis, Insights and Forecast - by Types
- 10.2.1. The Sensor Outputs PM10
- 10.2.2. The Sensor Outputs PM2.5
- 10.1. Market Analysis, Insights and Forecast - by Application
- 11. Competitive Analysis
- 11.1. Global Market Share Analysis 2025
- 11.2. Company Profiles
- 11.2.1 Cubic Sensor and Instrument
- 11.2.1.1. Overview
- 11.2.1.2. Products
- 11.2.1.3. SWOT Analysis
- 11.2.1.4. Recent Developments
- 11.2.1.5. Financials (Based on Availability)
- 11.2.2 Siemens
- 11.2.2.1. Overview
- 11.2.2.2. Products
- 11.2.2.3. SWOT Analysis
- 11.2.2.4. Recent Developments
- 11.2.2.5. Financials (Based on Availability)
- 11.2.3 Dr. Fodisch
- 11.2.3.1. Overview
- 11.2.3.2. Products
- 11.2.3.3. SWOT Analysis
- 11.2.3.4. Recent Developments
- 11.2.3.5. Financials (Based on Availability)
- 11.2.4 Omron Electronic Components
- 11.2.4.1. Overview
- 11.2.4.2. Products
- 11.2.4.3. SWOT Analysis
- 11.2.4.4. Recent Developments
- 11.2.4.5. Financials (Based on Availability)
- 11.2.5 Candle
- 11.2.5.1. Overview
- 11.2.5.2. Products
- 11.2.5.3. SWOT Analysis
- 11.2.5.4. Recent Developments
- 11.2.5.5. Financials (Based on Availability)
- 11.2.6 CEM Solutions
- 11.2.6.1. Overview
- 11.2.6.2. Products
- 11.2.6.3. SWOT Analysis
- 11.2.6.4. Recent Developments
- 11.2.6.5. Financials (Based on Availability)
- 11.2.7 Zhengzhou Winsen Electronics Technology
- 11.2.7.1. Overview
- 11.2.7.2. Products
- 11.2.7.3. SWOT Analysis
- 11.2.7.4. Recent Developments
- 11.2.7.5. Financials (Based on Availability)
- 11.2.8 ALLNET
- 11.2.8.1. Overview
- 11.2.8.2. Products
- 11.2.8.3. SWOT Analysis
- 11.2.8.4. Recent Developments
- 11.2.8.5. Financials (Based on Availability)
- 11.2.9 Honeywell
- 11.2.9.1. Overview
- 11.2.9.2. Products
- 11.2.9.3. SWOT Analysis
- 11.2.9.4. Recent Developments
- 11.2.9.5. Financials (Based on Availability)
- 11.2.10 AMETEK
- 11.2.10.1. Overview
- 11.2.10.2. Products
- 11.2.10.3. SWOT Analysis
- 11.2.10.4. Recent Developments
- 11.2.10.5. Financials (Based on Availability)
- 11.2.11 Aeroqual
- 11.2.11.1. Overview
- 11.2.11.2. Products
- 11.2.11.3. SWOT Analysis
- 11.2.11.4. Recent Developments
- 11.2.11.5. Financials (Based on Availability)
- 11.2.12 Panasonic Industrial Devices
- 11.2.12.1. Overview
- 11.2.12.2. Products
- 11.2.12.3. SWOT Analysis
- 11.2.12.4. Recent Developments
- 11.2.12.5. Financials (Based on Availability)
- 11.2.13 Elitech Technology
- 11.2.13.1. Overview
- 11.2.13.2. Products
- 11.2.13.3. SWOT Analysis
- 11.2.13.4. Recent Developments
- 11.2.13.5. Financials (Based on Availability)
- 11.2.1 Cubic Sensor and Instrument
List of Figures
- Figure 1: Global Fine Dust Sensor Revenue Breakdown (undefined, %) by Region 2025 & 2033
- Figure 2: North America Fine Dust Sensor Revenue (undefined), by Application 2025 & 2033
- Figure 3: North America Fine Dust Sensor Revenue Share (%), by Application 2025 & 2033
- Figure 4: North America Fine Dust Sensor Revenue (undefined), by Types 2025 & 2033
- Figure 5: North America Fine Dust Sensor Revenue Share (%), by Types 2025 & 2033
- Figure 6: North America Fine Dust Sensor Revenue (undefined), by Country 2025 & 2033
- Figure 7: North America Fine Dust Sensor Revenue Share (%), by Country 2025 & 2033
- Figure 8: South America Fine Dust Sensor Revenue (undefined), by Application 2025 & 2033
- Figure 9: South America Fine Dust Sensor Revenue Share (%), by Application 2025 & 2033
- Figure 10: South America Fine Dust Sensor Revenue (undefined), by Types 2025 & 2033
- Figure 11: South America Fine Dust Sensor Revenue Share (%), by Types 2025 & 2033
- Figure 12: South America Fine Dust Sensor Revenue (undefined), by Country 2025 & 2033
- Figure 13: South America Fine Dust Sensor Revenue Share (%), by Country 2025 & 2033
- Figure 14: Europe Fine Dust Sensor Revenue (undefined), by Application 2025 & 2033
- Figure 15: Europe Fine Dust Sensor Revenue Share (%), by Application 2025 & 2033
- Figure 16: Europe Fine Dust Sensor Revenue (undefined), by Types 2025 & 2033
- Figure 17: Europe Fine Dust Sensor Revenue Share (%), by Types 2025 & 2033
- Figure 18: Europe Fine Dust Sensor Revenue (undefined), by Country 2025 & 2033
- Figure 19: Europe Fine Dust Sensor Revenue Share (%), by Country 2025 & 2033
- Figure 20: Middle East & Africa Fine Dust Sensor Revenue (undefined), by Application 2025 & 2033
- Figure 21: Middle East & Africa Fine Dust Sensor Revenue Share (%), by Application 2025 & 2033
- Figure 22: Middle East & Africa Fine Dust Sensor Revenue (undefined), by Types 2025 & 2033
- Figure 23: Middle East & Africa Fine Dust Sensor Revenue Share (%), by Types 2025 & 2033
- Figure 24: Middle East & Africa Fine Dust Sensor Revenue (undefined), by Country 2025 & 2033
- Figure 25: Middle East & Africa Fine Dust Sensor Revenue Share (%), by Country 2025 & 2033
- Figure 26: Asia Pacific Fine Dust Sensor Revenue (undefined), by Application 2025 & 2033
- Figure 27: Asia Pacific Fine Dust Sensor Revenue Share (%), by Application 2025 & 2033
- Figure 28: Asia Pacific Fine Dust Sensor Revenue (undefined), by Types 2025 & 2033
- Figure 29: Asia Pacific Fine Dust Sensor Revenue Share (%), by Types 2025 & 2033
- Figure 30: Asia Pacific Fine Dust Sensor Revenue (undefined), by Country 2025 & 2033
- Figure 31: Asia Pacific Fine Dust Sensor Revenue Share (%), by Country 2025 & 2033
List of Tables
- Table 1: Global Fine Dust Sensor Revenue undefined Forecast, by Application 2020 & 2033
- Table 2: Global Fine Dust Sensor Revenue undefined Forecast, by Types 2020 & 2033
- Table 3: Global Fine Dust Sensor Revenue undefined Forecast, by Region 2020 & 2033
- Table 4: Global Fine Dust Sensor Revenue undefined Forecast, by Application 2020 & 2033
- Table 5: Global Fine Dust Sensor Revenue undefined Forecast, by Types 2020 & 2033
- Table 6: Global Fine Dust Sensor Revenue undefined Forecast, by Country 2020 & 2033
- Table 7: United States Fine Dust Sensor Revenue (undefined) Forecast, by Application 2020 & 2033
- Table 8: Canada Fine Dust Sensor Revenue (undefined) Forecast, by Application 2020 & 2033
- Table 9: Mexico Fine Dust Sensor Revenue (undefined) Forecast, by Application 2020 & 2033
- Table 10: Global Fine Dust Sensor Revenue undefined Forecast, by Application 2020 & 2033
- Table 11: Global Fine Dust Sensor Revenue undefined Forecast, by Types 2020 & 2033
- Table 12: Global Fine Dust Sensor Revenue undefined Forecast, by Country 2020 & 2033
- Table 13: Brazil Fine Dust Sensor Revenue (undefined) Forecast, by Application 2020 & 2033
- Table 14: Argentina Fine Dust Sensor Revenue (undefined) Forecast, by Application 2020 & 2033
- Table 15: Rest of South America Fine Dust Sensor Revenue (undefined) Forecast, by Application 2020 & 2033
- Table 16: Global Fine Dust Sensor Revenue undefined Forecast, by Application 2020 & 2033
- Table 17: Global Fine Dust Sensor Revenue undefined Forecast, by Types 2020 & 2033
- Table 18: Global Fine Dust Sensor Revenue undefined Forecast, by Country 2020 & 2033
- Table 19: United Kingdom Fine Dust Sensor Revenue (undefined) Forecast, by Application 2020 & 2033
- Table 20: Germany Fine Dust Sensor Revenue (undefined) Forecast, by Application 2020 & 2033
- Table 21: France Fine Dust Sensor Revenue (undefined) Forecast, by Application 2020 & 2033
- Table 22: Italy Fine Dust Sensor Revenue (undefined) Forecast, by Application 2020 & 2033
- Table 23: Spain Fine Dust Sensor Revenue (undefined) Forecast, by Application 2020 & 2033
- Table 24: Russia Fine Dust Sensor Revenue (undefined) Forecast, by Application 2020 & 2033
- Table 25: Benelux Fine Dust Sensor Revenue (undefined) Forecast, by Application 2020 & 2033
- Table 26: Nordics Fine Dust Sensor Revenue (undefined) Forecast, by Application 2020 & 2033
- Table 27: Rest of Europe Fine Dust Sensor Revenue (undefined) Forecast, by Application 2020 & 2033
- Table 28: Global Fine Dust Sensor Revenue undefined Forecast, by Application 2020 & 2033
- Table 29: Global Fine Dust Sensor Revenue undefined Forecast, by Types 2020 & 2033
- Table 30: Global Fine Dust Sensor Revenue undefined Forecast, by Country 2020 & 2033
- Table 31: Turkey Fine Dust Sensor Revenue (undefined) Forecast, by Application 2020 & 2033
- Table 32: Israel Fine Dust Sensor Revenue (undefined) Forecast, by Application 2020 & 2033
- Table 33: GCC Fine Dust Sensor Revenue (undefined) Forecast, by Application 2020 & 2033
- Table 34: North Africa Fine Dust Sensor Revenue (undefined) Forecast, by Application 2020 & 2033
- Table 35: South Africa Fine Dust Sensor Revenue (undefined) Forecast, by Application 2020 & 2033
- Table 36: Rest of Middle East & Africa Fine Dust Sensor Revenue (undefined) Forecast, by Application 2020 & 2033
- Table 37: Global Fine Dust Sensor Revenue undefined Forecast, by Application 2020 & 2033
- Table 38: Global Fine Dust Sensor Revenue undefined Forecast, by Types 2020 & 2033
- Table 39: Global Fine Dust Sensor Revenue undefined Forecast, by Country 2020 & 2033
- Table 40: China Fine Dust Sensor Revenue (undefined) Forecast, by Application 2020 & 2033
- Table 41: India Fine Dust Sensor Revenue (undefined) Forecast, by Application 2020 & 2033
- Table 42: Japan Fine Dust Sensor Revenue (undefined) Forecast, by Application 2020 & 2033
- Table 43: South Korea Fine Dust Sensor Revenue (undefined) Forecast, by Application 2020 & 2033
- Table 44: ASEAN Fine Dust Sensor Revenue (undefined) Forecast, by Application 2020 & 2033
- Table 45: Oceania Fine Dust Sensor Revenue (undefined) Forecast, by Application 2020 & 2033
- Table 46: Rest of Asia Pacific Fine Dust Sensor Revenue (undefined) Forecast, by Application 2020 & 2033
Frequently Asked Questions
1. What is the projected Compound Annual Growth Rate (CAGR) of the Fine Dust Sensor?
The projected CAGR is approximately 5.6%.
2. Which companies are prominent players in the Fine Dust Sensor?
Key companies in the market include Cubic Sensor and Instrument, Siemens, Dr. Fodisch, Omron Electronic Components, Candle, CEM Solutions, Zhengzhou Winsen Electronics Technology, ALLNET, Honeywell, AMETEK, Aeroqual, Panasonic Industrial Devices, Elitech Technology.
3. What are the main segments of the Fine Dust Sensor?
The market segments include Application, Types.
4. Can you provide details about the market size?
The market size is estimated to be USD XXX N/A as of 2022.
5. What are some drivers contributing to market growth?
N/A
6. What are the notable trends driving market growth?
N/A
7. Are there any restraints impacting market growth?
N/A
8. Can you provide examples of recent developments in the market?
N/A
9. What pricing options are available for accessing the report?
Pricing options include single-user, multi-user, and enterprise licenses priced at USD 2900.00, USD 4350.00, and USD 5800.00 respectively.
10. Is the market size provided in terms of value or volume?
The market size is provided in terms of value, measured in N/A.
11. Are there any specific market keywords associated with the report?
Yes, the market keyword associated with the report is "Fine Dust Sensor," which aids in identifying and referencing the specific market segment covered.
12. How do I determine which pricing option suits my needs best?
The pricing options vary based on user requirements and access needs. Individual users may opt for single-user licenses, while businesses requiring broader access may choose multi-user or enterprise licenses for cost-effective access to the report.
13. Are there any additional resources or data provided in the Fine Dust Sensor report?
While the report offers comprehensive insights, it's advisable to review the specific contents or supplementary materials provided to ascertain if additional resources or data are available.
14. How can I stay updated on further developments or reports in the Fine Dust Sensor?
To stay informed about further developments, trends, and reports in the Fine Dust Sensor, consider subscribing to industry newsletters, following relevant companies and organizations, or regularly checking reputable industry news sources and publications.
Methodology
Step 1 - Identification of Relevant Samples Size from Population Database


Step 2 - Approaches for Defining Global Market Size (Value, Volume* & Price*)

Note*: In applicable scenarios
Step 3 - Data Sources
Primary Research
- Web Analytics
- Survey Reports
- Research Institute
- Latest Research Reports
- Opinion Leaders
Secondary Research
- Annual Reports
- White Paper
- Latest Press Release
- Industry Association
- Paid Database
- Investor Presentations

Step 4 - Data Triangulation
Involves using different sources of information in order to increase the validity of a study
These sources are likely to be stakeholders in a program - participants, other researchers, program staff, other community members, and so on.
Then we put all data in single framework & apply various statistical tools to find out the dynamic on the market.
During the analysis stage, feedback from the stakeholder groups would be compared to determine areas of agreement as well as areas of divergence