

Key Insights
The Smart Space Industry is poised for substantial growth, projected to reach a market size of $17.85 billion by 2025, with an impressive Compound Annual Growth Rate (CAGR) of 11.9% anticipated throughout the forecast period of 2025-2033. This robust expansion is fueled by an increasing demand for integrated building management systems that enhance energy efficiency, occupant comfort, and operational productivity. Key drivers include the escalating adoption of Internet of Things (IoT) devices for data collection and analysis, the growing imperative for sustainable building practices, and the evolving landscape of smart city initiatives. As organizations and individuals increasingly recognize the tangible benefits of optimized spatial utilization and automated environmental controls, investments in smart space technologies are set to accelerate. The market is segmented into Solutions and Services, catering to diverse needs within both Commercial and Residential sectors, reflecting a broad applicability across various environments.
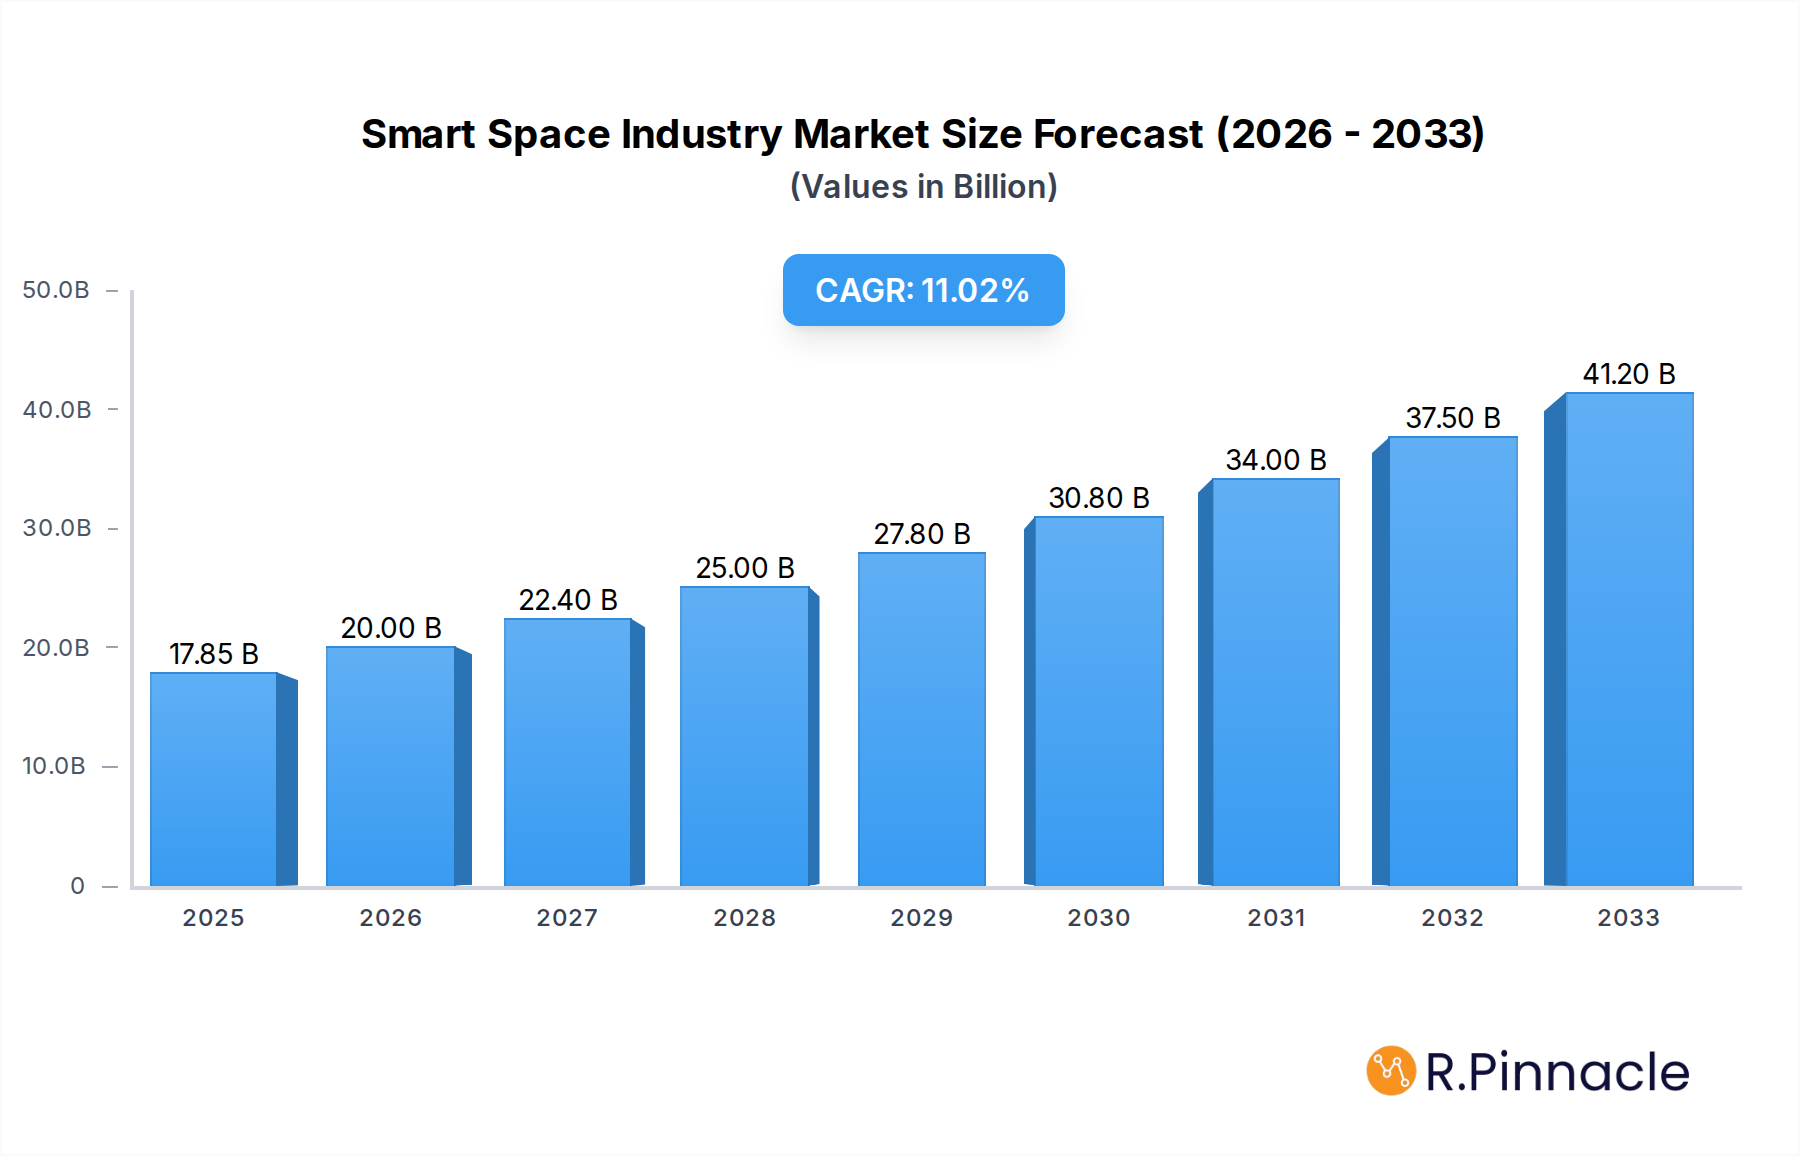
Smart Space Industry Market Size (In Billion)
The industry's trajectory is further shaped by significant trends such as the convergence of AI and machine learning with smart building platforms, enabling predictive maintenance and personalized occupant experiences. The rise of advanced sensor technologies and data analytics platforms are also pivotal in unlocking the full potential of smart spaces. While the market demonstrates immense promise, certain restraints, such as the initial high cost of implementation and concerns surrounding data privacy and cybersecurity, need to be strategically addressed by industry players. However, the compelling value proposition of cost savings, improved safety, and enhanced user experience continues to outweigh these challenges, driving sustained market momentum. Leading companies like Siemens AG, Microsoft Corporation, and ABB Ltd are actively innovating and expanding their portfolios to capture a significant share of this dynamic and rapidly evolving market. Regional market analysis indicates strong adoption across North America and Europe, with Asia Pacific emerging as a high-growth potential region.

Smart Space Industry Company Market Share
This comprehensive report delves into the dynamic Smart Space Industry, providing in-depth analysis and actionable insights for industry professionals. Covering a study period from 2019 to 2033, with a base year of 2025, this report examines market structure, dynamics, regional dominance, product innovations, key drivers, challenges, emerging opportunities, and future outlook. We leverage a wealth of data to offer a clear understanding of the market landscape, including key players like ICONICS Inc, ABB Ltd, Microsoft Corporation, Cisco Systems Inc, Siemens AG, Hitachi Vantara Corporation, SmartSpace Software PLC, Ubisense Limited, Spacewell Faseas (Nemetschek Group), and Adappt Intelligence Inc.
Smart Space Industry Market Structure & Innovation Trends
The Smart Space Industry exhibits a moderately concentrated market structure, with key players like Siemens AG and Microsoft Corporation holding significant market share, estimated to be in the billions. Innovation is primarily driven by advancements in IoT, AI, and cloud computing, enabling sophisticated data analytics and automation solutions. Regulatory frameworks are evolving to support data privacy and interoperability, though regional disparities exist. Product substitutes are emerging in the form of integrated building management systems and specialized IoT platforms. End-user demographics span commercial enterprises, residential consumers, and industrial sectors, each with unique adoption drivers. Mergers and acquisitions (M&A) are active, with significant deal values in the billions, driven by the pursuit of technological integration and market expansion. For example, recent M&A activities have seen companies acquiring specialized AI capabilities or expanding their geographic reach, indicating a strategic consolidation phase.
Smart Space Industry Market Dynamics & Trends
The Smart Space Industry is experiencing robust growth, projected to expand at a Compound Annual Growth Rate (CAGR) of approximately 15% over the forecast period. This expansion is fueled by increasing demand for energy efficiency, enhanced occupant comfort, and improved operational productivity across various sectors. Technological disruptions, particularly the proliferation of 5G networks, edge computing, and advanced sensor technologies, are enabling more intelligent and responsive smart space solutions. Consumer preferences are shifting towards personalized environments and seamless integration of smart devices, driving the adoption of user-centric smart space applications. Competitive dynamics are intensifying, with established technology giants and agile startups vying for market leadership. Market penetration for smart building solutions in the commercial sector is projected to reach over 70% by 2033, while the residential sector is expected to see a CAGR of 18% driven by smart home ecosystem adoption. The industrial sector's adoption is driven by the need for predictive maintenance and automated process optimization, with an estimated market size of over fifty billion by the end of the forecast period.
Dominant Regions & Segments in Smart Space Industry
North America currently dominates the Smart Space Industry, with the United States leading in market size and adoption rates, estimated to be in the hundreds of billions. This dominance is attributed to strong economic policies favoring technological innovation, extensive existing infrastructure, and a high concentration of early adopters. The commercial end-user industry segment is the largest, accounting for an estimated 60% of the market share, driven by smart office solutions, retail analytics, and smart healthcare facilities. Key drivers for this dominance include corporate investments in operational efficiency and employee well-being.
- Commercial End-User Industry: Characterized by its adoption of smart building management systems, intelligent lighting, HVAC control, and security solutions. The demand for enhanced workspace experience and cost reduction fuels its growth.
- Services Segment: This segment is witnessing significant growth, driven by the increasing need for installation, integration, maintenance, and data analytics services. The complexity of smart space deployments necessitates expert support.
- Solutions Segment: This segment encompasses a wide range of hardware and software, including IoT platforms, AI-powered analytics, and connectivity devices. The innovation in this segment directly impacts the capabilities of smart spaces.
Smart Space Industry Product Innovations
Product innovations in the Smart Space Industry are largely focused on enhancing interoperability, personalization, and predictive capabilities. AI-driven analytics are becoming integral, enabling systems to learn user behavior and optimize environments proactively. Developments in advanced sensor technology are improving data accuracy and enabling real-time monitoring of a wider range of parameters, from air quality to occupancy. Competitive advantages are being achieved through seamless integration across diverse devices and platforms, offering a unified user experience. The market is also seeing a rise in specialized solutions tailored for specific industries, such as smart retail analytics and smart manufacturing automation.
Report Scope & Segmentation Analysis
This report provides a granular analysis of the Smart Space Industry segmented by Type and End-user Industry.
- Solutions: This segment, encompassing hardware and software components, is projected to reach a market size of over two hundred billion by 2033, driven by continuous technological advancements.
- Services: The services segment, including installation, maintenance, and consulting, is expected to exhibit a CAGR of 16%, reaching a market value of over one hundred billion by 2033.
- Commercial: Dominating the market, the commercial sector's market size is estimated to exceed three hundred billion by 2033, fueled by smart office and retail solutions.
- Residential: The residential segment is anticipated to grow at a CAGR of 18%, with its market size projected to reach over one hundred fifty billion by 2033, driven by smart home adoption.
Key Drivers of Smart Space Industry Growth
The growth of the Smart Space Industry is propelled by several converging factors. Technological advancements, particularly in the Internet of Things (IoT), Artificial Intelligence (AI), and 5G connectivity, are fundamental enablers, facilitating data collection, analysis, and automation. Economic incentives, such as the drive for energy efficiency and reduced operational costs in commercial and industrial settings, play a crucial role. Regulatory mandates and sustainability initiatives are also pushing for smarter, more resource-efficient building designs and operations. Furthermore, increasing consumer demand for comfort, convenience, and enhanced user experiences in both residential and commercial spaces is a significant catalyst.
Challenges in the Smart Space Industry Sector
Despite its promising growth, the Smart Space Industry faces several significant challenges. Regulatory hurdles, particularly concerning data privacy, security, and interoperability standards across diverse platforms, can slow down adoption. High initial implementation costs for comprehensive smart space solutions can be a barrier for small and medium-sized enterprises. Supply chain issues, exacerbated by global geopolitical factors, can impact the availability and cost of critical hardware components. Intense competitive pressures, with numerous players vying for market share, can lead to price wars and affect profitability. Cybersecurity threats and the potential for data breaches also pose a significant concern for widespread adoption, requiring robust security measures.
Emerging Opportunities in Smart Space Industry
The Smart Space Industry is ripe with emerging opportunities. The growing demand for sustainable and green buildings is creating a niche for smart energy management solutions. The expansion of the Internet of Things (IoT) ecosystem, coupled with advancements in edge computing, will enable more localized and real-time decision-making within smart spaces. The increasing adoption of hybrid work models is driving the need for intelligent and adaptable office environments that prioritize employee well-being and productivity. Furthermore, the development of AI-driven predictive maintenance for building systems presents a significant opportunity to reduce downtime and operational costs. The integration of smart spaces with smart city initiatives offers a vast landscape for future growth and innovation.
Leading Players in the Smart Space Industry Market
- ICONICS Inc
- ABB Ltd
- Microsoft Corporation
- Cisco Systems Inc
- Siemens AG
- Hitachi Vantara Corporation
- SmartSpace Software PLC
- Ubisense Limited
- Spacewell Faseas (Nemetschek Group)
- Adappt Intelligence Inc
Key Developments in Smart Space Industry Industry
- 2023 October: Siemens AG announced a strategic partnership with Microsoft Corporation to accelerate the digital transformation of the manufacturing industry, integrating their respective IoT platforms and cloud solutions.
- 2023 September: Cisco Systems Inc launched its new range of IoT networking solutions designed to enhance the connectivity and security of smart building infrastructure.
- 2023 August: ICONICS Inc unveiled its latest analytics suite for smart spaces, incorporating advanced AI algorithms for predictive maintenance and energy optimization.
- 2023 July: SmartSpace Software PLC acquired a key technology provider, expanding its capabilities in real-time location services and asset tracking within smart environments.
- 2023 June: Hitachi Vantara Corporation announced a significant investment in developing new IoT solutions for smart city applications, focusing on data analytics and sustainable urban development.
Future Outlook for Smart Space Industry Market
The future outlook for the Smart Space Industry is exceptionally bright, characterized by accelerated growth and transformative innovation. The continued integration of AI and machine learning will lead to more autonomous and self-optimizing smart spaces. The expansion of 5G and the development of Wi-Fi 7 will provide the robust connectivity required for massive IoT deployments. Smart spaces will become increasingly personalized, adapting to individual user preferences and needs in real-time. The convergence of smart buildings and smart cities will unlock new levels of efficiency and sustainability in urban environments. Strategic opportunities lie in developing scalable, secure, and interoperable solutions that cater to the evolving demands of commercial, residential, and industrial sectors, promising market expansion into the trillions.
Smart Space Industry Segmentation
-
1. Type
- 1.1. Solutions
- 1.2. Services
-
2. End-user Industry
- 2.1. Commercial
- 2.2. Residential
Smart Space Industry Segmentation By Geography
- 1. North America
- 2. Europe
- 3. Asia Pacific
- 4. Latin America
- 5. Middle East
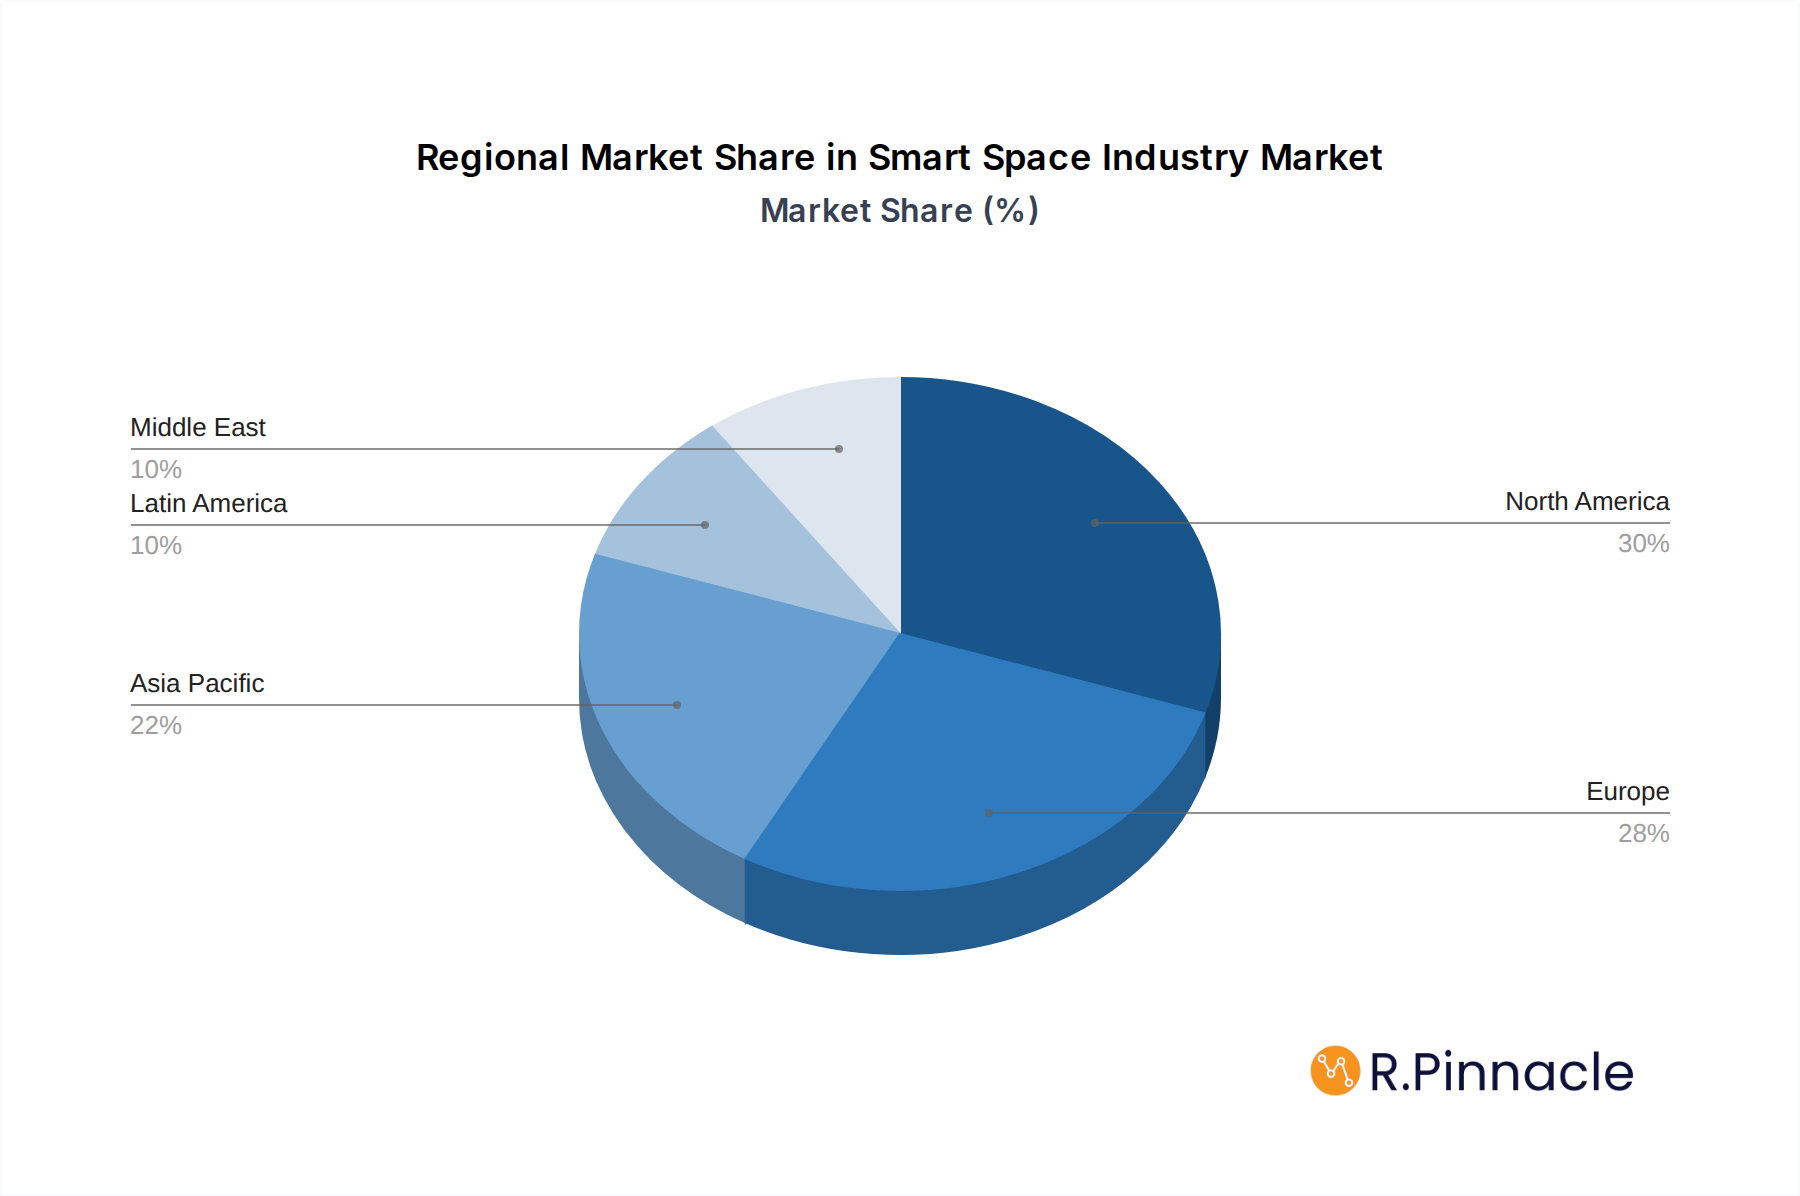
Smart Space Industry Regional Market Share
Geographic Coverage of Smart Space Industry
Smart Space Industry REPORT HIGHLIGHTS
| Aspects | Details |
|---|---|
| Study Period | 2020-2034 |
| Base Year | 2025 |
| Estimated Year | 2026 |
| Forecast Period | 2026-2034 |
| Historical Period | 2020-2025 |
| Growth Rate | CAGR of 11.9% from 2020-2034 |
| Segmentation |
|
Table of Contents
- 1. Introduction
- 1.1. Research Scope
- 1.2. Market Segmentation
- 1.3. Research Objective
- 1.4. Definitions and Assumptions
- 2. Executive Summary
- 2.1. Market Snapshot
- 3. Market Dynamics
- 3.1. Market Drivers
- 3.2. Market Restrains
- 3.3. Market Trends
- 3.4. Market Opportunities
- 4. Market Factor Analysis
- 4.1. Porters Five Forces
- 4.1.1. Bargaining Power of Suppliers
- 4.1.2. Bargaining Power of Buyers
- 4.1.3. Threat of New Entrants
- 4.1.4. Threat of Substitutes
- 4.1.5. Competitive Rivalry
- 4.2. PESTEL analysis
- 4.3. BCG Analysis
- 4.3.1. Stars (High Growth, High Market Share)
- 4.3.2. Cash Cows (Low Growth, High Market Share)
- 4.3.3. Question Mark (High Growth, Low Market Share)
- 4.3.4. Dogs (Low Growth, Low Market Share)
- 4.4. Ansoff Matrix Analysis
- 4.5. Supply Chain Analysis
- 4.6. Regulatory Landscape
- 4.7. Current Market Potential and Opportunity Assessment (TAM–SAM–SOM Framework)
- 4.8. PRI Analyst Note
- 4.1. Porters Five Forces
- 5. Market Analysis, Insights and Forecast 2021-2033
- 5.1. Market Analysis, Insights and Forecast - by Type
- 5.1.1. Solutions
- 5.1.2. Services
- 5.2. Market Analysis, Insights and Forecast - by End-user Industry
- 5.2.1. Commercial
- 5.2.2. Residential
- 5.3. Market Analysis, Insights and Forecast - by Region
- 5.3.1. North America
- 5.3.2. Europe
- 5.3.3. Asia Pacific
- 5.3.4. Latin America
- 5.3.5. Middle East
- 5.1. Market Analysis, Insights and Forecast - by Type
- 6. Global Smart Space Industry Analysis, Insights and Forecast, 2021-2033
- 6.1. Market Analysis, Insights and Forecast - by Type
- 6.1.1. Solutions
- 6.1.2. Services
- 6.2. Market Analysis, Insights and Forecast - by End-user Industry
- 6.2.1. Commercial
- 6.2.2. Residential
- 6.1. Market Analysis, Insights and Forecast - by Type
- 7. North America Smart Space Industry Analysis, Insights and Forecast, 2020-2032
- 7.1. Market Analysis, Insights and Forecast - by Type
- 7.1.1. Solutions
- 7.1.2. Services
- 7.2. Market Analysis, Insights and Forecast - by End-user Industry
- 7.2.1. Commercial
- 7.2.2. Residential
- 7.1. Market Analysis, Insights and Forecast - by Type
- 8. Europe Smart Space Industry Analysis, Insights and Forecast, 2020-2032
- 8.1. Market Analysis, Insights and Forecast - by Type
- 8.1.1. Solutions
- 8.1.2. Services
- 8.2. Market Analysis, Insights and Forecast - by End-user Industry
- 8.2.1. Commercial
- 8.2.2. Residential
- 8.1. Market Analysis, Insights and Forecast - by Type
- 9. Asia Pacific Smart Space Industry Analysis, Insights and Forecast, 2020-2032
- 9.1. Market Analysis, Insights and Forecast - by Type
- 9.1.1. Solutions
- 9.1.2. Services
- 9.2. Market Analysis, Insights and Forecast - by End-user Industry
- 9.2.1. Commercial
- 9.2.2. Residential
- 9.1. Market Analysis, Insights and Forecast - by Type
- 10. Latin America Smart Space Industry Analysis, Insights and Forecast, 2020-2032
- 10.1. Market Analysis, Insights and Forecast - by Type
- 10.1.1. Solutions
- 10.1.2. Services
- 10.2. Market Analysis, Insights and Forecast - by End-user Industry
- 10.2.1. Commercial
- 10.2.2. Residential
- 10.1. Market Analysis, Insights and Forecast - by Type
- 11. Middle East Smart Space Industry Analysis, Insights and Forecast, 2020-2032
- 11.1. Market Analysis, Insights and Forecast - by Type
- 11.1.1. Solutions
- 11.1.2. Services
- 11.2. Market Analysis, Insights and Forecast - by End-user Industry
- 11.2.1. Commercial
- 11.2.2. Residential
- 11.1. Market Analysis, Insights and Forecast - by Type
- 12. Competitive Analysis
- 12.1. Company Profiles
- 12.1.1 ICONICS Inc
- 12.1.1.1. Company Overview
- 12.1.1.2. Products
- 12.1.1.3. Company Financials
- 12.1.1.4. SWOT Analysis
- 12.1.2 ABB Ltd
- 12.1.2.1. Company Overview
- 12.1.2.2. Products
- 12.1.2.3. Company Financials
- 12.1.2.4. SWOT Analysis
- 12.1.3 Microsoft Corporation
- 12.1.3.1. Company Overview
- 12.1.3.2. Products
- 12.1.3.3. Company Financials
- 12.1.3.4. SWOT Analysis
- 12.1.4 Cisco Systems Inc
- 12.1.4.1. Company Overview
- 12.1.4.2. Products
- 12.1.4.3. Company Financials
- 12.1.4.4. SWOT Analysis
- 12.1.5 Siemens AG
- 12.1.5.1. Company Overview
- 12.1.5.2. Products
- 12.1.5.3. Company Financials
- 12.1.5.4. SWOT Analysis
- 12.1.6 Hitachi Vantara Corporation
- 12.1.6.1. Company Overview
- 12.1.6.2. Products
- 12.1.6.3. Company Financials
- 12.1.6.4. SWOT Analysis
- 12.1.7 SmartSpace Software PLC
- 12.1.7.1. Company Overview
- 12.1.7.2. Products
- 12.1.7.3. Company Financials
- 12.1.7.4. SWOT Analysis
- 12.1.8 Ubisense Limited
- 12.1.8.1. Company Overview
- 12.1.8.2. Products
- 12.1.8.3. Company Financials
- 12.1.8.4. SWOT Analysis
- 12.1.9 Spacewell Faseas (Nemetschek Group)
- 12.1.9.1. Company Overview
- 12.1.9.2. Products
- 12.1.9.3. Company Financials
- 12.1.9.4. SWOT Analysis
- 12.1.10 Adappt Intelligence Inc
- 12.1.10.1. Company Overview
- 12.1.10.2. Products
- 12.1.10.3. Company Financials
- 12.1.10.4. SWOT Analysis
- 12.1.1 ICONICS Inc
- 12.2. Market Entropy
- 12.2.1 Company's Key Areas Served
- 12.2.2 Recent Developments
- 12.3. Company Market Share Analysis 2025
- 12.3.1 Top 5 Companies Market Share Analysis
- 12.3.2 Top 3 Companies Market Share Analysis
- 12.4. List of Potential Customers
- 13. Research Methodology
List of Figures
- Figure 1: Global Smart Space Industry Revenue Breakdown (billion, %) by Region 2025 & 2033
- Figure 2: Global Smart Space Industry Volume Breakdown (K Unit, %) by Region 2025 & 2033
- Figure 3: North America Smart Space Industry Revenue (billion), by Type 2025 & 2033
- Figure 4: North America Smart Space Industry Volume (K Unit), by Type 2025 & 2033
- Figure 5: North America Smart Space Industry Revenue Share (%), by Type 2025 & 2033
- Figure 6: North America Smart Space Industry Volume Share (%), by Type 2025 & 2033
- Figure 7: North America Smart Space Industry Revenue (billion), by End-user Industry 2025 & 2033
- Figure 8: North America Smart Space Industry Volume (K Unit), by End-user Industry 2025 & 2033
- Figure 9: North America Smart Space Industry Revenue Share (%), by End-user Industry 2025 & 2033
- Figure 10: North America Smart Space Industry Volume Share (%), by End-user Industry 2025 & 2033
- Figure 11: North America Smart Space Industry Revenue (billion), by Country 2025 & 2033
- Figure 12: North America Smart Space Industry Volume (K Unit), by Country 2025 & 2033
- Figure 13: North America Smart Space Industry Revenue Share (%), by Country 2025 & 2033
- Figure 14: North America Smart Space Industry Volume Share (%), by Country 2025 & 2033
- Figure 15: Europe Smart Space Industry Revenue (billion), by Type 2025 & 2033
- Figure 16: Europe Smart Space Industry Volume (K Unit), by Type 2025 & 2033
- Figure 17: Europe Smart Space Industry Revenue Share (%), by Type 2025 & 2033
- Figure 18: Europe Smart Space Industry Volume Share (%), by Type 2025 & 2033
- Figure 19: Europe Smart Space Industry Revenue (billion), by End-user Industry 2025 & 2033
- Figure 20: Europe Smart Space Industry Volume (K Unit), by End-user Industry 2025 & 2033
- Figure 21: Europe Smart Space Industry Revenue Share (%), by End-user Industry 2025 & 2033
- Figure 22: Europe Smart Space Industry Volume Share (%), by End-user Industry 2025 & 2033
- Figure 23: Europe Smart Space Industry Revenue (billion), by Country 2025 & 2033
- Figure 24: Europe Smart Space Industry Volume (K Unit), by Country 2025 & 2033
- Figure 25: Europe Smart Space Industry Revenue Share (%), by Country 2025 & 2033
- Figure 26: Europe Smart Space Industry Volume Share (%), by Country 2025 & 2033
- Figure 27: Asia Pacific Smart Space Industry Revenue (billion), by Type 2025 & 2033
- Figure 28: Asia Pacific Smart Space Industry Volume (K Unit), by Type 2025 & 2033
- Figure 29: Asia Pacific Smart Space Industry Revenue Share (%), by Type 2025 & 2033
- Figure 30: Asia Pacific Smart Space Industry Volume Share (%), by Type 2025 & 2033
- Figure 31: Asia Pacific Smart Space Industry Revenue (billion), by End-user Industry 2025 & 2033
- Figure 32: Asia Pacific Smart Space Industry Volume (K Unit), by End-user Industry 2025 & 2033
- Figure 33: Asia Pacific Smart Space Industry Revenue Share (%), by End-user Industry 2025 & 2033
- Figure 34: Asia Pacific Smart Space Industry Volume Share (%), by End-user Industry 2025 & 2033
- Figure 35: Asia Pacific Smart Space Industry Revenue (billion), by Country 2025 & 2033
- Figure 36: Asia Pacific Smart Space Industry Volume (K Unit), by Country 2025 & 2033
- Figure 37: Asia Pacific Smart Space Industry Revenue Share (%), by Country 2025 & 2033
- Figure 38: Asia Pacific Smart Space Industry Volume Share (%), by Country 2025 & 2033
- Figure 39: Latin America Smart Space Industry Revenue (billion), by Type 2025 & 2033
- Figure 40: Latin America Smart Space Industry Volume (K Unit), by Type 2025 & 2033
- Figure 41: Latin America Smart Space Industry Revenue Share (%), by Type 2025 & 2033
- Figure 42: Latin America Smart Space Industry Volume Share (%), by Type 2025 & 2033
- Figure 43: Latin America Smart Space Industry Revenue (billion), by End-user Industry 2025 & 2033
- Figure 44: Latin America Smart Space Industry Volume (K Unit), by End-user Industry 2025 & 2033
- Figure 45: Latin America Smart Space Industry Revenue Share (%), by End-user Industry 2025 & 2033
- Figure 46: Latin America Smart Space Industry Volume Share (%), by End-user Industry 2025 & 2033
- Figure 47: Latin America Smart Space Industry Revenue (billion), by Country 2025 & 2033
- Figure 48: Latin America Smart Space Industry Volume (K Unit), by Country 2025 & 2033
- Figure 49: Latin America Smart Space Industry Revenue Share (%), by Country 2025 & 2033
- Figure 50: Latin America Smart Space Industry Volume Share (%), by Country 2025 & 2033
- Figure 51: Middle East Smart Space Industry Revenue (billion), by Type 2025 & 2033
- Figure 52: Middle East Smart Space Industry Volume (K Unit), by Type 2025 & 2033
- Figure 53: Middle East Smart Space Industry Revenue Share (%), by Type 2025 & 2033
- Figure 54: Middle East Smart Space Industry Volume Share (%), by Type 2025 & 2033
- Figure 55: Middle East Smart Space Industry Revenue (billion), by End-user Industry 2025 & 2033
- Figure 56: Middle East Smart Space Industry Volume (K Unit), by End-user Industry 2025 & 2033
- Figure 57: Middle East Smart Space Industry Revenue Share (%), by End-user Industry 2025 & 2033
- Figure 58: Middle East Smart Space Industry Volume Share (%), by End-user Industry 2025 & 2033
- Figure 59: Middle East Smart Space Industry Revenue (billion), by Country 2025 & 2033
- Figure 60: Middle East Smart Space Industry Volume (K Unit), by Country 2025 & 2033
- Figure 61: Middle East Smart Space Industry Revenue Share (%), by Country 2025 & 2033
- Figure 62: Middle East Smart Space Industry Volume Share (%), by Country 2025 & 2033
List of Tables
- Table 1: Global Smart Space Industry Revenue billion Forecast, by Type 2020 & 2033
- Table 2: Global Smart Space Industry Volume K Unit Forecast, by Type 2020 & 2033
- Table 3: Global Smart Space Industry Revenue billion Forecast, by End-user Industry 2020 & 2033
- Table 4: Global Smart Space Industry Volume K Unit Forecast, by End-user Industry 2020 & 2033
- Table 5: Global Smart Space Industry Revenue billion Forecast, by Region 2020 & 2033
- Table 6: Global Smart Space Industry Volume K Unit Forecast, by Region 2020 & 2033
- Table 7: Global Smart Space Industry Revenue billion Forecast, by Type 2020 & 2033
- Table 8: Global Smart Space Industry Volume K Unit Forecast, by Type 2020 & 2033
- Table 9: Global Smart Space Industry Revenue billion Forecast, by End-user Industry 2020 & 2033
- Table 10: Global Smart Space Industry Volume K Unit Forecast, by End-user Industry 2020 & 2033
- Table 11: Global Smart Space Industry Revenue billion Forecast, by Country 2020 & 2033
- Table 12: Global Smart Space Industry Volume K Unit Forecast, by Country 2020 & 2033
- Table 13: Global Smart Space Industry Revenue billion Forecast, by Type 2020 & 2033
- Table 14: Global Smart Space Industry Volume K Unit Forecast, by Type 2020 & 2033
- Table 15: Global Smart Space Industry Revenue billion Forecast, by End-user Industry 2020 & 2033
- Table 16: Global Smart Space Industry Volume K Unit Forecast, by End-user Industry 2020 & 2033
- Table 17: Global Smart Space Industry Revenue billion Forecast, by Country 2020 & 2033
- Table 18: Global Smart Space Industry Volume K Unit Forecast, by Country 2020 & 2033
- Table 19: Global Smart Space Industry Revenue billion Forecast, by Type 2020 & 2033
- Table 20: Global Smart Space Industry Volume K Unit Forecast, by Type 2020 & 2033
- Table 21: Global Smart Space Industry Revenue billion Forecast, by End-user Industry 2020 & 2033
- Table 22: Global Smart Space Industry Volume K Unit Forecast, by End-user Industry 2020 & 2033
- Table 23: Global Smart Space Industry Revenue billion Forecast, by Country 2020 & 2033
- Table 24: Global Smart Space Industry Volume K Unit Forecast, by Country 2020 & 2033
- Table 25: Global Smart Space Industry Revenue billion Forecast, by Type 2020 & 2033
- Table 26: Global Smart Space Industry Volume K Unit Forecast, by Type 2020 & 2033
- Table 27: Global Smart Space Industry Revenue billion Forecast, by End-user Industry 2020 & 2033
- Table 28: Global Smart Space Industry Volume K Unit Forecast, by End-user Industry 2020 & 2033
- Table 29: Global Smart Space Industry Revenue billion Forecast, by Country 2020 & 2033
- Table 30: Global Smart Space Industry Volume K Unit Forecast, by Country 2020 & 2033
- Table 31: Global Smart Space Industry Revenue billion Forecast, by Type 2020 & 2033
- Table 32: Global Smart Space Industry Volume K Unit Forecast, by Type 2020 & 2033
- Table 33: Global Smart Space Industry Revenue billion Forecast, by End-user Industry 2020 & 2033
- Table 34: Global Smart Space Industry Volume K Unit Forecast, by End-user Industry 2020 & 2033
- Table 35: Global Smart Space Industry Revenue billion Forecast, by Country 2020 & 2033
- Table 36: Global Smart Space Industry Volume K Unit Forecast, by Country 2020 & 2033
Frequently Asked Questions
1. What is the projected Compound Annual Growth Rate (CAGR) of the Smart Space Industry?
The projected CAGR is approximately 11.9%.
2. Which companies are prominent players in the Smart Space Industry?
Key companies in the market include ICONICS Inc, ABB Ltd, Microsoft Corporation, Cisco Systems Inc, Siemens AG, Hitachi Vantara Corporation, SmartSpace Software PLC, Ubisense Limited, Spacewell Faseas (Nemetschek Group), Adappt Intelligence Inc.
3. What are the main segments of the Smart Space Industry?
The market segments include Type, End-user Industry.
4. Can you provide details about the market size?
The market size is estimated to be USD 17.85 billion as of 2022.
5. What are some drivers contributing to market growth?
; Increasing Adoption of IoT; Increasing Urban Population.
6. What are the notable trends driving market growth?
Commercial Segment Estimated to Hold the Largest Market Share.
7. Are there any restraints impacting market growth?
; High Initial Infrastructure Expenditure.
8. Can you provide examples of recent developments in the market?
N/A
9. What pricing options are available for accessing the report?
Pricing options include single-user, multi-user, and enterprise licenses priced at USD 4750, USD 5250, and USD 8750 respectively.
10. Is the market size provided in terms of value or volume?
The market size is provided in terms of value, measured in billion and volume, measured in K Unit.
11. Are there any specific market keywords associated with the report?
Yes, the market keyword associated with the report is "Smart Space Industry," which aids in identifying and referencing the specific market segment covered.
12. How do I determine which pricing option suits my needs best?
The pricing options vary based on user requirements and access needs. Individual users may opt for single-user licenses, while businesses requiring broader access may choose multi-user or enterprise licenses for cost-effective access to the report.
13. Are there any additional resources or data provided in the Smart Space Industry report?
While the report offers comprehensive insights, it's advisable to review the specific contents or supplementary materials provided to ascertain if additional resources or data are available.
14. How can I stay updated on further developments or reports in the Smart Space Industry?
To stay informed about further developments, trends, and reports in the Smart Space Industry, consider subscribing to industry newsletters, following relevant companies and organizations, or regularly checking reputable industry news sources and publications.
Methodology
Step 1 - Identification of Relevant Samples Size from Population Database


Step 2 - Approaches for Defining Global Market Size (Value, Volume* & Price*)

Note*: In applicable scenarios
Step 3 - Data Sources
Primary Research
- Web Analytics
- Survey Reports
- Research Institute
- Latest Research Reports
- Opinion Leaders
Secondary Research
- Annual Reports
- White Paper
- Latest Press Release
- Industry Association
- Paid Database
- Investor Presentations

Step 4 - Data Triangulation
Involves using different sources of information in order to increase the validity of a study
These sources are likely to be stakeholders in a program - participants, other researchers, program staff, other community members, and so on.
Then we put all data in single framework & apply various statistical tools to find out the dynamic on the market.
During the analysis stage, feedback from the stakeholder groups would be compared to determine areas of agreement as well as areas of divergence