

Key Insights
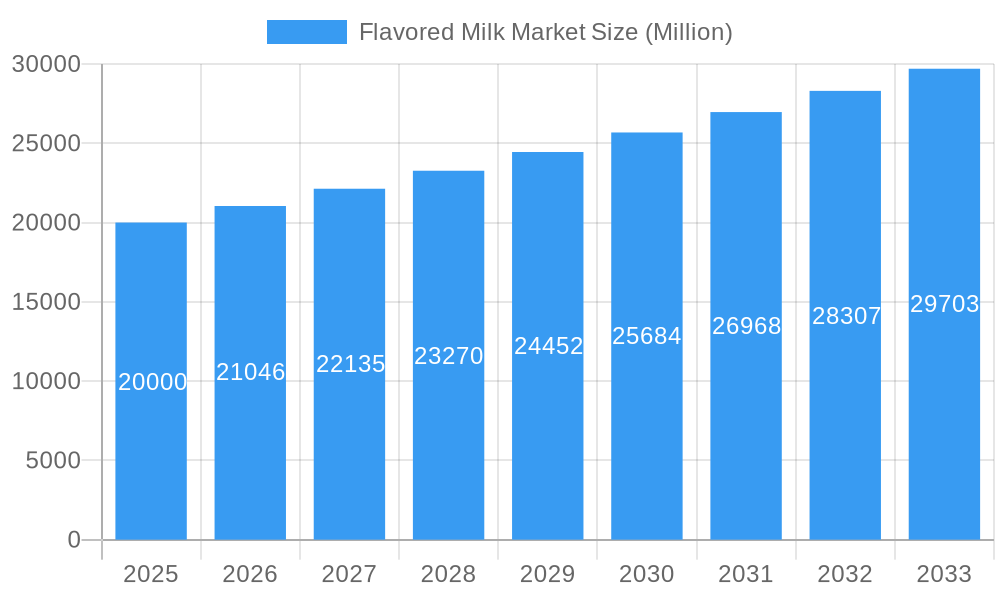
The global flavored milk market, valued at $59.07 billion in 2025, is projected for significant expansion, driven by a compound annual growth rate (CAGR) of 7.1% from 2025 to 2033. Key growth drivers include rising consumer demand for convenient, nutritious beverages, especially among younger demographics, and the increasing popularity of plant-based alternatives catering to health-conscious consumers and dietary needs. Innovations in flavor profiles, functional ingredients, and diverse product formulations also contribute to market growth. Strategic alliances between established dairy and emerging plant-based producers are enhancing distribution and brand visibility. While challenges like fluctuating raw material prices and concerns over added sugar exist, the market outlook remains positive. Segmentation includes distribution channels (supermarkets, convenience stores, specialist stores, online retail) and product types (dairy-based, plant-based). North America and Europe currently lead, with Asia-Pacific poised for substantial growth due to rising disposable incomes and evolving consumer preferences.
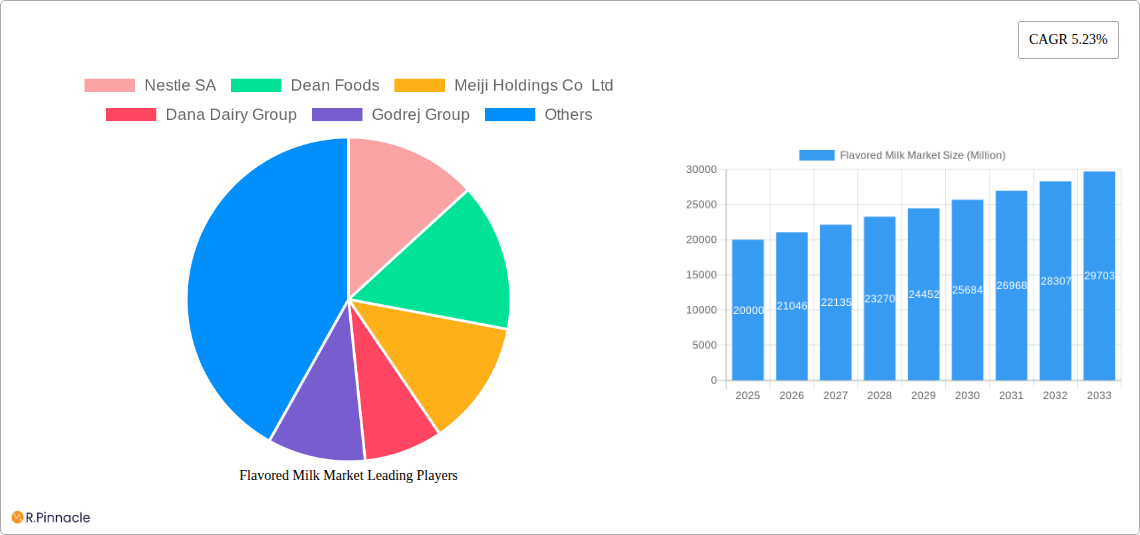
Flavored Milk Market Market Size (In Billion)
The competitive landscape features major players such as Nestle SA, Danone, and Coca-Cola, alongside numerous regional and niche brands, fostering intense competition and continuous product innovation. Dairy-based flavored milk currently holds dominance, though plant-based options are rapidly expanding due to growing vegan and vegetarian dietary trends. Future success hinges on adapting to consumer shifts towards healthier, lower-sugar options and implementing sustainable sourcing. Strategic marketing and R&D focused on novel flavors and health benefits will be critical for market players. This market analysis covers the period 2019-2033, with 2025 as the base year and a forecast for 2025-2033, detailing market dynamics, trends, and prospects. Market segmentation by distribution channel and product type provides detailed sizing and growth projections. Key company profiles include Nestle SA, Dean Foods, and Meiji Holdings Co Ltd, outlining their strategies and market positions.
Flavored Milk Market Company Market Share
Flavored Milk Market Structure & Innovation Trends
This section analyzes the competitive landscape of the flavored milk market, exploring market concentration, innovation drivers, regulatory frameworks, product substitutes, end-user demographics, and M&A activities. The market is moderately concentrated, with key players holding significant market share. For example, Nestle SA holds an estimated xx% market share in 2025, while Dean Foods holds approximately xx%. Innovation is driven by consumer demand for healthier and more diverse flavors, with companies investing in research and development to introduce new products. Regulatory frameworks vary by region, impacting product composition and labeling requirements. Plant-based alternatives are emerging as significant substitutes, driving competition and innovation. M&A activities have been moderate, with total deal values estimated at xx Million in the period 2019-2024.
- Market Concentration: Moderately concentrated with key players holding significant shares.
- Innovation Drivers: Healthier options, diverse flavors, and plant-based alternatives.
- Regulatory Frameworks: Vary by region, impacting product composition and labeling.
- Product Substitutes: Plant-based milks and other beverages.
- End-User Demographics: Primarily focused on children and young adults, with expanding appeal to health-conscious consumers.
- M&A Activity: Moderate activity with estimated total deal values of xx Million (2019-2024).
Flavored Milk Market Dynamics & Trends
The flavored milk market is experiencing significant growth, driven by several factors. Rising disposable incomes, particularly in developing economies, fuel increased demand for convenient and nutritious beverages. Changing consumer preferences toward healthier and more convenient options are driving growth in plant-based alternatives. Technological advancements in production and packaging are improving efficiency and product quality. The market exhibits a strong competitive landscape with established players and new entrants vying for market share. The CAGR for the global flavored milk market is projected to be xx% during the forecast period (2025-2033), with market penetration expected to reach xx% by 2033. The competitive landscape is dynamic, characterized by new product launches, strategic partnerships, and expansion into new markets.
Dominant Regions & Segments in Flavored Milk Market
The North American region currently dominates the flavored milk market, driven by high per capita consumption and strong brand presence. However, Asia-Pacific is projected to experience significant growth in the coming years.
- Leading Region: North America (driven by high consumption and strong brand presence).
- Fastest Growing Region: Asia-Pacific (driven by rising disposable incomes and population growth).
By Distribution Channel:
- Supermarkets/Hypermarkets: This segment holds the largest market share due to high availability and accessibility.
- Convenience Stores: A smaller share but with high growth potential due to impulse purchases.
- Online Retail Stores: Growing rapidly driven by the convenience of home delivery.
By Type:
- Dairy-Based: Holds the dominant market share due to established consumer preference.
- Plant-Based: Experiencing rapid growth due to increasing consumer demand for healthier and ethical options.
Flavored Milk Market Product Innovations
Recent years have witnessed significant innovations in the flavored milk market, including the introduction of new flavors catering to diverse preferences (e.g., Godrej's Nutty Badam), functional flavored milks enriched with added nutrients (e.g., a2 Milk Co. and Hershey's co-branded chocolate milk), and the use of sustainable packaging materials. These innovations reflect a market trend toward healthier, more convenient, and environmentally conscious products.
Report Scope & Segmentation Analysis
This report segments the flavored milk market by distribution channel (supermarkets/hypermarkets, convenience stores, specialist stores, online retail stores, other distribution channels) and by type (dairy-based, plant-based). Each segment is analyzed individually, providing detailed insights into market size, growth projections, and competitive dynamics. The report projects significant growth for both dairy-based and plant-based segments, with the plant-based segment exhibiting higher growth rates due to increasing health consciousness. Similarly, online retail channels are expected to experience rapid growth due to increasing e-commerce penetration.
Key Drivers of Flavored Milk Market Growth
Key drivers fueling the growth of the flavored milk market include rising disposable incomes, increasing health consciousness leading to demand for healthier options and functional benefits, changing consumer preferences towards convenient beverages, and the introduction of innovative flavors and packaging. Government initiatives promoting dairy consumption also play a role.
Challenges in the Flavored Milk Market Sector
Challenges include fluctuating raw material prices, increasing competition from alternative beverages, stringent regulatory requirements regarding labeling and ingredients, and potential supply chain disruptions impacting production and distribution. These factors can significantly impact profitability and market growth.
Emerging Opportunities in Flavored Milk Market
Emerging opportunities include expansion into untapped markets, particularly in developing economies, increasing demand for organic and ethically sourced products, exploring new flavor profiles and functional benefits, and leveraging e-commerce platforms for enhanced distribution.
Leading Players in the Flavored Milk Market Market
- Nestle SA
- Dean Foods
- Meiji Holdings Co Ltd
- Dana Dairy Group
- Godrej Group
- Hiland Dairy
- The Coca Cola Company
- Danone
- The Farmer's Cow
- Saputo Inc
- The Hershey Company
Key Developments in Flavored Milk Market Industry
- September 2022: Godrej Jersey launched Nutty Badam flavored milk, expanding its product portfolio.
- February 2022: a2 Milk Co. and The Hershey Co. launched a co-branded chocolate flavored milk.
- August 2021: Parle Agro launched Smoodh flavored milk in India.
Future Outlook for Flavored Milk Market Market
The flavored milk market is poised for continued growth, driven by innovation, expanding consumer preferences, and the rising popularity of plant-based options. Strategic partnerships, product diversification, and effective marketing campaigns will be crucial for success in this competitive landscape. The market is expected to witness substantial growth, driven by the factors mentioned previously, and presents significant opportunities for both established and emerging players.
Flavored Milk Market Segmentation
-
1. Type
- 1.1. Dairy Based
- 1.2. Plant Based
-
2. Distribution Channel
- 2.1. Supermarkets/Hypermarkets
- 2.2. Convenience Stores
- 2.3. Specialist Stores
- 2.4. Online Retail Stores
- 2.5. Other Distribution Channels
Flavored Milk Market Segmentation By Geography
-
1. North America
- 1.1. United States
- 1.2. Canada
- 1.3. Mexico
- 1.4. Rest of North America
-
2. Europe
- 2.1. Germany
- 2.2. United Kingdom
- 2.3. France
- 2.4. Italy
- 2.5. Spain
- 2.6. Russia
- 2.7. Rest of Europe
-
3. Asia Pacific
- 3.1. China
- 3.2. Japan
- 3.3. India
- 3.4. Australia
- 3.5. Rest of Asia Pacific
-
4. South America
- 4.1. Brazil
- 4.2. Argentina
- 4.3. Rest of South America
-
5. Middle East and Africa
- 5.1. United Arab Emirates
- 5.2. South Africa
- 5.3. Rest of Middle East and Africa
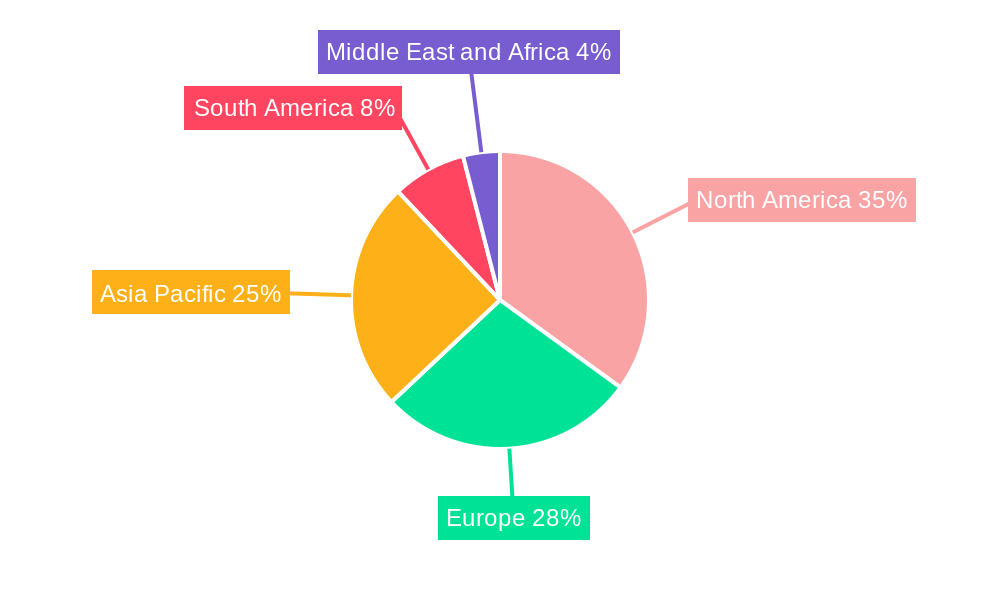
Flavored Milk Market Regional Market Share
Geographic Coverage of Flavored Milk Market
Flavored Milk Market REPORT HIGHLIGHTS
| Aspects | Details |
|---|---|
| Study Period | 2020-2034 |
| Base Year | 2025 |
| Estimated Year | 2026 |
| Forecast Period | 2026-2034 |
| Historical Period | 2020-2025 |
| Growth Rate | CAGR of 7.1% from 2020-2034 |
| Segmentation |
|
Table of Contents
- 1. Introduction
- 1.1. Research Scope
- 1.2. Market Segmentation
- 1.3. Research Objective
- 1.4. Definitions and Assumptions
- 2. Executive Summary
- 2.1. Market Snapshot
- 3. Market Dynamics
- 3.1. Market Drivers
- 3.2. Market Restrains
- 3.3. Market Trends
- 3.4. Market Opportunities
- 4. Market Factor Analysis
- 4.1. Porters Five Forces
- 4.1.1. Bargaining Power of Suppliers
- 4.1.2. Bargaining Power of Buyers
- 4.1.3. Threat of New Entrants
- 4.1.4. Threat of Substitutes
- 4.1.5. Competitive Rivalry
- 4.2. PESTEL analysis
- 4.3. BCG Analysis
- 4.3.1. Stars (High Growth, High Market Share)
- 4.3.2. Cash Cows (Low Growth, High Market Share)
- 4.3.3. Question Mark (High Growth, Low Market Share)
- 4.3.4. Dogs (Low Growth, Low Market Share)
- 4.4. Ansoff Matrix Analysis
- 4.5. Supply Chain Analysis
- 4.6. Regulatory Landscape
- 4.7. Current Market Potential and Opportunity Assessment (TAM–SAM–SOM Framework)
- 4.8. PRI Analyst Note
- 4.1. Porters Five Forces
- 5. Market Analysis, Insights and Forecast 2021-2033
- 5.1. Market Analysis, Insights and Forecast - by Type
- 5.1.1. Dairy Based
- 5.1.2. Plant Based
- 5.2. Market Analysis, Insights and Forecast - by Distribution Channel
- 5.2.1. Supermarkets/Hypermarkets
- 5.2.2. Convenience Stores
- 5.2.3. Specialist Stores
- 5.2.4. Online Retail Stores
- 5.2.5. Other Distribution Channels
- 5.3. Market Analysis, Insights and Forecast - by Region
- 5.3.1. North America
- 5.3.2. Europe
- 5.3.3. Asia Pacific
- 5.3.4. South America
- 5.3.5. Middle East and Africa
- 5.1. Market Analysis, Insights and Forecast - by Type
- 6. Global Flavored Milk Market Analysis, Insights and Forecast, 2021-2033
- 6.1. Market Analysis, Insights and Forecast - by Type
- 6.1.1. Dairy Based
- 6.1.2. Plant Based
- 6.2. Market Analysis, Insights and Forecast - by Distribution Channel
- 6.2.1. Supermarkets/Hypermarkets
- 6.2.2. Convenience Stores
- 6.2.3. Specialist Stores
- 6.2.4. Online Retail Stores
- 6.2.5. Other Distribution Channels
- 6.1. Market Analysis, Insights and Forecast - by Type
- 7. North America Flavored Milk Market Analysis, Insights and Forecast, 2020-2032
- 7.1. Market Analysis, Insights and Forecast - by Type
- 7.1.1. Dairy Based
- 7.1.2. Plant Based
- 7.2. Market Analysis, Insights and Forecast - by Distribution Channel
- 7.2.1. Supermarkets/Hypermarkets
- 7.2.2. Convenience Stores
- 7.2.3. Specialist Stores
- 7.2.4. Online Retail Stores
- 7.2.5. Other Distribution Channels
- 7.1. Market Analysis, Insights and Forecast - by Type
- 8. Europe Flavored Milk Market Analysis, Insights and Forecast, 2020-2032
- 8.1. Market Analysis, Insights and Forecast - by Type
- 8.1.1. Dairy Based
- 8.1.2. Plant Based
- 8.2. Market Analysis, Insights and Forecast - by Distribution Channel
- 8.2.1. Supermarkets/Hypermarkets
- 8.2.2. Convenience Stores
- 8.2.3. Specialist Stores
- 8.2.4. Online Retail Stores
- 8.2.5. Other Distribution Channels
- 8.1. Market Analysis, Insights and Forecast - by Type
- 9. Asia Pacific Flavored Milk Market Analysis, Insights and Forecast, 2020-2032
- 9.1. Market Analysis, Insights and Forecast - by Type
- 9.1.1. Dairy Based
- 9.1.2. Plant Based
- 9.2. Market Analysis, Insights and Forecast - by Distribution Channel
- 9.2.1. Supermarkets/Hypermarkets
- 9.2.2. Convenience Stores
- 9.2.3. Specialist Stores
- 9.2.4. Online Retail Stores
- 9.2.5. Other Distribution Channels
- 9.1. Market Analysis, Insights and Forecast - by Type
- 10. South America Flavored Milk Market Analysis, Insights and Forecast, 2020-2032
- 10.1. Market Analysis, Insights and Forecast - by Type
- 10.1.1. Dairy Based
- 10.1.2. Plant Based
- 10.2. Market Analysis, Insights and Forecast - by Distribution Channel
- 10.2.1. Supermarkets/Hypermarkets
- 10.2.2. Convenience Stores
- 10.2.3. Specialist Stores
- 10.2.4. Online Retail Stores
- 10.2.5. Other Distribution Channels
- 10.1. Market Analysis, Insights and Forecast - by Type
- 11. Middle East and Africa Flavored Milk Market Analysis, Insights and Forecast, 2020-2032
- 11.1. Market Analysis, Insights and Forecast - by Type
- 11.1.1. Dairy Based
- 11.1.2. Plant Based
- 11.2. Market Analysis, Insights and Forecast - by Distribution Channel
- 11.2.1. Supermarkets/Hypermarkets
- 11.2.2. Convenience Stores
- 11.2.3. Specialist Stores
- 11.2.4. Online Retail Stores
- 11.2.5. Other Distribution Channels
- 11.1. Market Analysis, Insights and Forecast - by Type
- 12. Competitive Analysis
- 12.1. Company Profiles
- 12.1.1 Nestle SA
- 12.1.1.1. Company Overview
- 12.1.1.2. Products
- 12.1.1.3. Company Financials
- 12.1.1.4. SWOT Analysis
- 12.1.2 Dean Foods
- 12.1.2.1. Company Overview
- 12.1.2.2. Products
- 12.1.2.3. Company Financials
- 12.1.2.4. SWOT Analysis
- 12.1.3 Meiji Holdings Co Ltd
- 12.1.3.1. Company Overview
- 12.1.3.2. Products
- 12.1.3.3. Company Financials
- 12.1.3.4. SWOT Analysis
- 12.1.4 Dana Dairy Group
- 12.1.4.1. Company Overview
- 12.1.4.2. Products
- 12.1.4.3. Company Financials
- 12.1.4.4. SWOT Analysis
- 12.1.5 Godrej Group
- 12.1.5.1. Company Overview
- 12.1.5.2. Products
- 12.1.5.3. Company Financials
- 12.1.5.4. SWOT Analysis
- 12.1.6 Hiland Dairy
- 12.1.6.1. Company Overview
- 12.1.6.2. Products
- 12.1.6.3. Company Financials
- 12.1.6.4. SWOT Analysis
- 12.1.7 The Coca Cola Company
- 12.1.7.1. Company Overview
- 12.1.7.2. Products
- 12.1.7.3. Company Financials
- 12.1.7.4. SWOT Analysis
- 12.1.8 Danone SANestle SA
- 12.1.8.1. Company Overview
- 12.1.8.2. Products
- 12.1.8.3. Company Financials
- 12.1.8.4. SWOT Analysis
- 12.1.9 The Farmer's Cow
- 12.1.9.1. Company Overview
- 12.1.9.2. Products
- 12.1.9.3. Company Financials
- 12.1.9.4. SWOT Analysis
- 12.1.10 Saputo Inc
- 12.1.10.1. Company Overview
- 12.1.10.2. Products
- 12.1.10.3. Company Financials
- 12.1.10.4. SWOT Analysis
- 12.1.11 The Hershey Company
- 12.1.11.1. Company Overview
- 12.1.11.2. Products
- 12.1.11.3. Company Financials
- 12.1.11.4. SWOT Analysis
- 12.1.1 Nestle SA
- 12.2. Market Entropy
- 12.2.1 Company's Key Areas Served
- 12.2.2 Recent Developments
- 12.3. Company Market Share Analysis 2025
- 12.3.1 Top 5 Companies Market Share Analysis
- 12.3.2 Top 3 Companies Market Share Analysis
- 12.4. List of Potential Customers
- 13. Research Methodology
List of Figures
- Figure 1: Global Flavored Milk Market Revenue Breakdown (billion, %) by Region 2025 & 2033
- Figure 2: North America Flavored Milk Market Revenue (billion), by Type 2025 & 2033
- Figure 3: North America Flavored Milk Market Revenue Share (%), by Type 2025 & 2033
- Figure 4: North America Flavored Milk Market Revenue (billion), by Distribution Channel 2025 & 2033
- Figure 5: North America Flavored Milk Market Revenue Share (%), by Distribution Channel 2025 & 2033
- Figure 6: North America Flavored Milk Market Revenue (billion), by Country 2025 & 2033
- Figure 7: North America Flavored Milk Market Revenue Share (%), by Country 2025 & 2033
- Figure 8: Europe Flavored Milk Market Revenue (billion), by Type 2025 & 2033
- Figure 9: Europe Flavored Milk Market Revenue Share (%), by Type 2025 & 2033
- Figure 10: Europe Flavored Milk Market Revenue (billion), by Distribution Channel 2025 & 2033
- Figure 11: Europe Flavored Milk Market Revenue Share (%), by Distribution Channel 2025 & 2033
- Figure 12: Europe Flavored Milk Market Revenue (billion), by Country 2025 & 2033
- Figure 13: Europe Flavored Milk Market Revenue Share (%), by Country 2025 & 2033
- Figure 14: Asia Pacific Flavored Milk Market Revenue (billion), by Type 2025 & 2033
- Figure 15: Asia Pacific Flavored Milk Market Revenue Share (%), by Type 2025 & 2033
- Figure 16: Asia Pacific Flavored Milk Market Revenue (billion), by Distribution Channel 2025 & 2033
- Figure 17: Asia Pacific Flavored Milk Market Revenue Share (%), by Distribution Channel 2025 & 2033
- Figure 18: Asia Pacific Flavored Milk Market Revenue (billion), by Country 2025 & 2033
- Figure 19: Asia Pacific Flavored Milk Market Revenue Share (%), by Country 2025 & 2033
- Figure 20: South America Flavored Milk Market Revenue (billion), by Type 2025 & 2033
- Figure 21: South America Flavored Milk Market Revenue Share (%), by Type 2025 & 2033
- Figure 22: South America Flavored Milk Market Revenue (billion), by Distribution Channel 2025 & 2033
- Figure 23: South America Flavored Milk Market Revenue Share (%), by Distribution Channel 2025 & 2033
- Figure 24: South America Flavored Milk Market Revenue (billion), by Country 2025 & 2033
- Figure 25: South America Flavored Milk Market Revenue Share (%), by Country 2025 & 2033
- Figure 26: Middle East and Africa Flavored Milk Market Revenue (billion), by Type 2025 & 2033
- Figure 27: Middle East and Africa Flavored Milk Market Revenue Share (%), by Type 2025 & 2033
- Figure 28: Middle East and Africa Flavored Milk Market Revenue (billion), by Distribution Channel 2025 & 2033
- Figure 29: Middle East and Africa Flavored Milk Market Revenue Share (%), by Distribution Channel 2025 & 2033
- Figure 30: Middle East and Africa Flavored Milk Market Revenue (billion), by Country 2025 & 2033
- Figure 31: Middle East and Africa Flavored Milk Market Revenue Share (%), by Country 2025 & 2033
List of Tables
- Table 1: Global Flavored Milk Market Revenue billion Forecast, by Type 2020 & 2033
- Table 2: Global Flavored Milk Market Revenue billion Forecast, by Distribution Channel 2020 & 2033
- Table 3: Global Flavored Milk Market Revenue billion Forecast, by Region 2020 & 2033
- Table 4: Global Flavored Milk Market Revenue billion Forecast, by Type 2020 & 2033
- Table 5: Global Flavored Milk Market Revenue billion Forecast, by Distribution Channel 2020 & 2033
- Table 6: Global Flavored Milk Market Revenue billion Forecast, by Country 2020 & 2033
- Table 7: United States Flavored Milk Market Revenue (billion) Forecast, by Application 2020 & 2033
- Table 8: Canada Flavored Milk Market Revenue (billion) Forecast, by Application 2020 & 2033
- Table 9: Mexico Flavored Milk Market Revenue (billion) Forecast, by Application 2020 & 2033
- Table 10: Rest of North America Flavored Milk Market Revenue (billion) Forecast, by Application 2020 & 2033
- Table 11: Global Flavored Milk Market Revenue billion Forecast, by Type 2020 & 2033
- Table 12: Global Flavored Milk Market Revenue billion Forecast, by Distribution Channel 2020 & 2033
- Table 13: Global Flavored Milk Market Revenue billion Forecast, by Country 2020 & 2033
- Table 14: Germany Flavored Milk Market Revenue (billion) Forecast, by Application 2020 & 2033
- Table 15: United Kingdom Flavored Milk Market Revenue (billion) Forecast, by Application 2020 & 2033
- Table 16: France Flavored Milk Market Revenue (billion) Forecast, by Application 2020 & 2033
- Table 17: Italy Flavored Milk Market Revenue (billion) Forecast, by Application 2020 & 2033
- Table 18: Spain Flavored Milk Market Revenue (billion) Forecast, by Application 2020 & 2033
- Table 19: Russia Flavored Milk Market Revenue (billion) Forecast, by Application 2020 & 2033
- Table 20: Rest of Europe Flavored Milk Market Revenue (billion) Forecast, by Application 2020 & 2033
- Table 21: Global Flavored Milk Market Revenue billion Forecast, by Type 2020 & 2033
- Table 22: Global Flavored Milk Market Revenue billion Forecast, by Distribution Channel 2020 & 2033
- Table 23: Global Flavored Milk Market Revenue billion Forecast, by Country 2020 & 2033
- Table 24: China Flavored Milk Market Revenue (billion) Forecast, by Application 2020 & 2033
- Table 25: Japan Flavored Milk Market Revenue (billion) Forecast, by Application 2020 & 2033
- Table 26: India Flavored Milk Market Revenue (billion) Forecast, by Application 2020 & 2033
- Table 27: Australia Flavored Milk Market Revenue (billion) Forecast, by Application 2020 & 2033
- Table 28: Rest of Asia Pacific Flavored Milk Market Revenue (billion) Forecast, by Application 2020 & 2033
- Table 29: Global Flavored Milk Market Revenue billion Forecast, by Type 2020 & 2033
- Table 30: Global Flavored Milk Market Revenue billion Forecast, by Distribution Channel 2020 & 2033
- Table 31: Global Flavored Milk Market Revenue billion Forecast, by Country 2020 & 2033
- Table 32: Brazil Flavored Milk Market Revenue (billion) Forecast, by Application 2020 & 2033
- Table 33: Argentina Flavored Milk Market Revenue (billion) Forecast, by Application 2020 & 2033
- Table 34: Rest of South America Flavored Milk Market Revenue (billion) Forecast, by Application 2020 & 2033
- Table 35: Global Flavored Milk Market Revenue billion Forecast, by Type 2020 & 2033
- Table 36: Global Flavored Milk Market Revenue billion Forecast, by Distribution Channel 2020 & 2033
- Table 37: Global Flavored Milk Market Revenue billion Forecast, by Country 2020 & 2033
- Table 38: United Arab Emirates Flavored Milk Market Revenue (billion) Forecast, by Application 2020 & 2033
- Table 39: South Africa Flavored Milk Market Revenue (billion) Forecast, by Application 2020 & 2033
- Table 40: Rest of Middle East and Africa Flavored Milk Market Revenue (billion) Forecast, by Application 2020 & 2033
Frequently Asked Questions
1. What is the projected Compound Annual Growth Rate (CAGR) of the Flavored Milk Market?
The projected CAGR is approximately 7.1%.
2. Which companies are prominent players in the Flavored Milk Market?
Key companies in the market include Nestle SA, Dean Foods, Meiji Holdings Co Ltd, Dana Dairy Group, Godrej Group, Hiland Dairy, The Coca Cola Company, Danone SANestle SA, The Farmer's Cow, Saputo Inc, The Hershey Company.
3. What are the main segments of the Flavored Milk Market?
The market segments include Type, Distribution Channel.
4. Can you provide details about the market size?
The market size is estimated to be USD 59.07 billion as of 2022.
5. What are some drivers contributing to market growth?
Demand for specialty and organic coffee pods and capsules; Innovations in packaging formats.
6. What are the notable trends driving market growth?
Surging Demand for Ready-To-Drink Beverages.
7. Are there any restraints impacting market growth?
Availability of counterfeit products.
8. Can you provide examples of recent developments in the market?
September 2022: Godrej Jersey expanded its product portfolio and launched a new flavored milk Nutty Badam in the market.
9. What pricing options are available for accessing the report?
Pricing options include single-user, multi-user, and enterprise licenses priced at USD 4750, USD 5250, and USD 8750 respectively.
10. Is the market size provided in terms of value or volume?
The market size is provided in terms of value, measured in billion.
11. Are there any specific market keywords associated with the report?
Yes, the market keyword associated with the report is "Flavored Milk Market," which aids in identifying and referencing the specific market segment covered.
12. How do I determine which pricing option suits my needs best?
The pricing options vary based on user requirements and access needs. Individual users may opt for single-user licenses, while businesses requiring broader access may choose multi-user or enterprise licenses for cost-effective access to the report.
13. Are there any additional resources or data provided in the Flavored Milk Market report?
While the report offers comprehensive insights, it's advisable to review the specific contents or supplementary materials provided to ascertain if additional resources or data are available.
14. How can I stay updated on further developments or reports in the Flavored Milk Market?
To stay informed about further developments, trends, and reports in the Flavored Milk Market, consider subscribing to industry newsletters, following relevant companies and organizations, or regularly checking reputable industry news sources and publications.
Methodology
Step 1 - Identification of Relevant Samples Size from Population Database


Step 2 - Approaches for Defining Global Market Size (Value, Volume* & Price*)

Note*: In applicable scenarios
Step 3 - Data Sources
Primary Research
- Web Analytics
- Survey Reports
- Research Institute
- Latest Research Reports
- Opinion Leaders
Secondary Research
- Annual Reports
- White Paper
- Latest Press Release
- Industry Association
- Paid Database
- Investor Presentations

Step 4 - Data Triangulation
Involves using different sources of information in order to increase the validity of a study
These sources are likely to be stakeholders in a program - participants, other researchers, program staff, other community members, and so on.
Then we put all data in single framework & apply various statistical tools to find out the dynamic on the market.
During the analysis stage, feedback from the stakeholder groups would be compared to determine areas of agreement as well as areas of divergence