

Key Insights
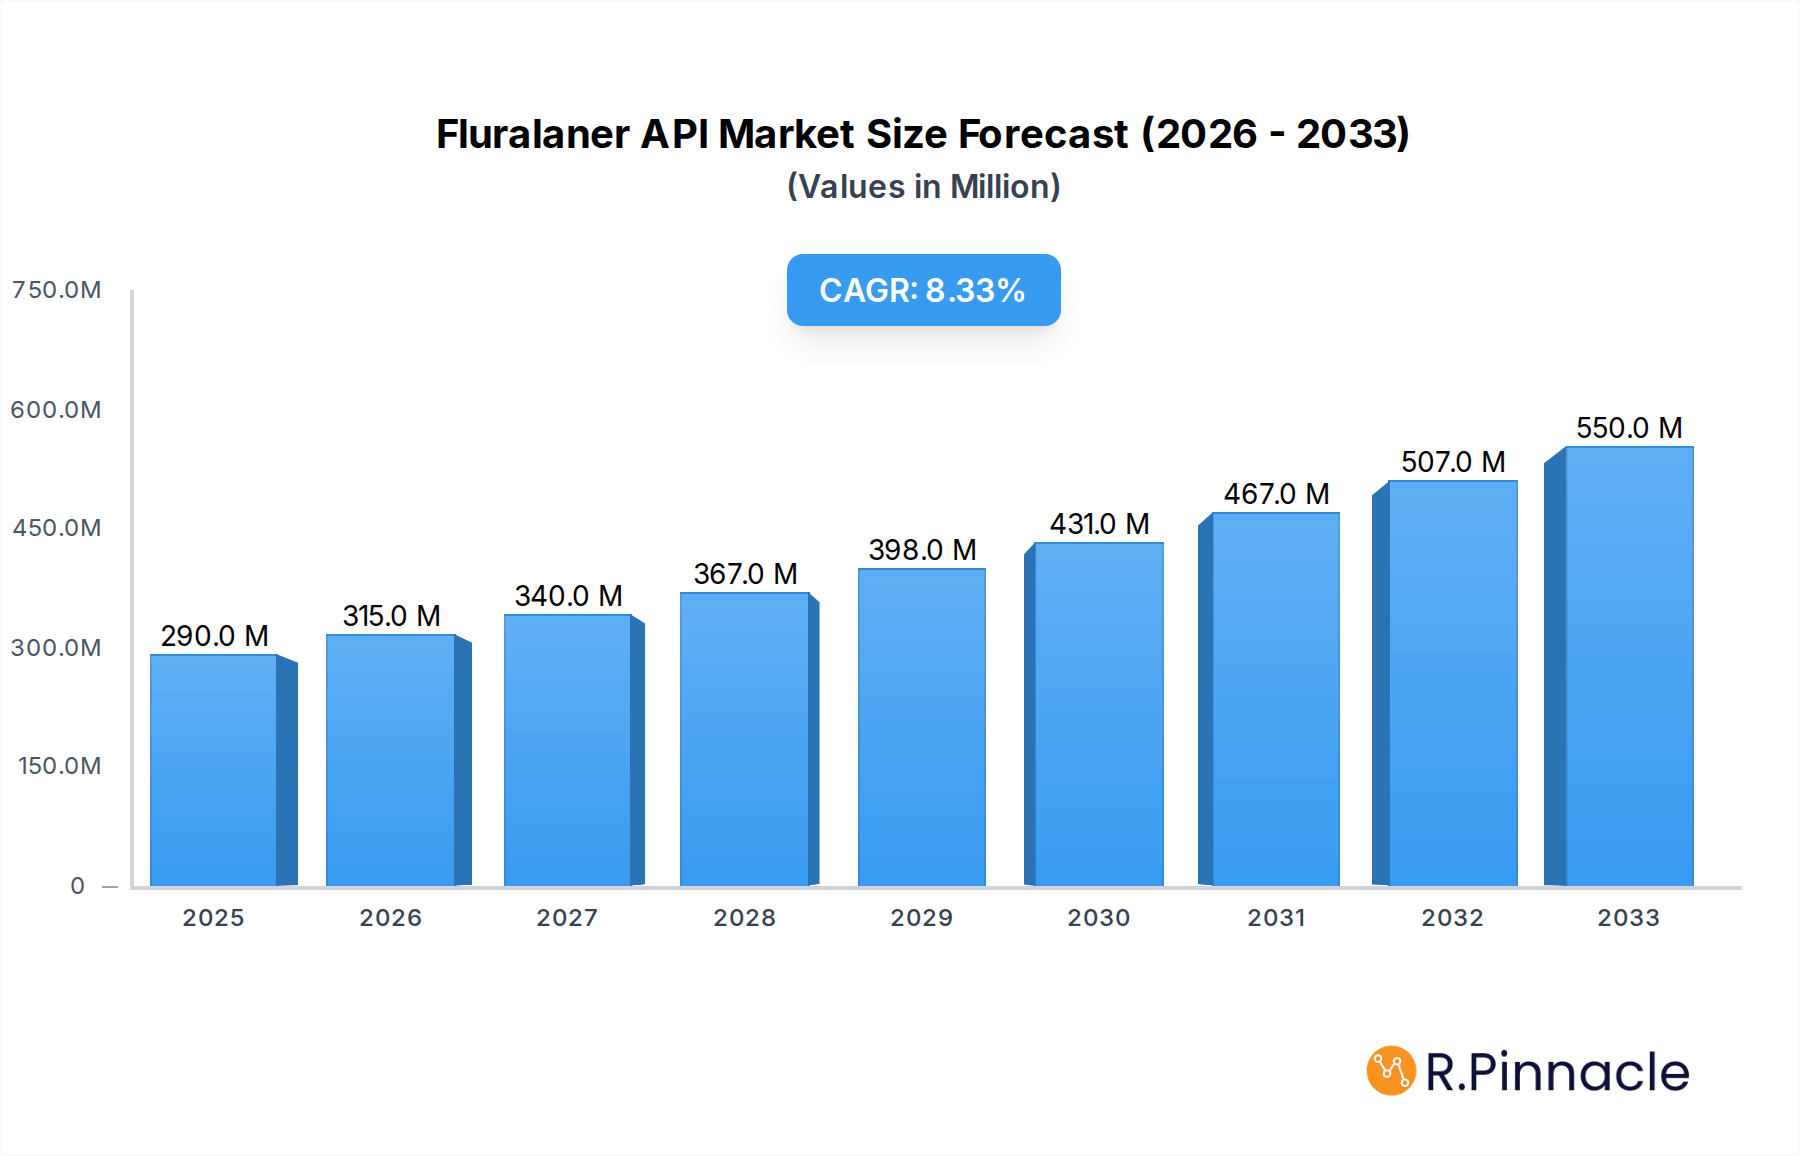
The global Fluralaner API market is poised for significant expansion, projected to reach an estimated $0.29 billion in 2025. This robust growth is underpinned by a compelling Compound Annual Growth Rate (CAGR) of 8.7%, indicating a sustained upward trajectory throughout the forecast period of 2025-2033. This expansion is primarily fueled by the increasing prevalence of ectoparasitic infestations in companion animals and livestock, driving the demand for effective and long-lasting treatments. The pharmaceutical industry's continuous investment in research and development for novel veterinary medicines, coupled with a growing awareness among pet owners and livestock farmers about animal health and welfare, further solidifies this growth.

Fluralaner API Market Size (In Million)
The market's dynamism is further shaped by key drivers such as the rising pet humanization trend, leading to increased spending on premium veterinary care, and the growing need for efficient parasite control in the agricultural sector to ensure animal productivity and food safety. While the market presents substantial opportunities, certain restraints, such as stringent regulatory approvals for new drug formulations and the emergence of generic alternatives, could influence the pace of growth. However, the innovation in drug delivery systems and the expanding applications of Fluralaner, particularly in topical and oral formulations for both veterinary and potentially human health applications, are expected to offset these challenges, ensuring a healthy and growing market. The market segmentation into ‘Purity above 98%’ and ‘Purity below 98%’ highlights the nuanced requirements of pharmaceutical manufacturing, with a likely greater demand for higher purity grades in advanced formulations.
Fluralaner API Company Market Share
This in-depth report offers a panoramic view of the Fluralaner Active Pharmaceutical Ingredient (API) market, meticulously analyzing its current landscape and forecasting its trajectory through 2033. Covering the historical period from 2019 to 2024 and projecting through 2033 with a base year of 2025 and estimated year of 2025, this analysis delves into critical market drivers, segmentation, regional dominance, innovation trends, and the competitive environment. Industry professionals will gain actionable insights into market concentration, technological advancements, regulatory frameworks, and emerging opportunities essential for strategic decision-making in this burgeoning sector. The report provides comprehensive data for market participants, including chemical manufacturers, pharmaceutical companies, research institutions, and investors, seeking to understand and capitalize on the global Fluralaner API market.
Fluralaner API Market Structure & Innovation Trends
The Fluralaner API market exhibits a moderate to high level of concentration, with a few key players dominating production. Innovation is a critical driver, fueled by the continuous need for more effective and safer ectoparasiticides for both companion animals and livestock. Regulatory frameworks, primarily driven by veterinary drug agencies, play a significant role in market entry and product approval, ensuring efficacy and safety standards are met. Product substitutes, while existing in the form of other parasiticides, face increasing competition from Fluralaner's established efficacy and favorable safety profile, particularly its long-lasting action. End-user demographics are primarily veterinarians, pet owners, and livestock farmers, with a growing awareness of advanced pest control solutions. Mergers and Acquisitions (M&A) activities are anticipated to increase as companies seek to expand their portfolios, secure intellectual property, and achieve economies of scale. Estimated M&A deal values are expected to reach billions of dollars as the market consolidates.
Fluralaner API Market Dynamics & Trends
The Fluralaner API market is poised for substantial growth, driven by an escalating demand for advanced animal health solutions. The primary growth drivers include the rising global pet population and the increasing adoption of preventive healthcare measures for companion animals, leading to a higher demand for effective flea and tick treatments. In the livestock sector, the need to maintain herd health, improve productivity, and comply with stringent food safety regulations further propels the demand for reliable parasiticides. Technological disruptions in API synthesis and formulation are leading to more cost-effective production methods and improved bioavailability of the drug, enhancing its therapeutic efficacy. Consumer preferences are shifting towards long-acting, broad-spectrum treatments that offer convenience and minimize animal stress, a niche where Fluralaner excels. The competitive dynamics are characterized by intense R&D efforts to develop novel formulations and delivery systems, alongside strategic partnerships and collaborations to expand market reach. Market penetration is expected to accelerate, with an estimated Compound Annual Growth Rate (CAGR) of xx% projected over the forecast period. The global market size for Fluralaner API is estimated to reach billions of dollars by 2033, reflecting its increasing significance in veterinary medicine.
Dominant Regions & Segments in Fluralaner API
North America currently stands as the dominant region in the Fluralaner API market, driven by a high pet ownership rate, strong disposable incomes dedicated to pet care, and a well-established veterinary pharmaceutical infrastructure. The United States, in particular, leads with extensive research and development activities and a significant market penetration of Fluralaner-based products. Robust economic policies supporting animal health initiatives and advanced healthcare infrastructure further solidify its leading position. In terms of application, the Oral Drug segment is exhibiting considerable dominance, attributed to the convenience and efficacy of oral formulations in providing systemic protection against parasites. The Purity above 98% type segment commands the largest market share, as pharmaceutical-grade APIs are essential for ensuring the safety and effectiveness of veterinary drugs, meeting stringent regulatory requirements. Key drivers for this dominance include stringent quality control measures, advanced manufacturing processes, and the demand for high-purity active ingredients in human-grade pharmaceutical production. The market penetration in this segment is high due to the non-negotiable quality standards in the pharmaceutical industry. Asia Pacific is emerging as a significant growth region, propelled by increasing pet adoption, a growing middle class with greater spending power on pet healthcare, and expanding livestock industries, particularly in countries like China and India.
Fluralaner API Product Innovations
Recent product innovations in the Fluralaner API market are focused on enhancing delivery systems and expanding therapeutic applications. Developments include chewable tablets, topical solutions, and injectable formulations designed for prolonged efficacy, offering greater convenience for pet owners and livestock managers. These innovations leverage advancements in pharmaceutical technology to improve bioavailability and target specific parasitic challenges. Competitive advantages stem from longer duration of action, broad-spectrum efficacy against various ectoparasites, and a favorable safety profile, differentiating Fluralaner-based products in a competitive market.
Report Scope & Segmentation Analysis
The Fluralaner API market is segmented by application into Oral Drug and Topical Drug. The Oral Drug segment is projected to witness robust growth due to its ease of administration and systemic efficacy, estimated to reach billions in market size by 2033. The Topical Drug segment, while significant, is expected to grow at a slightly lower CAGR as newer oral formulations gain traction. Further segmentation by purity includes Purity above 98% and Purity below 98%. The Purity above 98% segment is anticipated to dominate the market owing to stringent regulatory requirements for pharmaceutical-grade APIs, with projected growth driven by the demand for high-quality veterinary medicines. The Purity below 98% segment caters to less stringent applications or intermediate manufacturing processes.
Key Drivers of Fluralaner API Growth
Several key drivers are propelling the growth of the Fluralaner API market. The technological advancement in API synthesis leading to more efficient and cost-effective production is a significant factor. Economically, the increasing disposable income globally, particularly for pet care, fuels demand for premium animal health products. The regulatory landscape, while stringent, also provides a framework for approved and effective products, fostering market trust. Furthermore, the growing awareness among pet owners and livestock farmers about the impact of ectoparasites on animal health and productivity is a critical driver.
Challenges in the Fluralaner API Sector
The Fluralaner API sector faces several challenges that could impede its growth. Regulatory hurdles for new product approvals, although essential for safety, can be time-consuming and costly, delaying market entry. Supply chain complexities, including the sourcing of raw materials and ensuring consistent product quality across global manufacturers, present logistical challenges. Competitive pressures from existing parasiticides and potential new entrants necessitate continuous innovation and cost optimization. Furthermore, the potential for parasite resistance development requires ongoing research and development of new strategies, impacting long-term market sustainability.
Emerging Opportunities in Fluralaner API
Emerging opportunities in the Fluralaner API market are ripe for exploration. The technological frontier offers scope for developing novel drug delivery systems, such as long-acting implants or biodegradable microspheres, enhancing patient compliance and therapeutic outcomes. New markets, particularly in developing economies with a growing pet population and expanding livestock industries, represent significant untapped potential. Shifting consumer preferences towards integrated pest management solutions and environmentally friendly products also present avenues for innovation. The development of Fluralaner for a broader range of animal species and for combating emerging resistant parasite strains will further expand its market footprint.
Leading Players in the Fluralaner API Market
- Nissan Chemical
- Hikal
- Hubei Masteam Bio-tech
- Jiangsu Rivocean
- Shaanxi Dideu
- Zhejiang Gihi Chemicals
- Hunan Huateng Pharmaceutical
- Taizhou Crene Biotechnology
Key Developments in Fluralaner API Industry
- 2023: Launch of novel combination therapies incorporating Fluralaner for enhanced ectoparasite control in companion animals.
- 2022: Significant investment by key manufacturers in expanding production capacity to meet growing global demand.
- 2021: Advancements in synthesis routes leading to improved purity and reduced manufacturing costs for Fluralaner API.
- 2020: Increased focus on Fluralaner's efficacy against tick-borne diseases, driving research and development in this area.
- 2019: Several companies secured patents for innovative Fluralaner formulations, strengthening their market positions.
Future Outlook for Fluralaner API Market
The future outlook for the Fluralaner API market is exceptionally positive, driven by sustained growth in the animal health sector and ongoing innovation. The market is expected to witness a significant CAGR of xx% from 2025 to 2033, reaching billions in value. Strategic opportunities lie in expanding product offerings to cater to a wider array of animal species, including niche livestock segments, and in developing more sustainable and environmentally conscious formulations. Companies that invest in cutting-edge research and development, forge strong distribution networks, and adapt to evolving regulatory landscapes will be best positioned for long-term success and market leadership in this dynamic industry.
Fluralaner API Segmentation
-
1. Application
- 1.1. Oral Drug
- 1.2. Topical Drug
-
2. Types
- 2.1. Purity above 98%
- 2.2. Purity below 98%
Fluralaner API Segmentation By Geography
-
1. North America
- 1.1. United States
- 1.2. Canada
- 1.3. Mexico
-
2. South America
- 2.1. Brazil
- 2.2. Argentina
- 2.3. Rest of South America
-
3. Europe
- 3.1. United Kingdom
- 3.2. Germany
- 3.3. France
- 3.4. Italy
- 3.5. Spain
- 3.6. Russia
- 3.7. Benelux
- 3.8. Nordics
- 3.9. Rest of Europe
-
4. Middle East & Africa
- 4.1. Turkey
- 4.2. Israel
- 4.3. GCC
- 4.4. North Africa
- 4.5. South Africa
- 4.6. Rest of Middle East & Africa
-
5. Asia Pacific
- 5.1. China
- 5.2. India
- 5.3. Japan
- 5.4. South Korea
- 5.5. ASEAN
- 5.6. Oceania
- 5.7. Rest of Asia Pacific
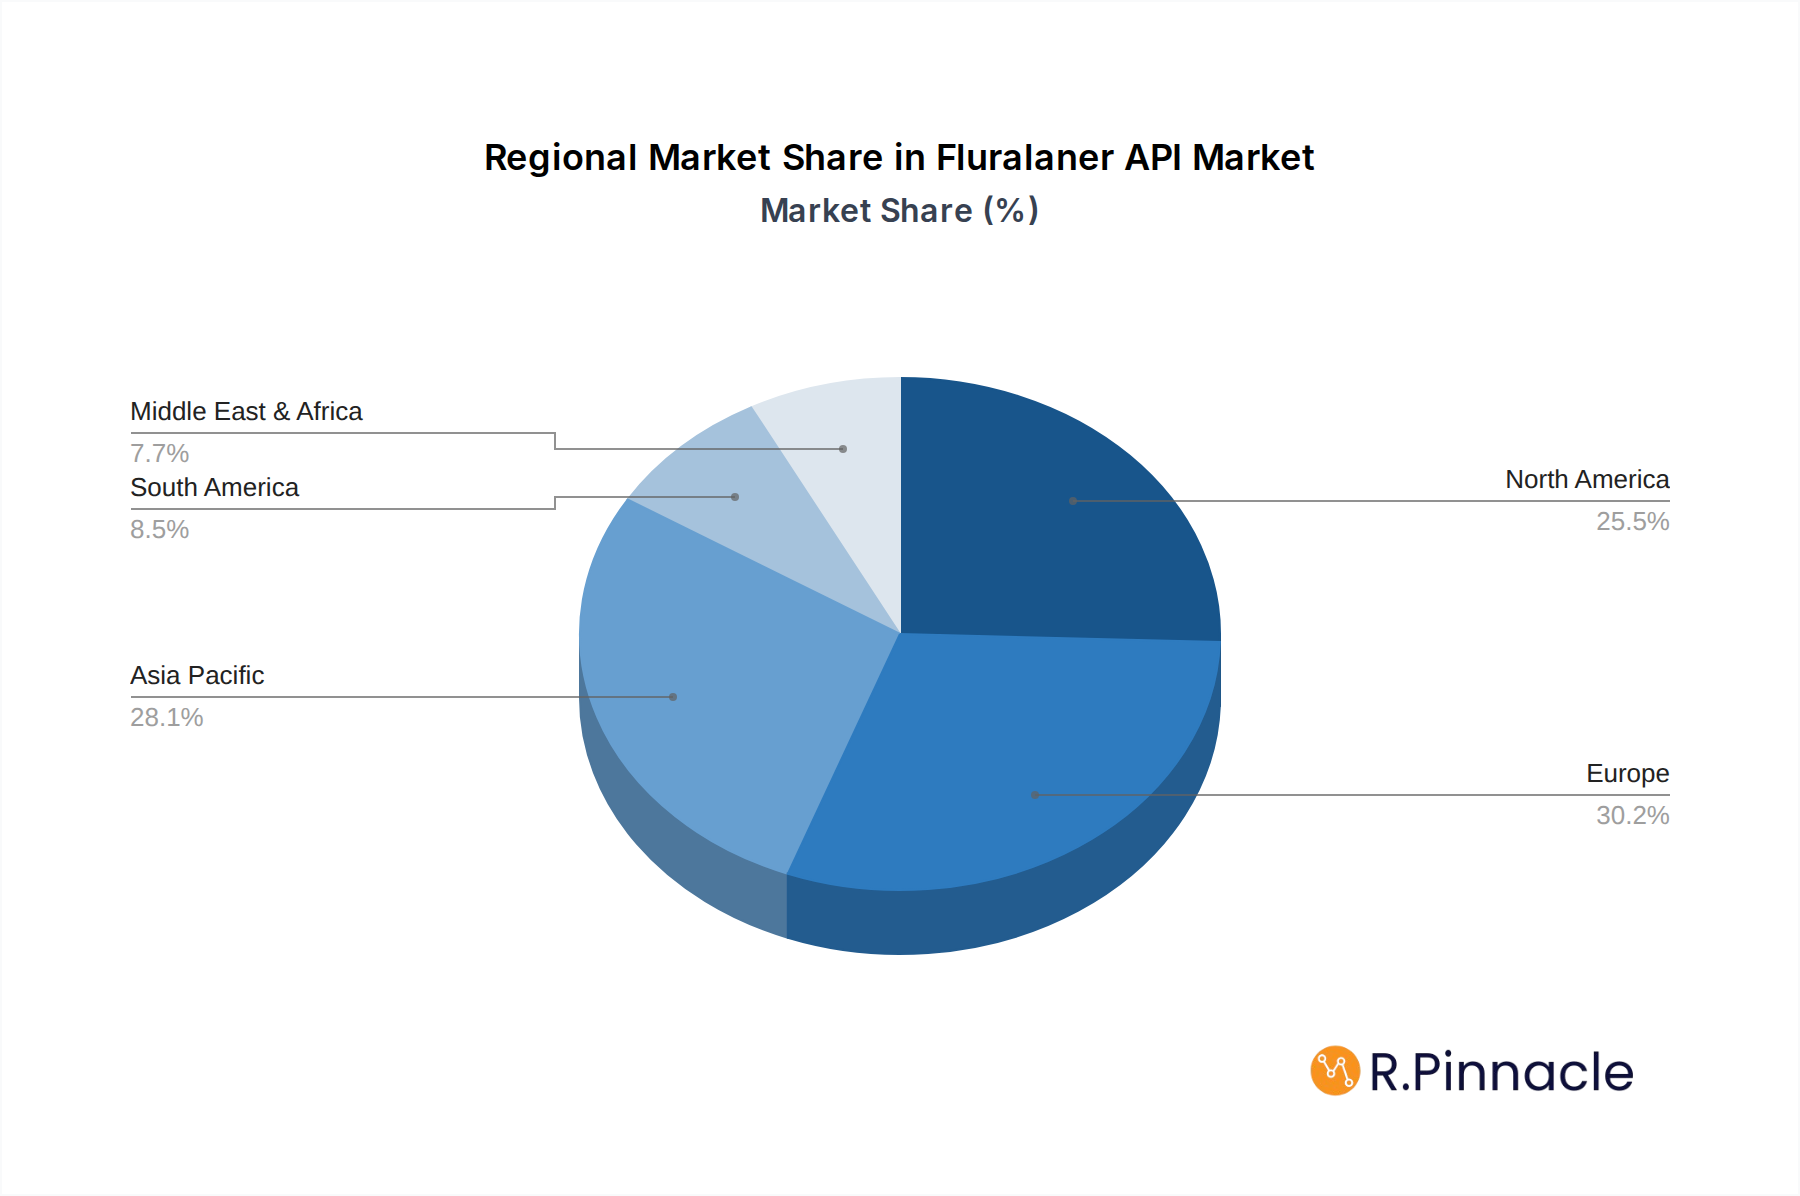
Fluralaner API Regional Market Share
Geographic Coverage of Fluralaner API
Fluralaner API REPORT HIGHLIGHTS
| Aspects | Details |
|---|---|
| Study Period | 2020-2034 |
| Base Year | 2025 |
| Estimated Year | 2026 |
| Forecast Period | 2026-2034 |
| Historical Period | 2020-2025 |
| Growth Rate | CAGR of 8.7% from 2020-2034 |
| Segmentation |
|
Table of Contents
- 1. Introduction
- 1.1. Research Scope
- 1.2. Market Segmentation
- 1.3. Research Objective
- 1.4. Definitions and Assumptions
- 2. Executive Summary
- 2.1. Market Snapshot
- 3. Market Dynamics
- 3.1. Market Drivers
- 3.2. Market Restrains
- 3.3. Market Trends
- 3.4. Market Opportunities
- 4. Market Factor Analysis
- 4.1. Porters Five Forces
- 4.1.1. Bargaining Power of Suppliers
- 4.1.2. Bargaining Power of Buyers
- 4.1.3. Threat of New Entrants
- 4.1.4. Threat of Substitutes
- 4.1.5. Competitive Rivalry
- 4.2. PESTEL analysis
- 4.3. BCG Analysis
- 4.3.1. Stars (High Growth, High Market Share)
- 4.3.2. Cash Cows (Low Growth, High Market Share)
- 4.3.3. Question Mark (High Growth, Low Market Share)
- 4.3.4. Dogs (Low Growth, Low Market Share)
- 4.4. Ansoff Matrix Analysis
- 4.5. Supply Chain Analysis
- 4.6. Regulatory Landscape
- 4.7. Current Market Potential and Opportunity Assessment (TAM–SAM–SOM Framework)
- 4.8. PRI Analyst Note
- 4.1. Porters Five Forces
- 5. Market Analysis, Insights and Forecast 2021-2033
- 5.1. Market Analysis, Insights and Forecast - by Application
- 5.1.1. Oral Drug
- 5.1.2. Topical Drug
- 5.2. Market Analysis, Insights and Forecast - by Types
- 5.2.1. Purity above 98%
- 5.2.2. Purity below 98%
- 5.3. Market Analysis, Insights and Forecast - by Region
- 5.3.1. North America
- 5.3.2. South America
- 5.3.3. Europe
- 5.3.4. Middle East & Africa
- 5.3.5. Asia Pacific
- 5.1. Market Analysis, Insights and Forecast - by Application
- 6. Global Fluralaner API Analysis, Insights and Forecast, 2021-2033
- 6.1. Market Analysis, Insights and Forecast - by Application
- 6.1.1. Oral Drug
- 6.1.2. Topical Drug
- 6.2. Market Analysis, Insights and Forecast - by Types
- 6.2.1. Purity above 98%
- 6.2.2. Purity below 98%
- 6.1. Market Analysis, Insights and Forecast - by Application
- 7. North America Fluralaner API Analysis, Insights and Forecast, 2020-2032
- 7.1. Market Analysis, Insights and Forecast - by Application
- 7.1.1. Oral Drug
- 7.1.2. Topical Drug
- 7.2. Market Analysis, Insights and Forecast - by Types
- 7.2.1. Purity above 98%
- 7.2.2. Purity below 98%
- 7.1. Market Analysis, Insights and Forecast - by Application
- 8. South America Fluralaner API Analysis, Insights and Forecast, 2020-2032
- 8.1. Market Analysis, Insights and Forecast - by Application
- 8.1.1. Oral Drug
- 8.1.2. Topical Drug
- 8.2. Market Analysis, Insights and Forecast - by Types
- 8.2.1. Purity above 98%
- 8.2.2. Purity below 98%
- 8.1. Market Analysis, Insights and Forecast - by Application
- 9. Europe Fluralaner API Analysis, Insights and Forecast, 2020-2032
- 9.1. Market Analysis, Insights and Forecast - by Application
- 9.1.1. Oral Drug
- 9.1.2. Topical Drug
- 9.2. Market Analysis, Insights and Forecast - by Types
- 9.2.1. Purity above 98%
- 9.2.2. Purity below 98%
- 9.1. Market Analysis, Insights and Forecast - by Application
- 10. Middle East & Africa Fluralaner API Analysis, Insights and Forecast, 2020-2032
- 10.1. Market Analysis, Insights and Forecast - by Application
- 10.1.1. Oral Drug
- 10.1.2. Topical Drug
- 10.2. Market Analysis, Insights and Forecast - by Types
- 10.2.1. Purity above 98%
- 10.2.2. Purity below 98%
- 10.1. Market Analysis, Insights and Forecast - by Application
- 11. Asia Pacific Fluralaner API Analysis, Insights and Forecast, 2020-2032
- 11.1. Market Analysis, Insights and Forecast - by Application
- 11.1.1. Oral Drug
- 11.1.2. Topical Drug
- 11.2. Market Analysis, Insights and Forecast - by Types
- 11.2.1. Purity above 98%
- 11.2.2. Purity below 98%
- 11.1. Market Analysis, Insights and Forecast - by Application
- 12. Competitive Analysis
- 12.1. Company Profiles
- 12.1.1 Nissan Chemical
- 12.1.1.1. Company Overview
- 12.1.1.2. Products
- 12.1.1.3. Company Financials
- 12.1.1.4. SWOT Analysis
- 12.1.2 Hikal
- 12.1.2.1. Company Overview
- 12.1.2.2. Products
- 12.1.2.3. Company Financials
- 12.1.2.4. SWOT Analysis
- 12.1.3 Hubei Masteam Bio-tech
- 12.1.3.1. Company Overview
- 12.1.3.2. Products
- 12.1.3.3. Company Financials
- 12.1.3.4. SWOT Analysis
- 12.1.4 Jiangsu Rivocean
- 12.1.4.1. Company Overview
- 12.1.4.2. Products
- 12.1.4.3. Company Financials
- 12.1.4.4. SWOT Analysis
- 12.1.5 Shaanxi Dideu
- 12.1.5.1. Company Overview
- 12.1.5.2. Products
- 12.1.5.3. Company Financials
- 12.1.5.4. SWOT Analysis
- 12.1.6 Zhejiang Gihi Chemicals
- 12.1.6.1. Company Overview
- 12.1.6.2. Products
- 12.1.6.3. Company Financials
- 12.1.6.4. SWOT Analysis
- 12.1.7 Hunan Huateng Pharmaceutical
- 12.1.7.1. Company Overview
- 12.1.7.2. Products
- 12.1.7.3. Company Financials
- 12.1.7.4. SWOT Analysis
- 12.1.8 Taizhou Crene Biotechnology
- 12.1.8.1. Company Overview
- 12.1.8.2. Products
- 12.1.8.3. Company Financials
- 12.1.8.4. SWOT Analysis
- 12.1.1 Nissan Chemical
- 12.2. Market Entropy
- 12.2.1 Company's Key Areas Served
- 12.2.2 Recent Developments
- 12.3. Company Market Share Analysis 2025
- 12.3.1 Top 5 Companies Market Share Analysis
- 12.3.2 Top 3 Companies Market Share Analysis
- 12.4. List of Potential Customers
- 13. Research Methodology
List of Figures
- Figure 1: Global Fluralaner API Revenue Breakdown (billion, %) by Region 2025 & 2033
- Figure 2: Global Fluralaner API Volume Breakdown (K, %) by Region 2025 & 2033
- Figure 3: North America Fluralaner API Revenue (billion), by Application 2025 & 2033
- Figure 4: North America Fluralaner API Volume (K), by Application 2025 & 2033
- Figure 5: North America Fluralaner API Revenue Share (%), by Application 2025 & 2033
- Figure 6: North America Fluralaner API Volume Share (%), by Application 2025 & 2033
- Figure 7: North America Fluralaner API Revenue (billion), by Types 2025 & 2033
- Figure 8: North America Fluralaner API Volume (K), by Types 2025 & 2033
- Figure 9: North America Fluralaner API Revenue Share (%), by Types 2025 & 2033
- Figure 10: North America Fluralaner API Volume Share (%), by Types 2025 & 2033
- Figure 11: North America Fluralaner API Revenue (billion), by Country 2025 & 2033
- Figure 12: North America Fluralaner API Volume (K), by Country 2025 & 2033
- Figure 13: North America Fluralaner API Revenue Share (%), by Country 2025 & 2033
- Figure 14: North America Fluralaner API Volume Share (%), by Country 2025 & 2033
- Figure 15: South America Fluralaner API Revenue (billion), by Application 2025 & 2033
- Figure 16: South America Fluralaner API Volume (K), by Application 2025 & 2033
- Figure 17: South America Fluralaner API Revenue Share (%), by Application 2025 & 2033
- Figure 18: South America Fluralaner API Volume Share (%), by Application 2025 & 2033
- Figure 19: South America Fluralaner API Revenue (billion), by Types 2025 & 2033
- Figure 20: South America Fluralaner API Volume (K), by Types 2025 & 2033
- Figure 21: South America Fluralaner API Revenue Share (%), by Types 2025 & 2033
- Figure 22: South America Fluralaner API Volume Share (%), by Types 2025 & 2033
- Figure 23: South America Fluralaner API Revenue (billion), by Country 2025 & 2033
- Figure 24: South America Fluralaner API Volume (K), by Country 2025 & 2033
- Figure 25: South America Fluralaner API Revenue Share (%), by Country 2025 & 2033
- Figure 26: South America Fluralaner API Volume Share (%), by Country 2025 & 2033
- Figure 27: Europe Fluralaner API Revenue (billion), by Application 2025 & 2033
- Figure 28: Europe Fluralaner API Volume (K), by Application 2025 & 2033
- Figure 29: Europe Fluralaner API Revenue Share (%), by Application 2025 & 2033
- Figure 30: Europe Fluralaner API Volume Share (%), by Application 2025 & 2033
- Figure 31: Europe Fluralaner API Revenue (billion), by Types 2025 & 2033
- Figure 32: Europe Fluralaner API Volume (K), by Types 2025 & 2033
- Figure 33: Europe Fluralaner API Revenue Share (%), by Types 2025 & 2033
- Figure 34: Europe Fluralaner API Volume Share (%), by Types 2025 & 2033
- Figure 35: Europe Fluralaner API Revenue (billion), by Country 2025 & 2033
- Figure 36: Europe Fluralaner API Volume (K), by Country 2025 & 2033
- Figure 37: Europe Fluralaner API Revenue Share (%), by Country 2025 & 2033
- Figure 38: Europe Fluralaner API Volume Share (%), by Country 2025 & 2033
- Figure 39: Middle East & Africa Fluralaner API Revenue (billion), by Application 2025 & 2033
- Figure 40: Middle East & Africa Fluralaner API Volume (K), by Application 2025 & 2033
- Figure 41: Middle East & Africa Fluralaner API Revenue Share (%), by Application 2025 & 2033
- Figure 42: Middle East & Africa Fluralaner API Volume Share (%), by Application 2025 & 2033
- Figure 43: Middle East & Africa Fluralaner API Revenue (billion), by Types 2025 & 2033
- Figure 44: Middle East & Africa Fluralaner API Volume (K), by Types 2025 & 2033
- Figure 45: Middle East & Africa Fluralaner API Revenue Share (%), by Types 2025 & 2033
- Figure 46: Middle East & Africa Fluralaner API Volume Share (%), by Types 2025 & 2033
- Figure 47: Middle East & Africa Fluralaner API Revenue (billion), by Country 2025 & 2033
- Figure 48: Middle East & Africa Fluralaner API Volume (K), by Country 2025 & 2033
- Figure 49: Middle East & Africa Fluralaner API Revenue Share (%), by Country 2025 & 2033
- Figure 50: Middle East & Africa Fluralaner API Volume Share (%), by Country 2025 & 2033
- Figure 51: Asia Pacific Fluralaner API Revenue (billion), by Application 2025 & 2033
- Figure 52: Asia Pacific Fluralaner API Volume (K), by Application 2025 & 2033
- Figure 53: Asia Pacific Fluralaner API Revenue Share (%), by Application 2025 & 2033
- Figure 54: Asia Pacific Fluralaner API Volume Share (%), by Application 2025 & 2033
- Figure 55: Asia Pacific Fluralaner API Revenue (billion), by Types 2025 & 2033
- Figure 56: Asia Pacific Fluralaner API Volume (K), by Types 2025 & 2033
- Figure 57: Asia Pacific Fluralaner API Revenue Share (%), by Types 2025 & 2033
- Figure 58: Asia Pacific Fluralaner API Volume Share (%), by Types 2025 & 2033
- Figure 59: Asia Pacific Fluralaner API Revenue (billion), by Country 2025 & 2033
- Figure 60: Asia Pacific Fluralaner API Volume (K), by Country 2025 & 2033
- Figure 61: Asia Pacific Fluralaner API Revenue Share (%), by Country 2025 & 2033
- Figure 62: Asia Pacific Fluralaner API Volume Share (%), by Country 2025 & 2033
List of Tables
- Table 1: Global Fluralaner API Revenue billion Forecast, by Application 2020 & 2033
- Table 2: Global Fluralaner API Volume K Forecast, by Application 2020 & 2033
- Table 3: Global Fluralaner API Revenue billion Forecast, by Types 2020 & 2033
- Table 4: Global Fluralaner API Volume K Forecast, by Types 2020 & 2033
- Table 5: Global Fluralaner API Revenue billion Forecast, by Region 2020 & 2033
- Table 6: Global Fluralaner API Volume K Forecast, by Region 2020 & 2033
- Table 7: Global Fluralaner API Revenue billion Forecast, by Application 2020 & 2033
- Table 8: Global Fluralaner API Volume K Forecast, by Application 2020 & 2033
- Table 9: Global Fluralaner API Revenue billion Forecast, by Types 2020 & 2033
- Table 10: Global Fluralaner API Volume K Forecast, by Types 2020 & 2033
- Table 11: Global Fluralaner API Revenue billion Forecast, by Country 2020 & 2033
- Table 12: Global Fluralaner API Volume K Forecast, by Country 2020 & 2033
- Table 13: United States Fluralaner API Revenue (billion) Forecast, by Application 2020 & 2033
- Table 14: United States Fluralaner API Volume (K) Forecast, by Application 2020 & 2033
- Table 15: Canada Fluralaner API Revenue (billion) Forecast, by Application 2020 & 2033
- Table 16: Canada Fluralaner API Volume (K) Forecast, by Application 2020 & 2033
- Table 17: Mexico Fluralaner API Revenue (billion) Forecast, by Application 2020 & 2033
- Table 18: Mexico Fluralaner API Volume (K) Forecast, by Application 2020 & 2033
- Table 19: Global Fluralaner API Revenue billion Forecast, by Application 2020 & 2033
- Table 20: Global Fluralaner API Volume K Forecast, by Application 2020 & 2033
- Table 21: Global Fluralaner API Revenue billion Forecast, by Types 2020 & 2033
- Table 22: Global Fluralaner API Volume K Forecast, by Types 2020 & 2033
- Table 23: Global Fluralaner API Revenue billion Forecast, by Country 2020 & 2033
- Table 24: Global Fluralaner API Volume K Forecast, by Country 2020 & 2033
- Table 25: Brazil Fluralaner API Revenue (billion) Forecast, by Application 2020 & 2033
- Table 26: Brazil Fluralaner API Volume (K) Forecast, by Application 2020 & 2033
- Table 27: Argentina Fluralaner API Revenue (billion) Forecast, by Application 2020 & 2033
- Table 28: Argentina Fluralaner API Volume (K) Forecast, by Application 2020 & 2033
- Table 29: Rest of South America Fluralaner API Revenue (billion) Forecast, by Application 2020 & 2033
- Table 30: Rest of South America Fluralaner API Volume (K) Forecast, by Application 2020 & 2033
- Table 31: Global Fluralaner API Revenue billion Forecast, by Application 2020 & 2033
- Table 32: Global Fluralaner API Volume K Forecast, by Application 2020 & 2033
- Table 33: Global Fluralaner API Revenue billion Forecast, by Types 2020 & 2033
- Table 34: Global Fluralaner API Volume K Forecast, by Types 2020 & 2033
- Table 35: Global Fluralaner API Revenue billion Forecast, by Country 2020 & 2033
- Table 36: Global Fluralaner API Volume K Forecast, by Country 2020 & 2033
- Table 37: United Kingdom Fluralaner API Revenue (billion) Forecast, by Application 2020 & 2033
- Table 38: United Kingdom Fluralaner API Volume (K) Forecast, by Application 2020 & 2033
- Table 39: Germany Fluralaner API Revenue (billion) Forecast, by Application 2020 & 2033
- Table 40: Germany Fluralaner API Volume (K) Forecast, by Application 2020 & 2033
- Table 41: France Fluralaner API Revenue (billion) Forecast, by Application 2020 & 2033
- Table 42: France Fluralaner API Volume (K) Forecast, by Application 2020 & 2033
- Table 43: Italy Fluralaner API Revenue (billion) Forecast, by Application 2020 & 2033
- Table 44: Italy Fluralaner API Volume (K) Forecast, by Application 2020 & 2033
- Table 45: Spain Fluralaner API Revenue (billion) Forecast, by Application 2020 & 2033
- Table 46: Spain Fluralaner API Volume (K) Forecast, by Application 2020 & 2033
- Table 47: Russia Fluralaner API Revenue (billion) Forecast, by Application 2020 & 2033
- Table 48: Russia Fluralaner API Volume (K) Forecast, by Application 2020 & 2033
- Table 49: Benelux Fluralaner API Revenue (billion) Forecast, by Application 2020 & 2033
- Table 50: Benelux Fluralaner API Volume (K) Forecast, by Application 2020 & 2033
- Table 51: Nordics Fluralaner API Revenue (billion) Forecast, by Application 2020 & 2033
- Table 52: Nordics Fluralaner API Volume (K) Forecast, by Application 2020 & 2033
- Table 53: Rest of Europe Fluralaner API Revenue (billion) Forecast, by Application 2020 & 2033
- Table 54: Rest of Europe Fluralaner API Volume (K) Forecast, by Application 2020 & 2033
- Table 55: Global Fluralaner API Revenue billion Forecast, by Application 2020 & 2033
- Table 56: Global Fluralaner API Volume K Forecast, by Application 2020 & 2033
- Table 57: Global Fluralaner API Revenue billion Forecast, by Types 2020 & 2033
- Table 58: Global Fluralaner API Volume K Forecast, by Types 2020 & 2033
- Table 59: Global Fluralaner API Revenue billion Forecast, by Country 2020 & 2033
- Table 60: Global Fluralaner API Volume K Forecast, by Country 2020 & 2033
- Table 61: Turkey Fluralaner API Revenue (billion) Forecast, by Application 2020 & 2033
- Table 62: Turkey Fluralaner API Volume (K) Forecast, by Application 2020 & 2033
- Table 63: Israel Fluralaner API Revenue (billion) Forecast, by Application 2020 & 2033
- Table 64: Israel Fluralaner API Volume (K) Forecast, by Application 2020 & 2033
- Table 65: GCC Fluralaner API Revenue (billion) Forecast, by Application 2020 & 2033
- Table 66: GCC Fluralaner API Volume (K) Forecast, by Application 2020 & 2033
- Table 67: North Africa Fluralaner API Revenue (billion) Forecast, by Application 2020 & 2033
- Table 68: North Africa Fluralaner API Volume (K) Forecast, by Application 2020 & 2033
- Table 69: South Africa Fluralaner API Revenue (billion) Forecast, by Application 2020 & 2033
- Table 70: South Africa Fluralaner API Volume (K) Forecast, by Application 2020 & 2033
- Table 71: Rest of Middle East & Africa Fluralaner API Revenue (billion) Forecast, by Application 2020 & 2033
- Table 72: Rest of Middle East & Africa Fluralaner API Volume (K) Forecast, by Application 2020 & 2033
- Table 73: Global Fluralaner API Revenue billion Forecast, by Application 2020 & 2033
- Table 74: Global Fluralaner API Volume K Forecast, by Application 2020 & 2033
- Table 75: Global Fluralaner API Revenue billion Forecast, by Types 2020 & 2033
- Table 76: Global Fluralaner API Volume K Forecast, by Types 2020 & 2033
- Table 77: Global Fluralaner API Revenue billion Forecast, by Country 2020 & 2033
- Table 78: Global Fluralaner API Volume K Forecast, by Country 2020 & 2033
- Table 79: China Fluralaner API Revenue (billion) Forecast, by Application 2020 & 2033
- Table 80: China Fluralaner API Volume (K) Forecast, by Application 2020 & 2033
- Table 81: India Fluralaner API Revenue (billion) Forecast, by Application 2020 & 2033
- Table 82: India Fluralaner API Volume (K) Forecast, by Application 2020 & 2033
- Table 83: Japan Fluralaner API Revenue (billion) Forecast, by Application 2020 & 2033
- Table 84: Japan Fluralaner API Volume (K) Forecast, by Application 2020 & 2033
- Table 85: South Korea Fluralaner API Revenue (billion) Forecast, by Application 2020 & 2033
- Table 86: South Korea Fluralaner API Volume (K) Forecast, by Application 2020 & 2033
- Table 87: ASEAN Fluralaner API Revenue (billion) Forecast, by Application 2020 & 2033
- Table 88: ASEAN Fluralaner API Volume (K) Forecast, by Application 2020 & 2033
- Table 89: Oceania Fluralaner API Revenue (billion) Forecast, by Application 2020 & 2033
- Table 90: Oceania Fluralaner API Volume (K) Forecast, by Application 2020 & 2033
- Table 91: Rest of Asia Pacific Fluralaner API Revenue (billion) Forecast, by Application 2020 & 2033
- Table 92: Rest of Asia Pacific Fluralaner API Volume (K) Forecast, by Application 2020 & 2033
Frequently Asked Questions
1. What is the projected Compound Annual Growth Rate (CAGR) of the Fluralaner API?
The projected CAGR is approximately 8.7%.
2. Which companies are prominent players in the Fluralaner API?
Key companies in the market include Nissan Chemical, Hikal, Hubei Masteam Bio-tech, Jiangsu Rivocean, Shaanxi Dideu, Zhejiang Gihi Chemicals, Hunan Huateng Pharmaceutical, Taizhou Crene Biotechnology.
3. What are the main segments of the Fluralaner API?
The market segments include Application, Types.
4. Can you provide details about the market size?
The market size is estimated to be USD 0.29 billion as of 2022.
5. What are some drivers contributing to market growth?
N/A
6. What are the notable trends driving market growth?
N/A
7. Are there any restraints impacting market growth?
N/A
8. Can you provide examples of recent developments in the market?
N/A
9. What pricing options are available for accessing the report?
Pricing options include single-user, multi-user, and enterprise licenses priced at USD 3350.00, USD 5025.00, and USD 6700.00 respectively.
10. Is the market size provided in terms of value or volume?
The market size is provided in terms of value, measured in billion and volume, measured in K.
11. Are there any specific market keywords associated with the report?
Yes, the market keyword associated with the report is "Fluralaner API," which aids in identifying and referencing the specific market segment covered.
12. How do I determine which pricing option suits my needs best?
The pricing options vary based on user requirements and access needs. Individual users may opt for single-user licenses, while businesses requiring broader access may choose multi-user or enterprise licenses for cost-effective access to the report.
13. Are there any additional resources or data provided in the Fluralaner API report?
While the report offers comprehensive insights, it's advisable to review the specific contents or supplementary materials provided to ascertain if additional resources or data are available.
14. How can I stay updated on further developments or reports in the Fluralaner API?
To stay informed about further developments, trends, and reports in the Fluralaner API, consider subscribing to industry newsletters, following relevant companies and organizations, or regularly checking reputable industry news sources and publications.
Methodology
Step 1 - Identification of Relevant Samples Size from Population Database


Step 2 - Approaches for Defining Global Market Size (Value, Volume* & Price*)

Note*: In applicable scenarios
Step 3 - Data Sources
Primary Research
- Web Analytics
- Survey Reports
- Research Institute
- Latest Research Reports
- Opinion Leaders
Secondary Research
- Annual Reports
- White Paper
- Latest Press Release
- Industry Association
- Paid Database
- Investor Presentations

Step 4 - Data Triangulation
Involves using different sources of information in order to increase the validity of a study
These sources are likely to be stakeholders in a program - participants, other researchers, program staff, other community members, and so on.
Then we put all data in single framework & apply various statistical tools to find out the dynamic on the market.
During the analysis stage, feedback from the stakeholder groups would be compared to determine areas of agreement as well as areas of divergence