

Key Insights
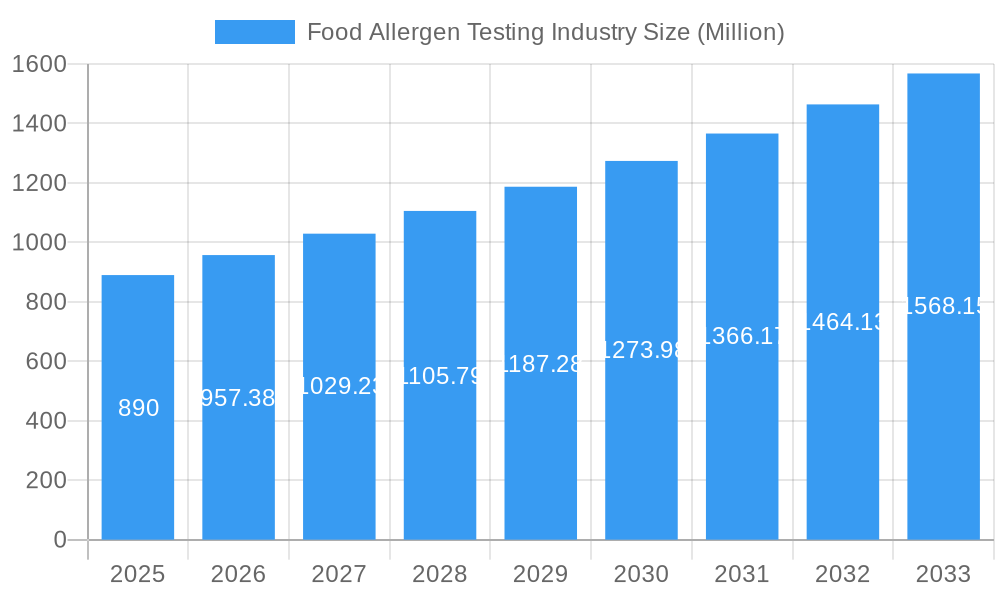
The global food allergen testing market is poised for significant expansion, projected to reach approximately USD 890 million by 2025, driven by a robust Compound Annual Growth Rate (CAGR) of 7.42% through 2033. This growth is primarily fueled by increasing consumer awareness regarding food allergies and intolerances, stringent regulatory mandates for food safety, and the rising prevalence of cross-contamination incidents in food production. The demand for accurate and rapid allergen detection methods is escalating across various food sectors, including seafood and meat products, dairy, beverages, bakery, confectionery, and baby food. Technological advancements, particularly in immunoassay-based and PCR-based testing, are enhancing sensitivity and specificity, enabling more effective identification of allergenic components. The growing emphasis on traceability and transparency in the food supply chain further bolsters the market's trajectory, as manufacturers increasingly invest in sophisticated testing solutions to ensure product integrity and consumer trust.
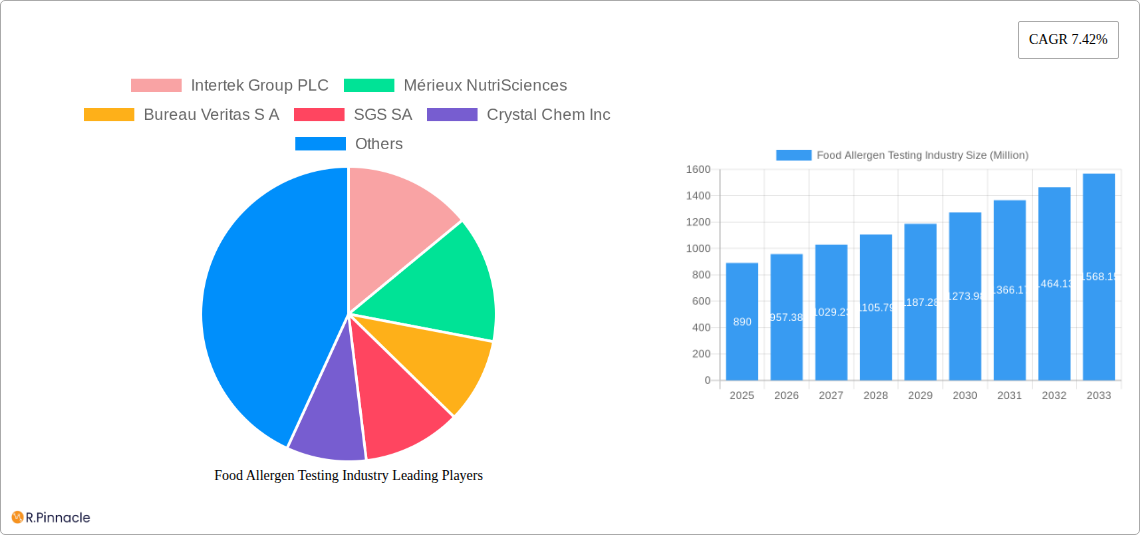
Food Allergen Testing Industry Market Size (In Million)
The market's dynamism is further shaped by several key trends and challenges. A significant trend is the shift towards multiplex testing, allowing for the simultaneous detection of multiple allergens, thereby improving efficiency and reducing costs for food businesses. Furthermore, the development of portable and on-site testing devices is gaining traction, empowering quicker decision-making and immediate response to potential contamination issues. However, the market also faces restraints such as the high cost of advanced testing equipment and reagents, a shortage of skilled professionals in food microbiology and analytical chemistry, and the complexity of validating new testing methodologies against established regulatory standards. Despite these challenges, the expanding global food trade and the continuous innovation in analytical technologies are expected to sustain the upward market trajectory, creating substantial opportunities for key players such as Eurofins Scientific SE, Mérieux NutriSciences, and SGS SA, particularly in the developed regions of North America and Europe, while also witnessing considerable growth potential in the Asia Pacific.
Food Allergen Testing Industry Company Market Share
Gain unparalleled insights into the global food allergen testing market with this comprehensive report. Spanning 2019-2033, with a base and estimated year of 2025 and a forecast period of 2025-2033, this analysis delves deep into market dynamics, technological advancements, and the critical role of food safety testing. Our expert research provides actionable intelligence for food manufacturers, diagnostic laboratories, regulatory bodies, and ingredient suppliers seeking to navigate the complexities of allergen detection and risk management. The report leverages high-ranking keywords such as food allergen testing, allergen analysis, food safety, ELISA testing, PCR testing, gluten detection, dairy allergen testing, seafood allergen testing, and infant formula allergen testing to maximize search visibility and deliver relevant data. Discover the market share of key players and understand the CAGR driving growth in this essential sector.
Food Allergen Testing Industry Market Structure & Innovation Trends
The food allergen testing market exhibits a moderately concentrated structure, with a few dominant players holding significant market share, estimated to be over 60% combined. Key innovators include Intertek Group PLC, Mérieux NutriSciences, Bureau Veritas S A, and SGS SA. Innovation is primarily driven by advancements in analytical techniques, such as enhanced sensitivity and multiplexing capabilities in immunoassay-based/ELISA and PCR (Polymerase Chain Reaction)-based technologies. Regulatory frameworks, including stringent labeling laws and international food safety standards, act as significant market drivers. The emergence of novel detection methods and improved laboratory automation further fuels innovation. Product substitutes are limited due to the specificity required for allergen detection, but advancements in sample preparation can be seen as indirect substitutes in terms of efficiency. End-user demographics are broad, encompassing all food industry segments concerned with consumer health and regulatory compliance. Merger and acquisition (M&A) activities are strategic, focusing on consolidating market presence and expanding technological portfolios. For instance, acquisitions in the range of $XX Million to $XX Million have been observed as companies seek to enhance their service offerings and geographical reach.
Food Allergen Testing Industry Market Dynamics & Trends
The food allergen testing industry is experiencing robust growth, propelled by a confluence of escalating factors that are reshaping the global food supply chain. A primary growth driver is the increasing global prevalence of food allergies and intolerances, leading to heightened consumer awareness and demand for accurate allergen information. This surge in consumer concern directly translates into greater pressure on food manufacturers to implement comprehensive allergen testing protocols. Furthermore, stringent governmental regulations and international food safety standards mandating clear allergen labeling and traceability play a pivotal role in market expansion. These regulations not only enforce compliance but also foster a proactive approach to allergen management within the industry.
Technological disruptions are at the forefront of market evolution. The refinement and widespread adoption of advanced testing methods, particularly immunoassay-based/ELISA and PCR (Polymerase Chain Reaction)-based technologies, are enhancing the sensitivity, specificity, and speed of allergen detection. Lateral flow devices are gaining traction for their rapid on-site testing capabilities, offering quicker results for immediate decision-making. The integration of advanced analytical instruments and automation in laboratories is further boosting efficiency and reducing turnaround times, contributing to a projected CAGR of approximately 7.5% over the forecast period.
Consumer preferences are increasingly shifting towards transparency and ‘free-from’ claims. This trend necessitates reliable and scientifically validated testing to substantiate these claims, thereby increasing market penetration of allergen testing services. The globalization of the food industry also amplifies the need for harmonized testing standards and cross-border regulatory compliance, further driving demand for comprehensive allergen testing solutions.
Competitive dynamics are characterized by a blend of established global players and emerging regional specialists. Companies are investing heavily in research and development to introduce novel detection kits and expand their testing portfolios to cover a wider range of allergens and food matrices. Strategic partnerships and acquisitions are common as companies aim to broaden their service offerings, enhance their geographical footprint, and gain a competitive edge. The market is also seeing a rise in specialized testing services catering to niche segments within the food industry. The overall market penetration of dedicated allergen testing services is expected to rise significantly as awareness and regulatory scrutiny continue to intensify.
Dominant Regions & Segments in Food Allergen Testing Industry
North America currently dominates the global food allergen testing market, driven by a highly developed regulatory landscape, significant consumer awareness regarding food allergies, and the presence of major food manufacturers and research institutions. The United States, in particular, leads with stringent regulations from the FDA and a proactive consumer base demanding transparent food labeling. Economic policies that prioritize food safety and investment in advanced laboratory infrastructure further bolster this dominance.
Within the technology segment, Immunoassay-based/ELISA holds a significant market share due to its established reliability, cost-effectiveness, and suitability for detecting specific proteins in various food matrices. However, PCR (Polymerase Chain Reaction)-based technologies are experiencing rapid growth owing to their high sensitivity, specificity, and ability to detect allergenic DNA, even in highly processed foods. The accuracy and versatility of PCR make it increasingly preferred for complex matrices.
In terms of applications, Seafood and Meat Products and Dairy Products constitute the largest segments. This is attributed to the prevalence of common allergens within these categories, such as shellfish, fish, milk, and egg. Stringent regulations governing these products and the high risk associated with cross-contamination further fuel the demand for rigorous testing. Bakery and Confectionery is another substantial segment, with gluten, nuts, and dairy being major allergens that require meticulous testing, especially with the rise of gluten-free and dairy-free products. Baby Food and Infant Formula represents a critical and growing segment due to the vulnerability of infants to allergens and the strict regulatory oversight for these products.
Key Drivers of Regional Dominance (North America):
- Strict regulatory frameworks and enforcement (e.g., FALCPA in the US).
- High consumer awareness and demand for allergen-free products.
- Presence of leading food safety testing laboratories and R&D centers.
- Significant investment in food safety technologies and infrastructure.
Key Drivers of Segment Dominance (Technology - Immunoassay-based/ELISA):
- Established reliability and validation for many common allergens.
- Cost-effectiveness for routine testing.
- Ease of use and broad applicability across different food types.
Key Drivers of Segment Dominance (Application - Seafood and Meat Products):
- High prevalence of common allergens (fish, shellfish, etc.).
- Regulatory emphasis on clear allergen labeling for these products.
- Complex supply chains leading to potential cross-contamination risks.
The global food allergen testing market is projected to witness substantial growth across all segments, with PCR-based technologies and applications like Baby Food and Infant Formula showing particularly high growth rates due to increasing safety concerns and regulatory focus.
Food Allergen Testing Industry Product Innovations
The food allergen testing industry is witnessing continuous product innovation aimed at enhancing accuracy, speed, and breadth of detection. Recent developments include highly sensitive lateral flow devices like Gold Standard Diagnostics' SENSIStrip Gluten PowerLine, offering rapid detection of gluten residues in diverse matrices. This innovation addresses the need for on-site testing and quick risk assessment. Companies are also focusing on developing multiplex testing solutions that can simultaneously detect multiple allergens, thereby improving laboratory efficiency and reducing costs. The incorporation of monoclonal antibodies and advanced detection systems is a key trend, providing superior specificity and minimizing false positives. These advancements allow for better compliance with evolving regulatory requirements and meet growing consumer demand for safe and transparent food products.
Report Scope & Segmentation Analysis
This report provides an in-depth analysis of the global food allergen testing market, segmented by Technology and Application. The Technology segmentation includes Immunoassay-based/ELISA, PCR (Polymerase Chain Reaction)-based, and Other Technologies. The Application segmentation covers Seafood and Meat Products, Dairy Products, Beverages, Bakery and Confectionery, Baby Food and Infant Formula, and Other Applications.
Immunoassay-based/ELISA: This segment is characterized by established methods and a strong market presence, offering reliable detection of specific allergenic proteins. Growth is steady, driven by its cost-effectiveness and widespread adoption. Market size is estimated to be in the hundreds of millions of dollars, with a projected moderate CAGR.
PCR (Polymerase Chain Reaction)-based: This segment is experiencing rapid growth due to its high sensitivity, specificity, and ability to detect allergenic DNA. It is increasingly adopted for complex matrices and to meet stringent regulatory demands. Market size is in the low hundreds of millions of dollars, with a high projected CAGR exceeding 8%.
Other Technologies: This includes newer and emerging technologies such as mass spectrometry and biosensors, which offer advanced detection capabilities but are currently in niche adoption stages. Market size is smaller but expected to grow as these technologies mature and become more accessible.
Seafood and Meat Products: This segment is a significant contributor to the market, driven by the prevalence of common allergens and strict regulations. Market size is in the hundreds of millions of dollars, with a steady growth trajectory.
Dairy Products: Another major segment, owing to the widespread use of dairy and the commonality of milk allergies. Similar to seafood and meat, it holds a substantial market share and steady growth.
Beverages: This segment is growing as more consumers seek allergen-free beverage options and regulatory scrutiny increases for processed drinks.
Bakery and Confectionery: This segment is driven by the presence of major allergens like gluten, nuts, and dairy, and the rising demand for specialized dietary products.
Baby Food and Infant Formula: This is a critical and rapidly expanding segment due to the vulnerability of infants and stringent safety requirements, indicating a high growth potential.
Other Applications: This encompasses a broad range of food products, contributing to the overall market size and demonstrating the pervasive need for allergen testing across the food industry.
Key Drivers of Food Allergen Testing Industry Growth
The growth of the food allergen testing industry is underpinned by several critical factors. Firstly, the rising global incidence of food allergies and intolerances is a primary driver, leading to increased consumer demand for allergen-free products and thus, enhanced testing. Secondly, stringent government regulations and international food safety standards mandate accurate allergen labeling and traceability, compelling manufacturers to invest in robust testing solutions. For instance, the European Union's Food Information to Consumers (FIC) regulation and the US Food Allergen Labeling and Consumer Protection Act (FALCPA) are significant regulatory drivers. Thirdly, advancements in testing technologies, such as improved sensitivity and specificity of ELISA and PCR methods, are making allergen detection more efficient and reliable. Finally, growing awareness among food manufacturers about the economic and reputational risks associated with allergen contamination encourages proactive testing strategies to prevent recalls and maintain consumer trust.
Challenges in the Food Allergen Testing Industry Sector
Despite significant growth, the food allergen testing industry faces several challenges. Regulatory inconsistencies across different regions can create complexities for global food manufacturers, requiring tailored testing strategies for diverse markets. The high cost of advanced testing equipment and specialized reagents can be a barrier, particularly for small and medium-sized enterprises (SMEs). Ensuring accuracy and minimizing false positives/negatives remains a constant challenge, requiring meticulous method validation and skilled personnel. Cross-contamination during food processing and handling is a pervasive issue that complicates testing by introducing trace amounts of allergens. Furthermore, the emergence of new or less common allergens necessitates continuous research and development of new testing methods, adding to the complexity and cost of allergen management.
Emerging Opportunities in Food Allergen Testing Industry
Several emerging opportunities are poised to shape the future of the food allergen testing industry. The increasing demand for vegan and plant-based alternatives is driving the need for testing to ensure the absence of animal-derived allergens and to verify ingredient integrity. The development of rapid, on-site testing solutions, such as portable lateral flow devices and smartphone-enabled diagnostics, presents a significant opportunity for real-time risk assessment and quicker decision-making in diverse settings. The expansion of testing services into emerging economies with growing middle classes and increasing awareness of food safety offers substantial market potential. Furthermore, the integration of AI and machine learning in data analysis can enhance the efficiency and predictive capabilities of allergen testing, optimizing risk management strategies.
Leading Players in the Food Allergen Testing Industry Market
- Intertek Group PLC
- Mérieux NutriSciences
- Bureau Veritas S A
- SGS SA
- Crystal Chem Inc
- Lifeasible
- ALS Limited
- Microbac Laboratories Inc
- Eurofins Scientific SE
- Neogen Corporation
Key Developments in Food Allergen Testing Industry Industry
- March 2024: Gold Standard Diagnostics launched the first product of the new allergen PowerLine tests: the SENSIStrip Gluten PowerLine Lateral Flow Device. The product comprises a sensitive detection system based on a monoclonal antibody and can detect gluten residues in food matrices, rinse water, and swabs.
- March 2024: ALS strategically expanded and strengthened its European and USA Life Sciences presence. ALS acquired Northeast USA-based York Analytical Laboratories (York) and Western Europe-based Wessling Holding GmbH & Co.
- February 2024: Mérieux NutriSciences opened a new and well-equipped laboratory for food analysis in Maringá, Brazil. The new facility has federal CGRE/IMMETRO accreditation, according to NBR ISO/IEC 17025 requirements, to support the food industry in meeting quality standards.
Future Outlook for Food Allergen Testing Industry Market
The future outlook for the food allergen testing industry is exceptionally bright, driven by a persistent rise in allergy awareness, stringent global regulations, and continuous technological advancements. The market is expected to witness sustained growth, with an increasing emphasis on faster, more sensitive, and multiplexed testing solutions. Opportunities will emerge from the growing demand for specialized testing for plant-based foods, novel ingredients, and complex food formulations. The development and adoption of point-of-care and on-site testing technologies will further enhance risk management capabilities across the food supply chain. Investment in R&D for detecting emerging allergens and refining existing methodologies will remain crucial for market leaders. The industry is poised for significant expansion, offering robust opportunities for companies to innovate and cater to the escalating global demand for safe and transparent food products.
Food Allergen Testing Industry Segmentation
-
1. Technology
- 1.1. Immunoassay-based /ELISA
- 1.2. PCR (Polymerase Chain Reaction)-based
- 1.3. Other Technologies
-
2. Application
- 2.1. Seafood and Meat Products
- 2.2. Dairy Products
- 2.3. Beverages
- 2.4. Bakery and Confectionery
- 2.5. Baby Food and Infant Formula
- 2.6. Other Applications
Food Allergen Testing Industry Segmentation By Geography
-
1. North America
- 1.1. United States
- 1.2. Canada
- 1.3. Mexico
- 1.4. Rest of North America
-
2. Europe
- 2.1. Germany
- 2.2. United Kingdom
- 2.3. France
- 2.4. Russia
- 2.5. Spain
- 2.6. Italy
- 2.7. Rest of Europe
-
3. Asia Pacific
- 3.1. India
- 3.2. China
- 3.3. Japan
- 3.4. Australia
- 3.5. Rest of Asia Pacific
-
4. South America
- 4.1. Brazil
- 4.2. Argentina
- 4.3. Rest of South America
-
5. Middle East and Africa
- 5.1. South Africa
- 5.2. Saudi Arabia
- 5.3. Rest of Middle East and Africa
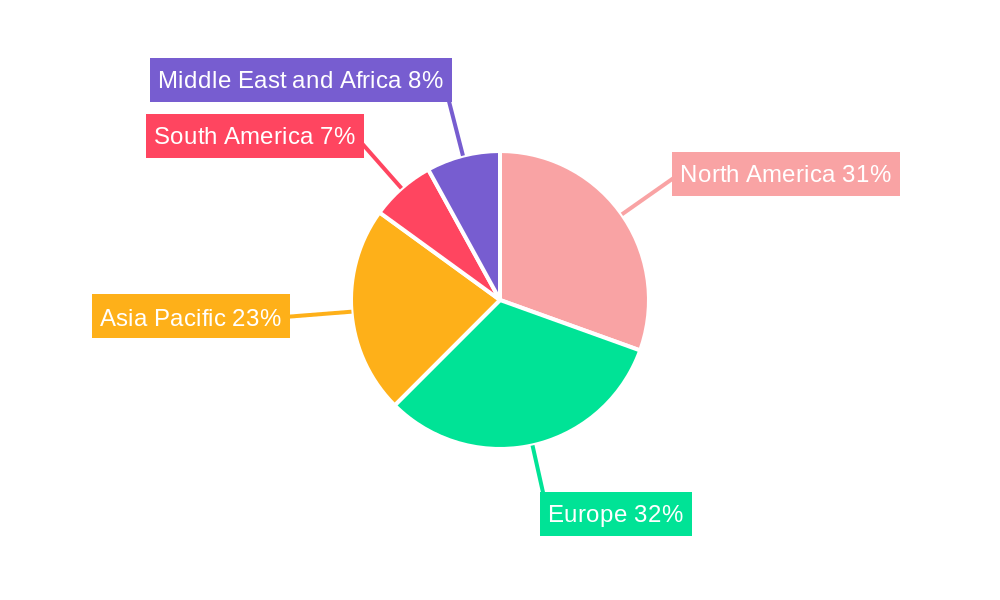
Food Allergen Testing Industry Regional Market Share
Geographic Coverage of Food Allergen Testing Industry
Food Allergen Testing Industry REPORT HIGHLIGHTS
| Aspects | Details |
|---|---|
| Study Period | 2020-2034 |
| Base Year | 2025 |
| Estimated Year | 2026 |
| Forecast Period | 2026-2034 |
| Historical Period | 2020-2025 |
| Growth Rate | CAGR of 7.42% from 2020-2034 |
| Segmentation |
|
Table of Contents
- 1. Introduction
- 1.1. Research Scope
- 1.2. Market Segmentation
- 1.3. Research Objective
- 1.4. Definitions and Assumptions
- 2. Executive Summary
- 2.1. Market Snapshot
- 3. Market Dynamics
- 3.1. Market Drivers
- 3.2. Market Restrains
- 3.3. Market Trends
- 3.4. Market Opportunities
- 4. Market Factor Analysis
- 4.1. Porters Five Forces
- 4.1.1. Bargaining Power of Suppliers
- 4.1.2. Bargaining Power of Buyers
- 4.1.3. Threat of New Entrants
- 4.1.4. Threat of Substitutes
- 4.1.5. Competitive Rivalry
- 4.2. PESTEL analysis
- 4.3. BCG Analysis
- 4.3.1. Stars (High Growth, High Market Share)
- 4.3.2. Cash Cows (Low Growth, High Market Share)
- 4.3.3. Question Mark (High Growth, Low Market Share)
- 4.3.4. Dogs (Low Growth, Low Market Share)
- 4.4. Ansoff Matrix Analysis
- 4.5. Supply Chain Analysis
- 4.6. Regulatory Landscape
- 4.7. Current Market Potential and Opportunity Assessment (TAM–SAM–SOM Framework)
- 4.8. PRI Analyst Note
- 4.1. Porters Five Forces
- 5. Market Analysis, Insights and Forecast 2021-2033
- 5.1. Market Analysis, Insights and Forecast - by Technology
- 5.1.1. Immunoassay-based /ELISA
- 5.1.2. PCR (Polymerase Chain Reaction)-based
- 5.1.3. Other Technologies
- 5.2. Market Analysis, Insights and Forecast - by Application
- 5.2.1. Seafood and Meat Products
- 5.2.2. Dairy Products
- 5.2.3. Beverages
- 5.2.4. Bakery and Confectionery
- 5.2.5. Baby Food and Infant Formula
- 5.2.6. Other Applications
- 5.3. Market Analysis, Insights and Forecast - by Region
- 5.3.1. North America
- 5.3.2. Europe
- 5.3.3. Asia Pacific
- 5.3.4. South America
- 5.3.5. Middle East and Africa
- 5.1. Market Analysis, Insights and Forecast - by Technology
- 6. Global Food Allergen Testing Industry Analysis, Insights and Forecast, 2021-2033
- 6.1. Market Analysis, Insights and Forecast - by Technology
- 6.1.1. Immunoassay-based /ELISA
- 6.1.2. PCR (Polymerase Chain Reaction)-based
- 6.1.3. Other Technologies
- 6.2. Market Analysis, Insights and Forecast - by Application
- 6.2.1. Seafood and Meat Products
- 6.2.2. Dairy Products
- 6.2.3. Beverages
- 6.2.4. Bakery and Confectionery
- 6.2.5. Baby Food and Infant Formula
- 6.2.6. Other Applications
- 6.1. Market Analysis, Insights and Forecast - by Technology
- 7. North America Food Allergen Testing Industry Analysis, Insights and Forecast, 2020-2032
- 7.1. Market Analysis, Insights and Forecast - by Technology
- 7.1.1. Immunoassay-based /ELISA
- 7.1.2. PCR (Polymerase Chain Reaction)-based
- 7.1.3. Other Technologies
- 7.2. Market Analysis, Insights and Forecast - by Application
- 7.2.1. Seafood and Meat Products
- 7.2.2. Dairy Products
- 7.2.3. Beverages
- 7.2.4. Bakery and Confectionery
- 7.2.5. Baby Food and Infant Formula
- 7.2.6. Other Applications
- 7.1. Market Analysis, Insights and Forecast - by Technology
- 8. Europe Food Allergen Testing Industry Analysis, Insights and Forecast, 2020-2032
- 8.1. Market Analysis, Insights and Forecast - by Technology
- 8.1.1. Immunoassay-based /ELISA
- 8.1.2. PCR (Polymerase Chain Reaction)-based
- 8.1.3. Other Technologies
- 8.2. Market Analysis, Insights and Forecast - by Application
- 8.2.1. Seafood and Meat Products
- 8.2.2. Dairy Products
- 8.2.3. Beverages
- 8.2.4. Bakery and Confectionery
- 8.2.5. Baby Food and Infant Formula
- 8.2.6. Other Applications
- 8.1. Market Analysis, Insights and Forecast - by Technology
- 9. Asia Pacific Food Allergen Testing Industry Analysis, Insights and Forecast, 2020-2032
- 9.1. Market Analysis, Insights and Forecast - by Technology
- 9.1.1. Immunoassay-based /ELISA
- 9.1.2. PCR (Polymerase Chain Reaction)-based
- 9.1.3. Other Technologies
- 9.2. Market Analysis, Insights and Forecast - by Application
- 9.2.1. Seafood and Meat Products
- 9.2.2. Dairy Products
- 9.2.3. Beverages
- 9.2.4. Bakery and Confectionery
- 9.2.5. Baby Food and Infant Formula
- 9.2.6. Other Applications
- 9.1. Market Analysis, Insights and Forecast - by Technology
- 10. South America Food Allergen Testing Industry Analysis, Insights and Forecast, 2020-2032
- 10.1. Market Analysis, Insights and Forecast - by Technology
- 10.1.1. Immunoassay-based /ELISA
- 10.1.2. PCR (Polymerase Chain Reaction)-based
- 10.1.3. Other Technologies
- 10.2. Market Analysis, Insights and Forecast - by Application
- 10.2.1. Seafood and Meat Products
- 10.2.2. Dairy Products
- 10.2.3. Beverages
- 10.2.4. Bakery and Confectionery
- 10.2.5. Baby Food and Infant Formula
- 10.2.6. Other Applications
- 10.1. Market Analysis, Insights and Forecast - by Technology
- 11. Middle East and Africa Food Allergen Testing Industry Analysis, Insights and Forecast, 2020-2032
- 11.1. Market Analysis, Insights and Forecast - by Technology
- 11.1.1. Immunoassay-based /ELISA
- 11.1.2. PCR (Polymerase Chain Reaction)-based
- 11.1.3. Other Technologies
- 11.2. Market Analysis, Insights and Forecast - by Application
- 11.2.1. Seafood and Meat Products
- 11.2.2. Dairy Products
- 11.2.3. Beverages
- 11.2.4. Bakery and Confectionery
- 11.2.5. Baby Food and Infant Formula
- 11.2.6. Other Applications
- 11.1. Market Analysis, Insights and Forecast - by Technology
- 12. Competitive Analysis
- 12.1. Company Profiles
- 12.1.1 Intertek Group PLC
- 12.1.1.1. Company Overview
- 12.1.1.2. Products
- 12.1.1.3. Company Financials
- 12.1.1.4. SWOT Analysis
- 12.1.2 Mérieux NutriSciences
- 12.1.2.1. Company Overview
- 12.1.2.2. Products
- 12.1.2.3. Company Financials
- 12.1.2.4. SWOT Analysis
- 12.1.3 Bureau Veritas S A
- 12.1.3.1. Company Overview
- 12.1.3.2. Products
- 12.1.3.3. Company Financials
- 12.1.3.4. SWOT Analysis
- 12.1.4 SGS SA
- 12.1.4.1. Company Overview
- 12.1.4.2. Products
- 12.1.4.3. Company Financials
- 12.1.4.4. SWOT Analysis
- 12.1.5 Crystal Chem Inc
- 12.1.5.1. Company Overview
- 12.1.5.2. Products
- 12.1.5.3. Company Financials
- 12.1.5.4. SWOT Analysis
- 12.1.6 Lifeasible
- 12.1.6.1. Company Overview
- 12.1.6.2. Products
- 12.1.6.3. Company Financials
- 12.1.6.4. SWOT Analysis
- 12.1.7 ALS Limited
- 12.1.7.1. Company Overview
- 12.1.7.2. Products
- 12.1.7.3. Company Financials
- 12.1.7.4. SWOT Analysis
- 12.1.8 Microbac Laboratories Inc
- 12.1.8.1. Company Overview
- 12.1.8.2. Products
- 12.1.8.3. Company Financials
- 12.1.8.4. SWOT Analysis
- 12.1.9 Eurofins Scientific SE
- 12.1.9.1. Company Overview
- 12.1.9.2. Products
- 12.1.9.3. Company Financials
- 12.1.9.4. SWOT Analysis
- 12.1.10 Neogen Corporation
- 12.1.10.1. Company Overview
- 12.1.10.2. Products
- 12.1.10.3. Company Financials
- 12.1.10.4. SWOT Analysis
- 12.1.1 Intertek Group PLC
- 12.2. Market Entropy
- 12.2.1 Company's Key Areas Served
- 12.2.2 Recent Developments
- 12.3. Company Market Share Analysis 2025
- 12.3.1 Top 5 Companies Market Share Analysis
- 12.3.2 Top 3 Companies Market Share Analysis
- 12.4. List of Potential Customers
- 13. Research Methodology
List of Figures
- Figure 1: Global Food Allergen Testing Industry Revenue Breakdown (Million, %) by Region 2025 & 2033
- Figure 2: North America Food Allergen Testing Industry Revenue (Million), by Technology 2025 & 2033
- Figure 3: North America Food Allergen Testing Industry Revenue Share (%), by Technology 2025 & 2033
- Figure 4: North America Food Allergen Testing Industry Revenue (Million), by Application 2025 & 2033
- Figure 5: North America Food Allergen Testing Industry Revenue Share (%), by Application 2025 & 2033
- Figure 6: North America Food Allergen Testing Industry Revenue (Million), by Country 2025 & 2033
- Figure 7: North America Food Allergen Testing Industry Revenue Share (%), by Country 2025 & 2033
- Figure 8: Europe Food Allergen Testing Industry Revenue (Million), by Technology 2025 & 2033
- Figure 9: Europe Food Allergen Testing Industry Revenue Share (%), by Technology 2025 & 2033
- Figure 10: Europe Food Allergen Testing Industry Revenue (Million), by Application 2025 & 2033
- Figure 11: Europe Food Allergen Testing Industry Revenue Share (%), by Application 2025 & 2033
- Figure 12: Europe Food Allergen Testing Industry Revenue (Million), by Country 2025 & 2033
- Figure 13: Europe Food Allergen Testing Industry Revenue Share (%), by Country 2025 & 2033
- Figure 14: Asia Pacific Food Allergen Testing Industry Revenue (Million), by Technology 2025 & 2033
- Figure 15: Asia Pacific Food Allergen Testing Industry Revenue Share (%), by Technology 2025 & 2033
- Figure 16: Asia Pacific Food Allergen Testing Industry Revenue (Million), by Application 2025 & 2033
- Figure 17: Asia Pacific Food Allergen Testing Industry Revenue Share (%), by Application 2025 & 2033
- Figure 18: Asia Pacific Food Allergen Testing Industry Revenue (Million), by Country 2025 & 2033
- Figure 19: Asia Pacific Food Allergen Testing Industry Revenue Share (%), by Country 2025 & 2033
- Figure 20: South America Food Allergen Testing Industry Revenue (Million), by Technology 2025 & 2033
- Figure 21: South America Food Allergen Testing Industry Revenue Share (%), by Technology 2025 & 2033
- Figure 22: South America Food Allergen Testing Industry Revenue (Million), by Application 2025 & 2033
- Figure 23: South America Food Allergen Testing Industry Revenue Share (%), by Application 2025 & 2033
- Figure 24: South America Food Allergen Testing Industry Revenue (Million), by Country 2025 & 2033
- Figure 25: South America Food Allergen Testing Industry Revenue Share (%), by Country 2025 & 2033
- Figure 26: Middle East and Africa Food Allergen Testing Industry Revenue (Million), by Technology 2025 & 2033
- Figure 27: Middle East and Africa Food Allergen Testing Industry Revenue Share (%), by Technology 2025 & 2033
- Figure 28: Middle East and Africa Food Allergen Testing Industry Revenue (Million), by Application 2025 & 2033
- Figure 29: Middle East and Africa Food Allergen Testing Industry Revenue Share (%), by Application 2025 & 2033
- Figure 30: Middle East and Africa Food Allergen Testing Industry Revenue (Million), by Country 2025 & 2033
- Figure 31: Middle East and Africa Food Allergen Testing Industry Revenue Share (%), by Country 2025 & 2033
List of Tables
- Table 1: Global Food Allergen Testing Industry Revenue Million Forecast, by Technology 2020 & 2033
- Table 2: Global Food Allergen Testing Industry Revenue Million Forecast, by Application 2020 & 2033
- Table 3: Global Food Allergen Testing Industry Revenue Million Forecast, by Region 2020 & 2033
- Table 4: Global Food Allergen Testing Industry Revenue Million Forecast, by Technology 2020 & 2033
- Table 5: Global Food Allergen Testing Industry Revenue Million Forecast, by Application 2020 & 2033
- Table 6: Global Food Allergen Testing Industry Revenue Million Forecast, by Country 2020 & 2033
- Table 7: United States Food Allergen Testing Industry Revenue (Million) Forecast, by Application 2020 & 2033
- Table 8: Canada Food Allergen Testing Industry Revenue (Million) Forecast, by Application 2020 & 2033
- Table 9: Mexico Food Allergen Testing Industry Revenue (Million) Forecast, by Application 2020 & 2033
- Table 10: Rest of North America Food Allergen Testing Industry Revenue (Million) Forecast, by Application 2020 & 2033
- Table 11: Global Food Allergen Testing Industry Revenue Million Forecast, by Technology 2020 & 2033
- Table 12: Global Food Allergen Testing Industry Revenue Million Forecast, by Application 2020 & 2033
- Table 13: Global Food Allergen Testing Industry Revenue Million Forecast, by Country 2020 & 2033
- Table 14: Germany Food Allergen Testing Industry Revenue (Million) Forecast, by Application 2020 & 2033
- Table 15: United Kingdom Food Allergen Testing Industry Revenue (Million) Forecast, by Application 2020 & 2033
- Table 16: France Food Allergen Testing Industry Revenue (Million) Forecast, by Application 2020 & 2033
- Table 17: Russia Food Allergen Testing Industry Revenue (Million) Forecast, by Application 2020 & 2033
- Table 18: Spain Food Allergen Testing Industry Revenue (Million) Forecast, by Application 2020 & 2033
- Table 19: Italy Food Allergen Testing Industry Revenue (Million) Forecast, by Application 2020 & 2033
- Table 20: Rest of Europe Food Allergen Testing Industry Revenue (Million) Forecast, by Application 2020 & 2033
- Table 21: Global Food Allergen Testing Industry Revenue Million Forecast, by Technology 2020 & 2033
- Table 22: Global Food Allergen Testing Industry Revenue Million Forecast, by Application 2020 & 2033
- Table 23: Global Food Allergen Testing Industry Revenue Million Forecast, by Country 2020 & 2033
- Table 24: India Food Allergen Testing Industry Revenue (Million) Forecast, by Application 2020 & 2033
- Table 25: China Food Allergen Testing Industry Revenue (Million) Forecast, by Application 2020 & 2033
- Table 26: Japan Food Allergen Testing Industry Revenue (Million) Forecast, by Application 2020 & 2033
- Table 27: Australia Food Allergen Testing Industry Revenue (Million) Forecast, by Application 2020 & 2033
- Table 28: Rest of Asia Pacific Food Allergen Testing Industry Revenue (Million) Forecast, by Application 2020 & 2033
- Table 29: Global Food Allergen Testing Industry Revenue Million Forecast, by Technology 2020 & 2033
- Table 30: Global Food Allergen Testing Industry Revenue Million Forecast, by Application 2020 & 2033
- Table 31: Global Food Allergen Testing Industry Revenue Million Forecast, by Country 2020 & 2033
- Table 32: Brazil Food Allergen Testing Industry Revenue (Million) Forecast, by Application 2020 & 2033
- Table 33: Argentina Food Allergen Testing Industry Revenue (Million) Forecast, by Application 2020 & 2033
- Table 34: Rest of South America Food Allergen Testing Industry Revenue (Million) Forecast, by Application 2020 & 2033
- Table 35: Global Food Allergen Testing Industry Revenue Million Forecast, by Technology 2020 & 2033
- Table 36: Global Food Allergen Testing Industry Revenue Million Forecast, by Application 2020 & 2033
- Table 37: Global Food Allergen Testing Industry Revenue Million Forecast, by Country 2020 & 2033
- Table 38: South Africa Food Allergen Testing Industry Revenue (Million) Forecast, by Application 2020 & 2033
- Table 39: Saudi Arabia Food Allergen Testing Industry Revenue (Million) Forecast, by Application 2020 & 2033
- Table 40: Rest of Middle East and Africa Food Allergen Testing Industry Revenue (Million) Forecast, by Application 2020 & 2033
Frequently Asked Questions
1. What is the projected Compound Annual Growth Rate (CAGR) of the Food Allergen Testing Industry?
The projected CAGR is approximately 7.42%.
2. Which companies are prominent players in the Food Allergen Testing Industry?
Key companies in the market include Intertek Group PLC, Mérieux NutriSciences, Bureau Veritas S A, SGS SA, Crystal Chem Inc , Lifeasible, ALS Limited, Microbac Laboratories Inc, Eurofins Scientific SE, Neogen Corporation.
3. What are the main segments of the Food Allergen Testing Industry?
The market segments include Technology, Application .
4. Can you provide details about the market size?
The market size is estimated to be USD 0.89 Million as of 2022.
5. What are some drivers contributing to market growth?
Increasing Incidences of Food Allergies; Favorable Government Initiatives and Regulations for Food Safety.
6. What are the notable trends driving market growth?
Increasing Prevalence of Food Allergies.
7. Are there any restraints impacting market growth?
Inconsistencies Involved in Food Allergen Declarations.
8. Can you provide examples of recent developments in the market?
March 2024: Gold Standard Diagnostics launched the first product of the new allergen PowerLine tests: the SENSIStrip Gluten PowerLine Lateral Flow Device. The product comprises a sensitive detection system based on a monoclonal antibody and can detect gluten residues in food matrices, rinse water, and swabs.
9. What pricing options are available for accessing the report?
Pricing options include single-user, multi-user, and enterprise licenses priced at USD 4750, USD 5250, and USD 8750 respectively.
10. Is the market size provided in terms of value or volume?
The market size is provided in terms of value, measured in Million.
11. Are there any specific market keywords associated with the report?
Yes, the market keyword associated with the report is "Food Allergen Testing Industry," which aids in identifying and referencing the specific market segment covered.
12. How do I determine which pricing option suits my needs best?
The pricing options vary based on user requirements and access needs. Individual users may opt for single-user licenses, while businesses requiring broader access may choose multi-user or enterprise licenses for cost-effective access to the report.
13. Are there any additional resources or data provided in the Food Allergen Testing Industry report?
While the report offers comprehensive insights, it's advisable to review the specific contents or supplementary materials provided to ascertain if additional resources or data are available.
14. How can I stay updated on further developments or reports in the Food Allergen Testing Industry?
To stay informed about further developments, trends, and reports in the Food Allergen Testing Industry, consider subscribing to industry newsletters, following relevant companies and organizations, or regularly checking reputable industry news sources and publications.
Methodology
Step 1 - Identification of Relevant Samples Size from Population Database


Step 2 - Approaches for Defining Global Market Size (Value, Volume* & Price*)

Note*: In applicable scenarios
Step 3 - Data Sources
Primary Research
- Web Analytics
- Survey Reports
- Research Institute
- Latest Research Reports
- Opinion Leaders
Secondary Research
- Annual Reports
- White Paper
- Latest Press Release
- Industry Association
- Paid Database
- Investor Presentations

Step 4 - Data Triangulation
Involves using different sources of information in order to increase the validity of a study
These sources are likely to be stakeholders in a program - participants, other researchers, program staff, other community members, and so on.
Then we put all data in single framework & apply various statistical tools to find out the dynamic on the market.
During the analysis stage, feedback from the stakeholder groups would be compared to determine areas of agreement as well as areas of divergence