Key Insights
The global Fructosamine Reagents market is poised for significant expansion, projected to reach USD 1.4 billion in 2025 and exhibit a robust Compound Annual Growth Rate (CAGR) of 7.2% throughout the forecast period extending to 2033. This growth is primarily propelled by the escalating prevalence of diabetes globally, particularly Type 1 and Type 2 diabetes, necessitating accurate and timely monitoring of glycemic control. Fructosamine testing offers a valuable alternative to HbA1c, providing insights into average blood glucose levels over the preceding two to three weeks, making it crucial for managing short-term glycemic fluctuations and for patients with conditions affecting red blood cell turnover. The market is further driven by advancements in diagnostic technologies, leading to more sensitive and efficient reagent formulations. Increased healthcare expenditure and a growing awareness among patients and healthcare professionals regarding proactive diabetes management are also key contributors to this positive market trajectory. The demand for these reagents is also influenced by the increasing adoption of point-of-care testing and home-based monitoring solutions, allowing for greater accessibility and convenience in diabetes management.
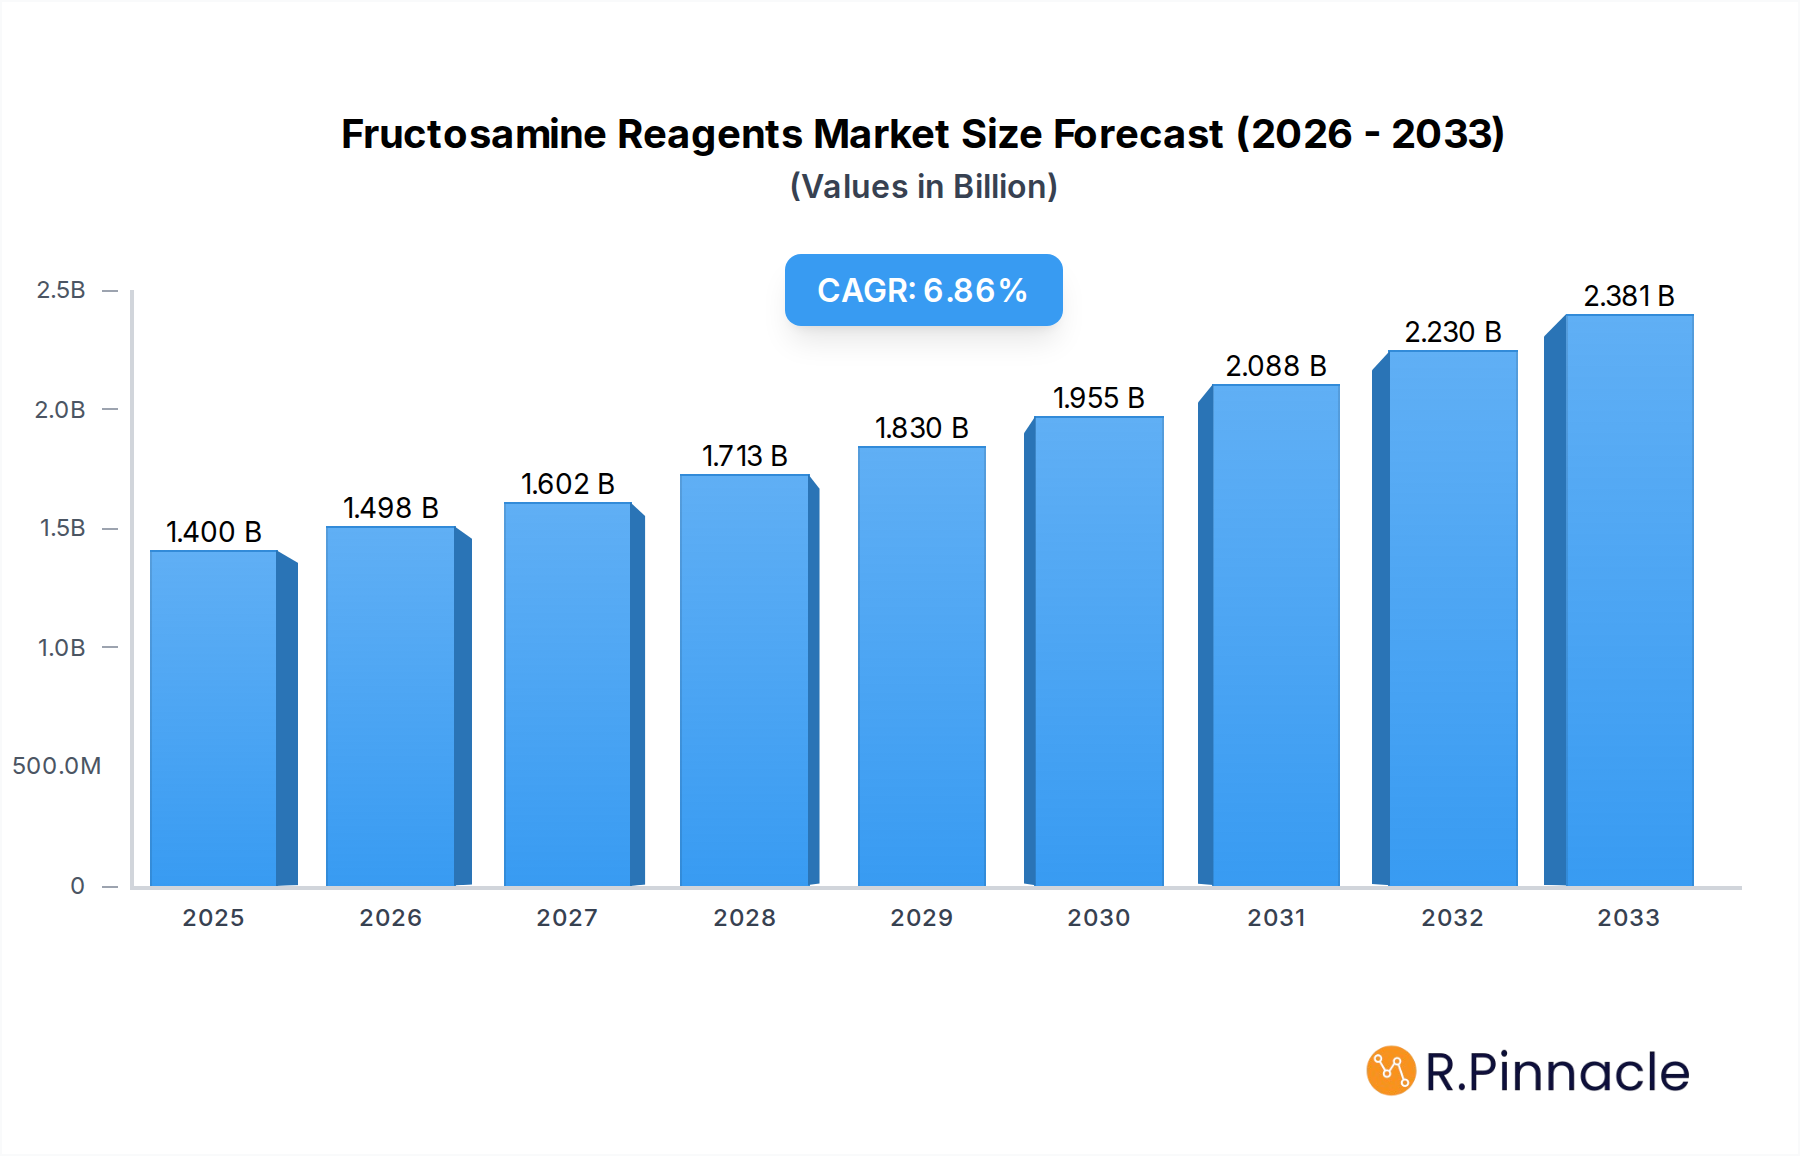
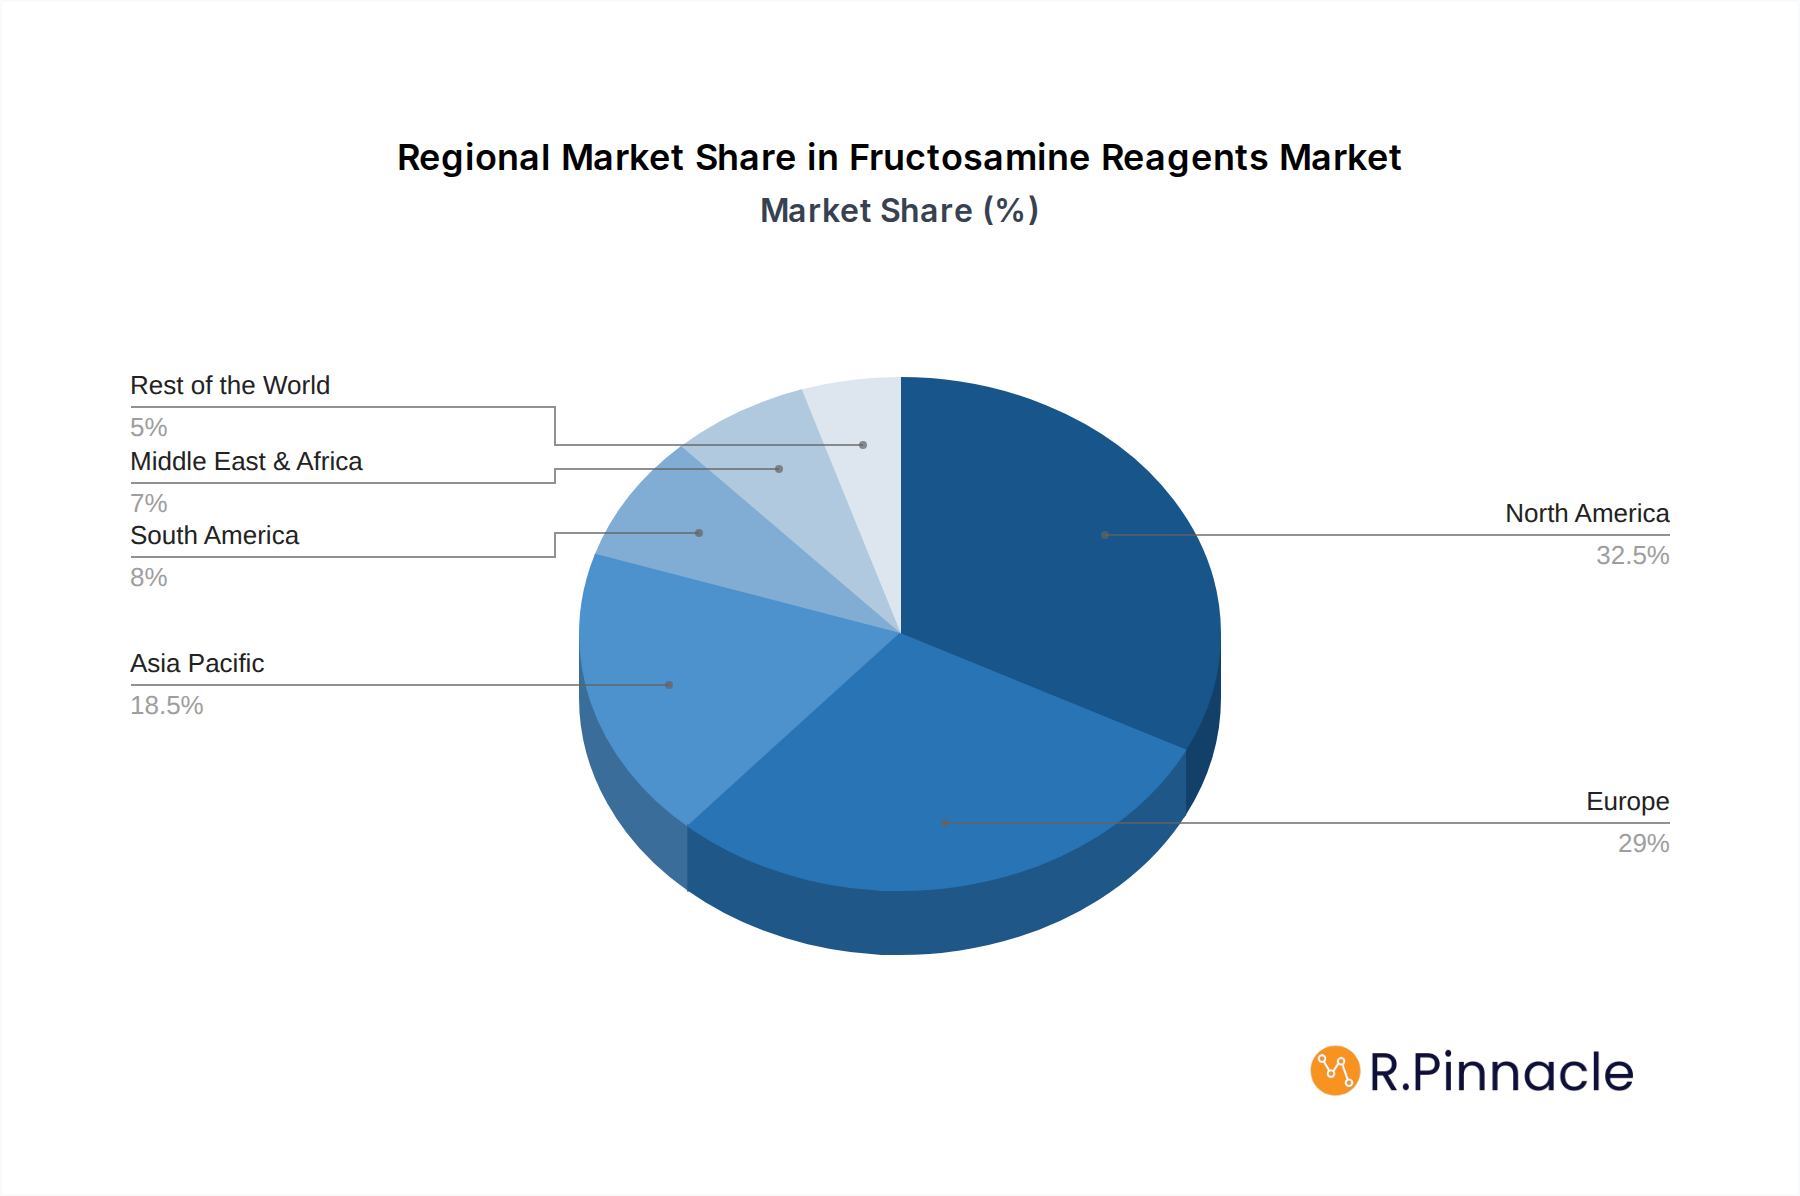
Fructosamine Reagents Market Size (In Billion)
The market landscape for Fructosamine Reagents is characterized by a diverse range of product offerings, catering to various testing methodologies and volume requirements, with key pack sizes including R1 223 ml; R2 27.5 ml, R1 525 ml; R2 56.3 ml, and R1 419.8 ml; R2 46.9 ml, alongside other specialized formats. Key players such as Biosystems S.A., Randox Laboratories Ltd., Sekisui Diagnostics, Kamiya Biomedical Co., Sentinel Diagnostics, and Asahi Kasei Pharma Corporation are actively engaged in research and development to enhance product performance and expand their market reach. Geographically, North America and Europe currently dominate the market due to well-established healthcare infrastructures and high diabetes incidence. However, the Asia Pacific region is expected to witness the fastest growth, driven by increasing healthcare investments, rising disposable incomes, and a growing focus on chronic disease management. Restraints such as the established dominance of HbA1c testing and the cost sensitivity in certain emerging economies may pose challenges, but the inherent advantages of fructosamine testing in specific clinical scenarios are expected to sustain its market relevance and drive continued growth.

Fructosamine Reagents Company Market Share
This in-depth report offers a meticulous examination of the global Fructosamine Reagents market, providing actionable insights and strategic intelligence for stakeholders. Covering a comprehensive study period from 2019 to 2033, with a base and estimated year of 2025, this report delves into market dynamics, key players, segmentation, and future projections. We leverage high-ranking keywords such as "fructosamine testing," "diabetes diagnosis reagents," "glycated protein measurement," and "HbA1c alternatives" to ensure maximum visibility for industry professionals seeking critical data on this vital diagnostic sector.
Fructosamine Reagents Market Structure & Innovation Trends
The fructosamine reagents market exhibits a moderately concentrated structure, driven by innovation in diagnostic assay development and increasing demand for diabetes management tools. Key innovation drivers include the pursuit of enhanced assay sensitivity, reduced turnaround times, and improved multiplexing capabilities. Regulatory frameworks, particularly those from bodies like the FDA and EMA, play a crucial role in dictating product approval and market entry, influencing the pace of innovation. While direct product substitutes are limited, the broader market for diabetes diagnostics, including HbA1c testing, presents an indirect competitive landscape. End-user demographics are predominantly healthcare professionals, including endocrinologists, diabetologists, and clinical laboratory technicians. Merger and acquisition (M&A) activities have been observed, with estimated deal values in the hundreds of billions, reflecting strategic consolidation and the acquisition of novel technologies. The market share of leading players varies, with Biosystems S.A. and Randox Laboratories Ltd. holding significant portions.
Fructosamine Reagents Market Dynamics & Trends
The global fructosamine reagents market is poised for robust expansion, fueled by a confluence of compelling growth drivers and transformative trends. The increasing global prevalence of diabetes, particularly Type 2 diabetes, stands as the foremost catalyst, driving sustained demand for accurate and accessible diagnostic tools. This epidemiological shift is amplified by a growing awareness among both healthcare providers and patients regarding the importance of regular glycemic monitoring for preventing long-term complications. Technological disruptions are continuously reshaping the landscape, with advancements in immunoassay technology and automated diagnostic platforms leading to more efficient and user-friendly fructosamine testing solutions. The development of point-of-care (POC) fructosamine assays, offering rapid results, is gaining traction, catering to the growing preference for decentralized diagnostic testing in primary care settings.
Consumer preferences are increasingly leaning towards diagnostic solutions that offer convenience, speed, and affordability. Fructosamine testing, as a cost-effective alternative to HbA1c testing in certain clinical scenarios, aligns well with these preferences. Furthermore, the growing emphasis on personalized medicine and proactive health management encourages the adoption of routine fructosamine testing for comprehensive diabetes care.
Competitive dynamics are characterized by intense innovation and strategic partnerships. Companies are investing heavily in research and development to enhance assay performance, reduce reagent costs, and expand their product portfolios to cater to diverse laboratory needs. The market penetration of fructosamine reagents is steadily increasing as healthcare systems recognize their value in routine diabetes screening and management. The Compound Annual Growth Rate (CAGR) is projected to be in the double digits, estimated at approximately 12.5% over the forecast period. This sustained growth trajectory underscores the market's potential and the increasing reliance on fructosamine reagents for effective diabetes care.
Dominant Regions & Segments in Fructosamine Reagents
North America currently dominates the global fructosamine reagents market, driven by its advanced healthcare infrastructure, high incidence of diabetes, and substantial investment in diagnostic research and development. The United States, in particular, represents a significant market share due to its large population, widespread adoption of advanced diagnostic technologies, and robust reimbursement policies for diabetes care. Economic policies that support healthcare access and innovation further bolster the region's leading position.
Within the application segment, Type 2 Diabetes holds the largest market share. This is directly attributable to the disproportionately high prevalence of Type 2 diabetes globally, making it the primary target population for fructosamine testing. The need for routine monitoring and early detection in this demographic is immense.
Regarding product types, the R1 223 ml; R2 27.5 ml and R1 525 ml; R2 56.3 ml formats are experiencing significant demand. These sizes cater to the varied throughput requirements of clinical laboratories, from mid-sized facilities to high-volume testing centers. The availability of different reagent volumes allows for flexibility and cost-effectiveness in laboratory operations. The "Others" category, encompassing specialized or research-grade fructosamine reagents, also contributes to market growth, albeit with a smaller share.
Key drivers for regional dominance include:
- Economic Policies: Government initiatives promoting diabetes research and preventative healthcare services.
- Infrastructure: Well-established healthcare networks and a high density of diagnostic laboratories.
- Technological Adoption: Early and widespread adoption of automated immunoassay systems.
- Awareness Programs: Extensive public health campaigns focused on diabetes prevention and management.
The continuous evolution of diagnostic technologies and the increasing focus on proactive diabetes management are expected to sustain the dominance of these regions and segments in the foreseeable future.
Fructosamine Reagents Product Innovations
Product innovations in the fructosamine reagents sector are primarily focused on enhancing assay accuracy, improving assay speed, and expanding compatibility with automated diagnostic platforms. Companies are developing reagents with higher sensitivity and specificity to provide more reliable diagnostic data. Miniaturization and the development of user-friendly reagent kits, such as the R1 223 ml; R2 27.5 ml and R1 525 ml; R2 56.3 ml formats, offer convenience and cost-effectiveness for laboratories of varying sizes. These innovations aim to streamline the testing process, reduce hands-on time for technicians, and ultimately contribute to better patient outcomes by facilitating timely and precise diabetes monitoring.
Report Scope & Segmentation Analysis
This report meticulously segments the fructosamine reagents market across key parameters to provide granular insights.
Application Segments:
- Type 1 Diabetes: This segment focuses on fructosamine reagents used in the diagnosis and management of Type 1 diabetes, characterized by absolute insulin deficiency. Growth projections for this segment are steady, driven by the ongoing need for accurate glycemic control. Market sizes are estimated in the hundreds of millions, with competitive dynamics reflecting specialized reagent development.
- Type 2 Diabetes: Representing the largest segment, this analysis covers reagents for Type 2 diabetes, a condition marked by insulin resistance. The market size for this segment is projected to reach billions by 2033, with strong growth fueled by the escalating global prevalence of the disease. Competitive dynamics are intense, with numerous manufacturers vying for market share.
- Others: This category encompasses reagents used in research settings or for less common glycation-related studies. While a smaller segment, it exhibits niche growth opportunities.
Type Segments:
- R1 223 ml; R2 27.5 ml: This segmentation analyzes the market for specific reagent kit sizes, catering to mid-throughput laboratories. Growth projections are robust, aligned with the overall diagnostic market. Market sizes are estimated in the hundreds of millions.
- R1 525 ml; R2 56.3 ml: This focuses on larger volume reagent kits, suitable for high-throughput clinical settings. This segment is expected to experience significant growth, driven by automation trends. Market sizes are projected to reach billions.
- R1 419.8 ml; R2 46.9 ml: This addresses another common reagent volume configuration, offering flexibility to laboratories. Growth is projected to be moderate, with market sizes in the hundreds of millions.
- Others: This includes specialized packaging or unique reagent formulations.
Key Drivers of Fructosamine Reagents Growth
The growth of the fructosamine reagents market is propelled by several key drivers:
- Rising Global Diabetes Prevalence: The escalating incidence of Type 1 and especially Type 2 diabetes worldwide creates an ever-increasing demand for reliable diagnostic tools like fructosamine reagents.
- Technological Advancements in Diagnostic Assays: Continuous innovation in immunoassay technologies and automation leads to more accurate, faster, and cost-effective fructosamine testing.
- Cost-Effectiveness Compared to HbA1c: In certain clinical contexts, fructosamine testing offers a more economical alternative to HbA1c testing, making it attractive for resource-limited settings and routine screening.
- Growing Emphasis on Chronic Disease Management: Healthcare systems are increasingly prioritizing proactive management of chronic conditions, including diabetes, necessitating regular monitoring of glycemic control.
- Expansion of Point-of-Care (POC) Diagnostics: The trend towards decentralized testing and the development of POC fructosamine assays are expanding access and convenience.
Challenges in the Fructosamine Reagents Sector
Despite its promising growth, the fructosamine reagents sector faces several challenges:
- Competition from HbA1c Testing: HbA1c testing remains the gold standard for long-term glycemic control in many regions, posing significant competition to fructosamine reagents.
- Regulatory Hurdles: Obtaining regulatory approval for new diagnostic reagents can be a lengthy and complex process, potentially slowing down market entry for innovative products.
- Standardization and Harmonization: Ensuring consistent results across different laboratory platforms and reagent manufacturers requires ongoing efforts in standardization and harmonization.
- Reimbursement Policies: Variations in reimbursement policies for fructosamine testing across different healthcare systems can impact market adoption.
- Supply Chain Vulnerabilities: Like many industries, the fructosamine reagents market is susceptible to disruptions in the global supply chain, affecting the availability and cost of raw materials.
Emerging Opportunities in Fructosamine Reagents
The fructosamine reagents market presents several exciting emerging opportunities:
- Development of Advanced POC Fructosamine Assays: Further innovation in point-of-care testing can lead to highly portable, user-friendly devices for rapid fructosamine assessment in primary care settings and remote areas.
- Integration with Digital Health Platforms: Coupling fructosamine data with digital health platforms and AI-driven analytics can offer personalized insights and improved patient management strategies.
- Emerging Markets with High Diabetes Burden: The rapidly growing diabetes prevalence in emerging economies, such as parts of Asia and Africa, offers significant untapped market potential.
- Multiplexed Diagnostic Panels: Developing reagents that can simultaneously measure fructosamine alongside other relevant biomarkers could offer more comprehensive diagnostic information.
- Research into Non-Glycemic Applications: Exploring potential new applications of fructosamine measurement beyond standard diabetes monitoring could open up novel market avenues.
Leading Players in the Fructosamine Reagents Market
- Biosystems S.A.
- Randox Laboratories Ltd.
- Sekisui Diagnostics
- Kamiya Biomedical Co.
- Sentinel Diagnostics
- Asahi Kasei Pharma Corporation
Key Developments in Fructosamine Reagents Industry
- 2023 (Q4): Launch of a new, high-sensitivity fructosamine assay by Randox Laboratories Ltd., enhancing diagnostic accuracy for Type 2 diabetes management.
- 2023 (Q3): Biosystems S.A. announces strategic partnership with a leading diabetes technology firm to integrate fructosamine data into continuous glucose monitoring platforms.
- 2022 (Q2): Sekisui Diagnostics expands its diagnostic reagent portfolio with the introduction of a new fructosamine kit optimized for automated immunoassay analyzers.
- 2022 (Q1): Kamiya Biomedical Co. receives CE marking for its novel fructosamine reagent, facilitating its wider adoption across European markets.
- 2021 (Q4): Sentinel Diagnostics invests in R&D for the development of more stable and cost-effective fructosamine reagents.
- 2021 (Q2): Asahi Kasei Pharma Corporation reports positive clinical trial results for a new reagent formulation aimed at reducing assay interference.
Future Outlook for Fructosamine Reagents Market
The future outlook for the fructosamine reagents market is exceptionally bright, characterized by sustained growth driven by the persistent global rise in diabetes prevalence and ongoing technological innovation. The increasing focus on preventative healthcare and the demand for cost-effective diagnostic solutions will further accelerate market expansion. Opportunities lie in the development of more advanced point-of-care testing solutions, integration with digital health ecosystems, and targeting the burgeoning markets in developing nations. Strategic collaborations and continued investment in research and development will be crucial for market players to capitalize on emerging trends and maintain a competitive edge in this vital segment of the in-vitro diagnostics industry. The market is projected to see significant growth, with an estimated value in the billions by the end of the forecast period.
Fructosamine Reagents Segmentation
-
1. Application
- 1.1. Type 1 Diabetes
- 1.2. Type 2 Diabetes
-
2. Types
- 2.1. R1 2*23 ml; R2 2*7.5 ml
- 2.2. R1 5*25 ml; R2 5*6.3 ml
- 2.3. R1 4*19.8 ml; R2 4*6.9 ml
- 2.4. Others
Fructosamine Reagents Segmentation By Geography
-
1. North America
- 1.1. United States
- 1.2. Canada
- 1.3. Mexico
-
2. South America
- 2.1. Brazil
- 2.2. Argentina
- 2.3. Rest of South America
-
3. Europe
- 3.1. United Kingdom
- 3.2. Germany
- 3.3. France
- 3.4. Italy
- 3.5. Spain
- 3.6. Russia
- 3.7. Benelux
- 3.8. Nordics
- 3.9. Rest of Europe
-
4. Middle East & Africa
- 4.1. Turkey
- 4.2. Israel
- 4.3. GCC
- 4.4. North Africa
- 4.5. South Africa
- 4.6. Rest of Middle East & Africa
-
5. Asia Pacific
- 5.1. China
- 5.2. India
- 5.3. Japan
- 5.4. South Korea
- 5.5. ASEAN
- 5.6. Oceania
- 5.7. Rest of Asia Pacific
Fructosamine Reagents Regional Market Share
Geographic Coverage of Fructosamine Reagents
Fructosamine Reagents REPORT HIGHLIGHTS
| Aspects | Details |
|---|---|
| Study Period | 2020-2034 |
| Base Year | 2025 |
| Estimated Year | 2026 |
| Forecast Period | 2026-2034 |
| Historical Period | 2020-2025 |
| Growth Rate | CAGR of 7.2% from 2020-2034 |
| Segmentation |
|
Table of Contents
- 1. Introduction
- 1.1. Research Scope
- 1.2. Market Segmentation
- 1.3. Research Objective
- 1.4. Definitions and Assumptions
- 2. Executive Summary
- 2.1. Market Snapshot
- 3. Market Dynamics
- 3.1. Market Drivers
- 3.2. Market Restrains
- 3.3. Market Trends
- 3.4. Market Opportunities
- 4. Market Factor Analysis
- 4.1. Porters Five Forces
- 4.1.1. Bargaining Power of Suppliers
- 4.1.2. Bargaining Power of Buyers
- 4.1.3. Threat of New Entrants
- 4.1.4. Threat of Substitutes
- 4.1.5. Competitive Rivalry
- 4.2. PESTEL analysis
- 4.3. BCG Analysis
- 4.3.1. Stars (High Growth, High Market Share)
- 4.3.2. Cash Cows (Low Growth, High Market Share)
- 4.3.3. Question Mark (High Growth, Low Market Share)
- 4.3.4. Dogs (Low Growth, Low Market Share)
- 4.4. Ansoff Matrix Analysis
- 4.5. Supply Chain Analysis
- 4.6. Regulatory Landscape
- 4.7. Current Market Potential and Opportunity Assessment (TAM–SAM–SOM Framework)
- 4.8. PRI Analyst Note
- 4.1. Porters Five Forces
- 5. Market Analysis, Insights and Forecast 2021-2033
- 5.1. Market Analysis, Insights and Forecast - by Application
- 5.1.1. Type 1 Diabetes
- 5.1.2. Type 2 Diabetes
- 5.2. Market Analysis, Insights and Forecast - by Types
- 5.2.1. R1 2*23 ml; R2 2*7.5 ml
- 5.2.2. R1 5*25 ml; R2 5*6.3 ml
- 5.2.3. R1 4*19.8 ml; R2 4*6.9 ml
- 5.2.4. Others
- 5.3. Market Analysis, Insights and Forecast - by Region
- 5.3.1. North America
- 5.3.2. South America
- 5.3.3. Europe
- 5.3.4. Middle East & Africa
- 5.3.5. Asia Pacific
- 5.1. Market Analysis, Insights and Forecast - by Application
- 6. Global Fructosamine Reagents Analysis, Insights and Forecast, 2021-2033
- 6.1. Market Analysis, Insights and Forecast - by Application
- 6.1.1. Type 1 Diabetes
- 6.1.2. Type 2 Diabetes
- 6.2. Market Analysis, Insights and Forecast - by Types
- 6.2.1. R1 2*23 ml; R2 2*7.5 ml
- 6.2.2. R1 5*25 ml; R2 5*6.3 ml
- 6.2.3. R1 4*19.8 ml; R2 4*6.9 ml
- 6.2.4. Others
- 6.1. Market Analysis, Insights and Forecast - by Application
- 7. North America Fructosamine Reagents Analysis, Insights and Forecast, 2020-2032
- 7.1. Market Analysis, Insights and Forecast - by Application
- 7.1.1. Type 1 Diabetes
- 7.1.2. Type 2 Diabetes
- 7.2. Market Analysis, Insights and Forecast - by Types
- 7.2.1. R1 2*23 ml; R2 2*7.5 ml
- 7.2.2. R1 5*25 ml; R2 5*6.3 ml
- 7.2.3. R1 4*19.8 ml; R2 4*6.9 ml
- 7.2.4. Others
- 7.1. Market Analysis, Insights and Forecast - by Application
- 8. South America Fructosamine Reagents Analysis, Insights and Forecast, 2020-2032
- 8.1. Market Analysis, Insights and Forecast - by Application
- 8.1.1. Type 1 Diabetes
- 8.1.2. Type 2 Diabetes
- 8.2. Market Analysis, Insights and Forecast - by Types
- 8.2.1. R1 2*23 ml; R2 2*7.5 ml
- 8.2.2. R1 5*25 ml; R2 5*6.3 ml
- 8.2.3. R1 4*19.8 ml; R2 4*6.9 ml
- 8.2.4. Others
- 8.1. Market Analysis, Insights and Forecast - by Application
- 9. Europe Fructosamine Reagents Analysis, Insights and Forecast, 2020-2032
- 9.1. Market Analysis, Insights and Forecast - by Application
- 9.1.1. Type 1 Diabetes
- 9.1.2. Type 2 Diabetes
- 9.2. Market Analysis, Insights and Forecast - by Types
- 9.2.1. R1 2*23 ml; R2 2*7.5 ml
- 9.2.2. R1 5*25 ml; R2 5*6.3 ml
- 9.2.3. R1 4*19.8 ml; R2 4*6.9 ml
- 9.2.4. Others
- 9.1. Market Analysis, Insights and Forecast - by Application
- 10. Middle East & Africa Fructosamine Reagents Analysis, Insights and Forecast, 2020-2032
- 10.1. Market Analysis, Insights and Forecast - by Application
- 10.1.1. Type 1 Diabetes
- 10.1.2. Type 2 Diabetes
- 10.2. Market Analysis, Insights and Forecast - by Types
- 10.2.1. R1 2*23 ml; R2 2*7.5 ml
- 10.2.2. R1 5*25 ml; R2 5*6.3 ml
- 10.2.3. R1 4*19.8 ml; R2 4*6.9 ml
- 10.2.4. Others
- 10.1. Market Analysis, Insights and Forecast - by Application
- 11. Asia Pacific Fructosamine Reagents Analysis, Insights and Forecast, 2020-2032
- 11.1. Market Analysis, Insights and Forecast - by Application
- 11.1.1. Type 1 Diabetes
- 11.1.2. Type 2 Diabetes
- 11.2. Market Analysis, Insights and Forecast - by Types
- 11.2.1. R1 2*23 ml; R2 2*7.5 ml
- 11.2.2. R1 5*25 ml; R2 5*6.3 ml
- 11.2.3. R1 4*19.8 ml; R2 4*6.9 ml
- 11.2.4. Others
- 11.1. Market Analysis, Insights and Forecast - by Application
- 12. Competitive Analysis
- 12.1. Company Profiles
- 12.1.1 Biosystems S.A.
- 12.1.1.1. Company Overview
- 12.1.1.2. Products
- 12.1.1.3. Company Financials
- 12.1.1.4. SWOT Analysis
- 12.1.2 Randox Laboratories Ltd.
- 12.1.2.1. Company Overview
- 12.1.2.2. Products
- 12.1.2.3. Company Financials
- 12.1.2.4. SWOT Analysis
- 12.1.3 Sekisui Diagnostics
- 12.1.3.1. Company Overview
- 12.1.3.2. Products
- 12.1.3.3. Company Financials
- 12.1.3.4. SWOT Analysis
- 12.1.4 Kamiya Biomedical Co.
- 12.1.4.1. Company Overview
- 12.1.4.2. Products
- 12.1.4.3. Company Financials
- 12.1.4.4. SWOT Analysis
- 12.1.5 Sentinel Diagnostics
- 12.1.5.1. Company Overview
- 12.1.5.2. Products
- 12.1.5.3. Company Financials
- 12.1.5.4. SWOT Analysis
- 12.1.6 Asahi Kasei Pharma Corporation
- 12.1.6.1. Company Overview
- 12.1.6.2. Products
- 12.1.6.3. Company Financials
- 12.1.6.4. SWOT Analysis
- 12.1.1 Biosystems S.A.
- 12.2. Market Entropy
- 12.2.1 Company's Key Areas Served
- 12.2.2 Recent Developments
- 12.3. Company Market Share Analysis 2025
- 12.3.1 Top 5 Companies Market Share Analysis
- 12.3.2 Top 3 Companies Market Share Analysis
- 12.4. List of Potential Customers
- 13. Research Methodology
List of Figures
- Figure 1: Global Fructosamine Reagents Revenue Breakdown (undefined, %) by Region 2025 & 2033
- Figure 2: Global Fructosamine Reagents Volume Breakdown (K, %) by Region 2025 & 2033
- Figure 3: North America Fructosamine Reagents Revenue (undefined), by Application 2025 & 2033
- Figure 4: North America Fructosamine Reagents Volume (K), by Application 2025 & 2033
- Figure 5: North America Fructosamine Reagents Revenue Share (%), by Application 2025 & 2033
- Figure 6: North America Fructosamine Reagents Volume Share (%), by Application 2025 & 2033
- Figure 7: North America Fructosamine Reagents Revenue (undefined), by Types 2025 & 2033
- Figure 8: North America Fructosamine Reagents Volume (K), by Types 2025 & 2033
- Figure 9: North America Fructosamine Reagents Revenue Share (%), by Types 2025 & 2033
- Figure 10: North America Fructosamine Reagents Volume Share (%), by Types 2025 & 2033
- Figure 11: North America Fructosamine Reagents Revenue (undefined), by Country 2025 & 2033
- Figure 12: North America Fructosamine Reagents Volume (K), by Country 2025 & 2033
- Figure 13: North America Fructosamine Reagents Revenue Share (%), by Country 2025 & 2033
- Figure 14: North America Fructosamine Reagents Volume Share (%), by Country 2025 & 2033
- Figure 15: South America Fructosamine Reagents Revenue (undefined), by Application 2025 & 2033
- Figure 16: South America Fructosamine Reagents Volume (K), by Application 2025 & 2033
- Figure 17: South America Fructosamine Reagents Revenue Share (%), by Application 2025 & 2033
- Figure 18: South America Fructosamine Reagents Volume Share (%), by Application 2025 & 2033
- Figure 19: South America Fructosamine Reagents Revenue (undefined), by Types 2025 & 2033
- Figure 20: South America Fructosamine Reagents Volume (K), by Types 2025 & 2033
- Figure 21: South America Fructosamine Reagents Revenue Share (%), by Types 2025 & 2033
- Figure 22: South America Fructosamine Reagents Volume Share (%), by Types 2025 & 2033
- Figure 23: South America Fructosamine Reagents Revenue (undefined), by Country 2025 & 2033
- Figure 24: South America Fructosamine Reagents Volume (K), by Country 2025 & 2033
- Figure 25: South America Fructosamine Reagents Revenue Share (%), by Country 2025 & 2033
- Figure 26: South America Fructosamine Reagents Volume Share (%), by Country 2025 & 2033
- Figure 27: Europe Fructosamine Reagents Revenue (undefined), by Application 2025 & 2033
- Figure 28: Europe Fructosamine Reagents Volume (K), by Application 2025 & 2033
- Figure 29: Europe Fructosamine Reagents Revenue Share (%), by Application 2025 & 2033
- Figure 30: Europe Fructosamine Reagents Volume Share (%), by Application 2025 & 2033
- Figure 31: Europe Fructosamine Reagents Revenue (undefined), by Types 2025 & 2033
- Figure 32: Europe Fructosamine Reagents Volume (K), by Types 2025 & 2033
- Figure 33: Europe Fructosamine Reagents Revenue Share (%), by Types 2025 & 2033
- Figure 34: Europe Fructosamine Reagents Volume Share (%), by Types 2025 & 2033
- Figure 35: Europe Fructosamine Reagents Revenue (undefined), by Country 2025 & 2033
- Figure 36: Europe Fructosamine Reagents Volume (K), by Country 2025 & 2033
- Figure 37: Europe Fructosamine Reagents Revenue Share (%), by Country 2025 & 2033
- Figure 38: Europe Fructosamine Reagents Volume Share (%), by Country 2025 & 2033
- Figure 39: Middle East & Africa Fructosamine Reagents Revenue (undefined), by Application 2025 & 2033
- Figure 40: Middle East & Africa Fructosamine Reagents Volume (K), by Application 2025 & 2033
- Figure 41: Middle East & Africa Fructosamine Reagents Revenue Share (%), by Application 2025 & 2033
- Figure 42: Middle East & Africa Fructosamine Reagents Volume Share (%), by Application 2025 & 2033
- Figure 43: Middle East & Africa Fructosamine Reagents Revenue (undefined), by Types 2025 & 2033
- Figure 44: Middle East & Africa Fructosamine Reagents Volume (K), by Types 2025 & 2033
- Figure 45: Middle East & Africa Fructosamine Reagents Revenue Share (%), by Types 2025 & 2033
- Figure 46: Middle East & Africa Fructosamine Reagents Volume Share (%), by Types 2025 & 2033
- Figure 47: Middle East & Africa Fructosamine Reagents Revenue (undefined), by Country 2025 & 2033
- Figure 48: Middle East & Africa Fructosamine Reagents Volume (K), by Country 2025 & 2033
- Figure 49: Middle East & Africa Fructosamine Reagents Revenue Share (%), by Country 2025 & 2033
- Figure 50: Middle East & Africa Fructosamine Reagents Volume Share (%), by Country 2025 & 2033
- Figure 51: Asia Pacific Fructosamine Reagents Revenue (undefined), by Application 2025 & 2033
- Figure 52: Asia Pacific Fructosamine Reagents Volume (K), by Application 2025 & 2033
- Figure 53: Asia Pacific Fructosamine Reagents Revenue Share (%), by Application 2025 & 2033
- Figure 54: Asia Pacific Fructosamine Reagents Volume Share (%), by Application 2025 & 2033
- Figure 55: Asia Pacific Fructosamine Reagents Revenue (undefined), by Types 2025 & 2033
- Figure 56: Asia Pacific Fructosamine Reagents Volume (K), by Types 2025 & 2033
- Figure 57: Asia Pacific Fructosamine Reagents Revenue Share (%), by Types 2025 & 2033
- Figure 58: Asia Pacific Fructosamine Reagents Volume Share (%), by Types 2025 & 2033
- Figure 59: Asia Pacific Fructosamine Reagents Revenue (undefined), by Country 2025 & 2033
- Figure 60: Asia Pacific Fructosamine Reagents Volume (K), by Country 2025 & 2033
- Figure 61: Asia Pacific Fructosamine Reagents Revenue Share (%), by Country 2025 & 2033
- Figure 62: Asia Pacific Fructosamine Reagents Volume Share (%), by Country 2025 & 2033
List of Tables
- Table 1: Global Fructosamine Reagents Revenue undefined Forecast, by Application 2020 & 2033
- Table 2: Global Fructosamine Reagents Volume K Forecast, by Application 2020 & 2033
- Table 3: Global Fructosamine Reagents Revenue undefined Forecast, by Types 2020 & 2033
- Table 4: Global Fructosamine Reagents Volume K Forecast, by Types 2020 & 2033
- Table 5: Global Fructosamine Reagents Revenue undefined Forecast, by Region 2020 & 2033
- Table 6: Global Fructosamine Reagents Volume K Forecast, by Region 2020 & 2033
- Table 7: Global Fructosamine Reagents Revenue undefined Forecast, by Application 2020 & 2033
- Table 8: Global Fructosamine Reagents Volume K Forecast, by Application 2020 & 2033
- Table 9: Global Fructosamine Reagents Revenue undefined Forecast, by Types 2020 & 2033
- Table 10: Global Fructosamine Reagents Volume K Forecast, by Types 2020 & 2033
- Table 11: Global Fructosamine Reagents Revenue undefined Forecast, by Country 2020 & 2033
- Table 12: Global Fructosamine Reagents Volume K Forecast, by Country 2020 & 2033
- Table 13: United States Fructosamine Reagents Revenue (undefined) Forecast, by Application 2020 & 2033
- Table 14: United States Fructosamine Reagents Volume (K) Forecast, by Application 2020 & 2033
- Table 15: Canada Fructosamine Reagents Revenue (undefined) Forecast, by Application 2020 & 2033
- Table 16: Canada Fructosamine Reagents Volume (K) Forecast, by Application 2020 & 2033
- Table 17: Mexico Fructosamine Reagents Revenue (undefined) Forecast, by Application 2020 & 2033
- Table 18: Mexico Fructosamine Reagents Volume (K) Forecast, by Application 2020 & 2033
- Table 19: Global Fructosamine Reagents Revenue undefined Forecast, by Application 2020 & 2033
- Table 20: Global Fructosamine Reagents Volume K Forecast, by Application 2020 & 2033
- Table 21: Global Fructosamine Reagents Revenue undefined Forecast, by Types 2020 & 2033
- Table 22: Global Fructosamine Reagents Volume K Forecast, by Types 2020 & 2033
- Table 23: Global Fructosamine Reagents Revenue undefined Forecast, by Country 2020 & 2033
- Table 24: Global Fructosamine Reagents Volume K Forecast, by Country 2020 & 2033
- Table 25: Brazil Fructosamine Reagents Revenue (undefined) Forecast, by Application 2020 & 2033
- Table 26: Brazil Fructosamine Reagents Volume (K) Forecast, by Application 2020 & 2033
- Table 27: Argentina Fructosamine Reagents Revenue (undefined) Forecast, by Application 2020 & 2033
- Table 28: Argentina Fructosamine Reagents Volume (K) Forecast, by Application 2020 & 2033
- Table 29: Rest of South America Fructosamine Reagents Revenue (undefined) Forecast, by Application 2020 & 2033
- Table 30: Rest of South America Fructosamine Reagents Volume (K) Forecast, by Application 2020 & 2033
- Table 31: Global Fructosamine Reagents Revenue undefined Forecast, by Application 2020 & 2033
- Table 32: Global Fructosamine Reagents Volume K Forecast, by Application 2020 & 2033
- Table 33: Global Fructosamine Reagents Revenue undefined Forecast, by Types 2020 & 2033
- Table 34: Global Fructosamine Reagents Volume K Forecast, by Types 2020 & 2033
- Table 35: Global Fructosamine Reagents Revenue undefined Forecast, by Country 2020 & 2033
- Table 36: Global Fructosamine Reagents Volume K Forecast, by Country 2020 & 2033
- Table 37: United Kingdom Fructosamine Reagents Revenue (undefined) Forecast, by Application 2020 & 2033
- Table 38: United Kingdom Fructosamine Reagents Volume (K) Forecast, by Application 2020 & 2033
- Table 39: Germany Fructosamine Reagents Revenue (undefined) Forecast, by Application 2020 & 2033
- Table 40: Germany Fructosamine Reagents Volume (K) Forecast, by Application 2020 & 2033
- Table 41: France Fructosamine Reagents Revenue (undefined) Forecast, by Application 2020 & 2033
- Table 42: France Fructosamine Reagents Volume (K) Forecast, by Application 2020 & 2033
- Table 43: Italy Fructosamine Reagents Revenue (undefined) Forecast, by Application 2020 & 2033
- Table 44: Italy Fructosamine Reagents Volume (K) Forecast, by Application 2020 & 2033
- Table 45: Spain Fructosamine Reagents Revenue (undefined) Forecast, by Application 2020 & 2033
- Table 46: Spain Fructosamine Reagents Volume (K) Forecast, by Application 2020 & 2033
- Table 47: Russia Fructosamine Reagents Revenue (undefined) Forecast, by Application 2020 & 2033
- Table 48: Russia Fructosamine Reagents Volume (K) Forecast, by Application 2020 & 2033
- Table 49: Benelux Fructosamine Reagents Revenue (undefined) Forecast, by Application 2020 & 2033
- Table 50: Benelux Fructosamine Reagents Volume (K) Forecast, by Application 2020 & 2033
- Table 51: Nordics Fructosamine Reagents Revenue (undefined) Forecast, by Application 2020 & 2033
- Table 52: Nordics Fructosamine Reagents Volume (K) Forecast, by Application 2020 & 2033
- Table 53: Rest of Europe Fructosamine Reagents Revenue (undefined) Forecast, by Application 2020 & 2033
- Table 54: Rest of Europe Fructosamine Reagents Volume (K) Forecast, by Application 2020 & 2033
- Table 55: Global Fructosamine Reagents Revenue undefined Forecast, by Application 2020 & 2033
- Table 56: Global Fructosamine Reagents Volume K Forecast, by Application 2020 & 2033
- Table 57: Global Fructosamine Reagents Revenue undefined Forecast, by Types 2020 & 2033
- Table 58: Global Fructosamine Reagents Volume K Forecast, by Types 2020 & 2033
- Table 59: Global Fructosamine Reagents Revenue undefined Forecast, by Country 2020 & 2033
- Table 60: Global Fructosamine Reagents Volume K Forecast, by Country 2020 & 2033
- Table 61: Turkey Fructosamine Reagents Revenue (undefined) Forecast, by Application 2020 & 2033
- Table 62: Turkey Fructosamine Reagents Volume (K) Forecast, by Application 2020 & 2033
- Table 63: Israel Fructosamine Reagents Revenue (undefined) Forecast, by Application 2020 & 2033
- Table 64: Israel Fructosamine Reagents Volume (K) Forecast, by Application 2020 & 2033
- Table 65: GCC Fructosamine Reagents Revenue (undefined) Forecast, by Application 2020 & 2033
- Table 66: GCC Fructosamine Reagents Volume (K) Forecast, by Application 2020 & 2033
- Table 67: North Africa Fructosamine Reagents Revenue (undefined) Forecast, by Application 2020 & 2033
- Table 68: North Africa Fructosamine Reagents Volume (K) Forecast, by Application 2020 & 2033
- Table 69: South Africa Fructosamine Reagents Revenue (undefined) Forecast, by Application 2020 & 2033
- Table 70: South Africa Fructosamine Reagents Volume (K) Forecast, by Application 2020 & 2033
- Table 71: Rest of Middle East & Africa Fructosamine Reagents Revenue (undefined) Forecast, by Application 2020 & 2033
- Table 72: Rest of Middle East & Africa Fructosamine Reagents Volume (K) Forecast, by Application 2020 & 2033
- Table 73: Global Fructosamine Reagents Revenue undefined Forecast, by Application 2020 & 2033
- Table 74: Global Fructosamine Reagents Volume K Forecast, by Application 2020 & 2033
- Table 75: Global Fructosamine Reagents Revenue undefined Forecast, by Types 2020 & 2033
- Table 76: Global Fructosamine Reagents Volume K Forecast, by Types 2020 & 2033
- Table 77: Global Fructosamine Reagents Revenue undefined Forecast, by Country 2020 & 2033
- Table 78: Global Fructosamine Reagents Volume K Forecast, by Country 2020 & 2033
- Table 79: China Fructosamine Reagents Revenue (undefined) Forecast, by Application 2020 & 2033
- Table 80: China Fructosamine Reagents Volume (K) Forecast, by Application 2020 & 2033
- Table 81: India Fructosamine Reagents Revenue (undefined) Forecast, by Application 2020 & 2033
- Table 82: India Fructosamine Reagents Volume (K) Forecast, by Application 2020 & 2033
- Table 83: Japan Fructosamine Reagents Revenue (undefined) Forecast, by Application 2020 & 2033
- Table 84: Japan Fructosamine Reagents Volume (K) Forecast, by Application 2020 & 2033
- Table 85: South Korea Fructosamine Reagents Revenue (undefined) Forecast, by Application 2020 & 2033
- Table 86: South Korea Fructosamine Reagents Volume (K) Forecast, by Application 2020 & 2033
- Table 87: ASEAN Fructosamine Reagents Revenue (undefined) Forecast, by Application 2020 & 2033
- Table 88: ASEAN Fructosamine Reagents Volume (K) Forecast, by Application 2020 & 2033
- Table 89: Oceania Fructosamine Reagents Revenue (undefined) Forecast, by Application 2020 & 2033
- Table 90: Oceania Fructosamine Reagents Volume (K) Forecast, by Application 2020 & 2033
- Table 91: Rest of Asia Pacific Fructosamine Reagents Revenue (undefined) Forecast, by Application 2020 & 2033
- Table 92: Rest of Asia Pacific Fructosamine Reagents Volume (K) Forecast, by Application 2020 & 2033
Frequently Asked Questions
1. What is the projected Compound Annual Growth Rate (CAGR) of the Fructosamine Reagents?
The projected CAGR is approximately 7.2%.
2. Which companies are prominent players in the Fructosamine Reagents?
Key companies in the market include Biosystems S.A., Randox Laboratories Ltd., Sekisui Diagnostics, Kamiya Biomedical Co., Sentinel Diagnostics, Asahi Kasei Pharma Corporation.
3. What are the main segments of the Fructosamine Reagents?
The market segments include Application, Types.
4. Can you provide details about the market size?
The market size is estimated to be USD XXX N/A as of 2022.
5. What are some drivers contributing to market growth?
N/A
6. What are the notable trends driving market growth?
N/A
7. Are there any restraints impacting market growth?
N/A
8. Can you provide examples of recent developments in the market?
N/A
9. What pricing options are available for accessing the report?
Pricing options include single-user, multi-user, and enterprise licenses priced at USD 3350.00, USD 5025.00, and USD 6700.00 respectively.
10. Is the market size provided in terms of value or volume?
The market size is provided in terms of value, measured in N/A and volume, measured in K.
11. Are there any specific market keywords associated with the report?
Yes, the market keyword associated with the report is "Fructosamine Reagents," which aids in identifying and referencing the specific market segment covered.
12. How do I determine which pricing option suits my needs best?
The pricing options vary based on user requirements and access needs. Individual users may opt for single-user licenses, while businesses requiring broader access may choose multi-user or enterprise licenses for cost-effective access to the report.
13. Are there any additional resources or data provided in the Fructosamine Reagents report?
While the report offers comprehensive insights, it's advisable to review the specific contents or supplementary materials provided to ascertain if additional resources or data are available.
14. How can I stay updated on further developments or reports in the Fructosamine Reagents?
To stay informed about further developments, trends, and reports in the Fructosamine Reagents, consider subscribing to industry newsletters, following relevant companies and organizations, or regularly checking reputable industry news sources and publications.
Methodology
Step 1 - Identification of Relevant Samples Size from Population Database


Step 2 - Approaches for Defining Global Market Size (Value, Volume* & Price*)

Note*: In applicable scenarios
Step 3 - Data Sources
Primary Research
- Web Analytics
- Survey Reports
- Research Institute
- Latest Research Reports
- Opinion Leaders
Secondary Research
- Annual Reports
- White Paper
- Latest Press Release
- Industry Association
- Paid Database
- Investor Presentations

Step 4 - Data Triangulation
Involves using different sources of information in order to increase the validity of a study
These sources are likely to be stakeholders in a program - participants, other researchers, program staff, other community members, and so on.
Then we put all data in single framework & apply various statistical tools to find out the dynamic on the market.
During the analysis stage, feedback from the stakeholder groups would be compared to determine areas of agreement as well as areas of divergence

