

Key Insights
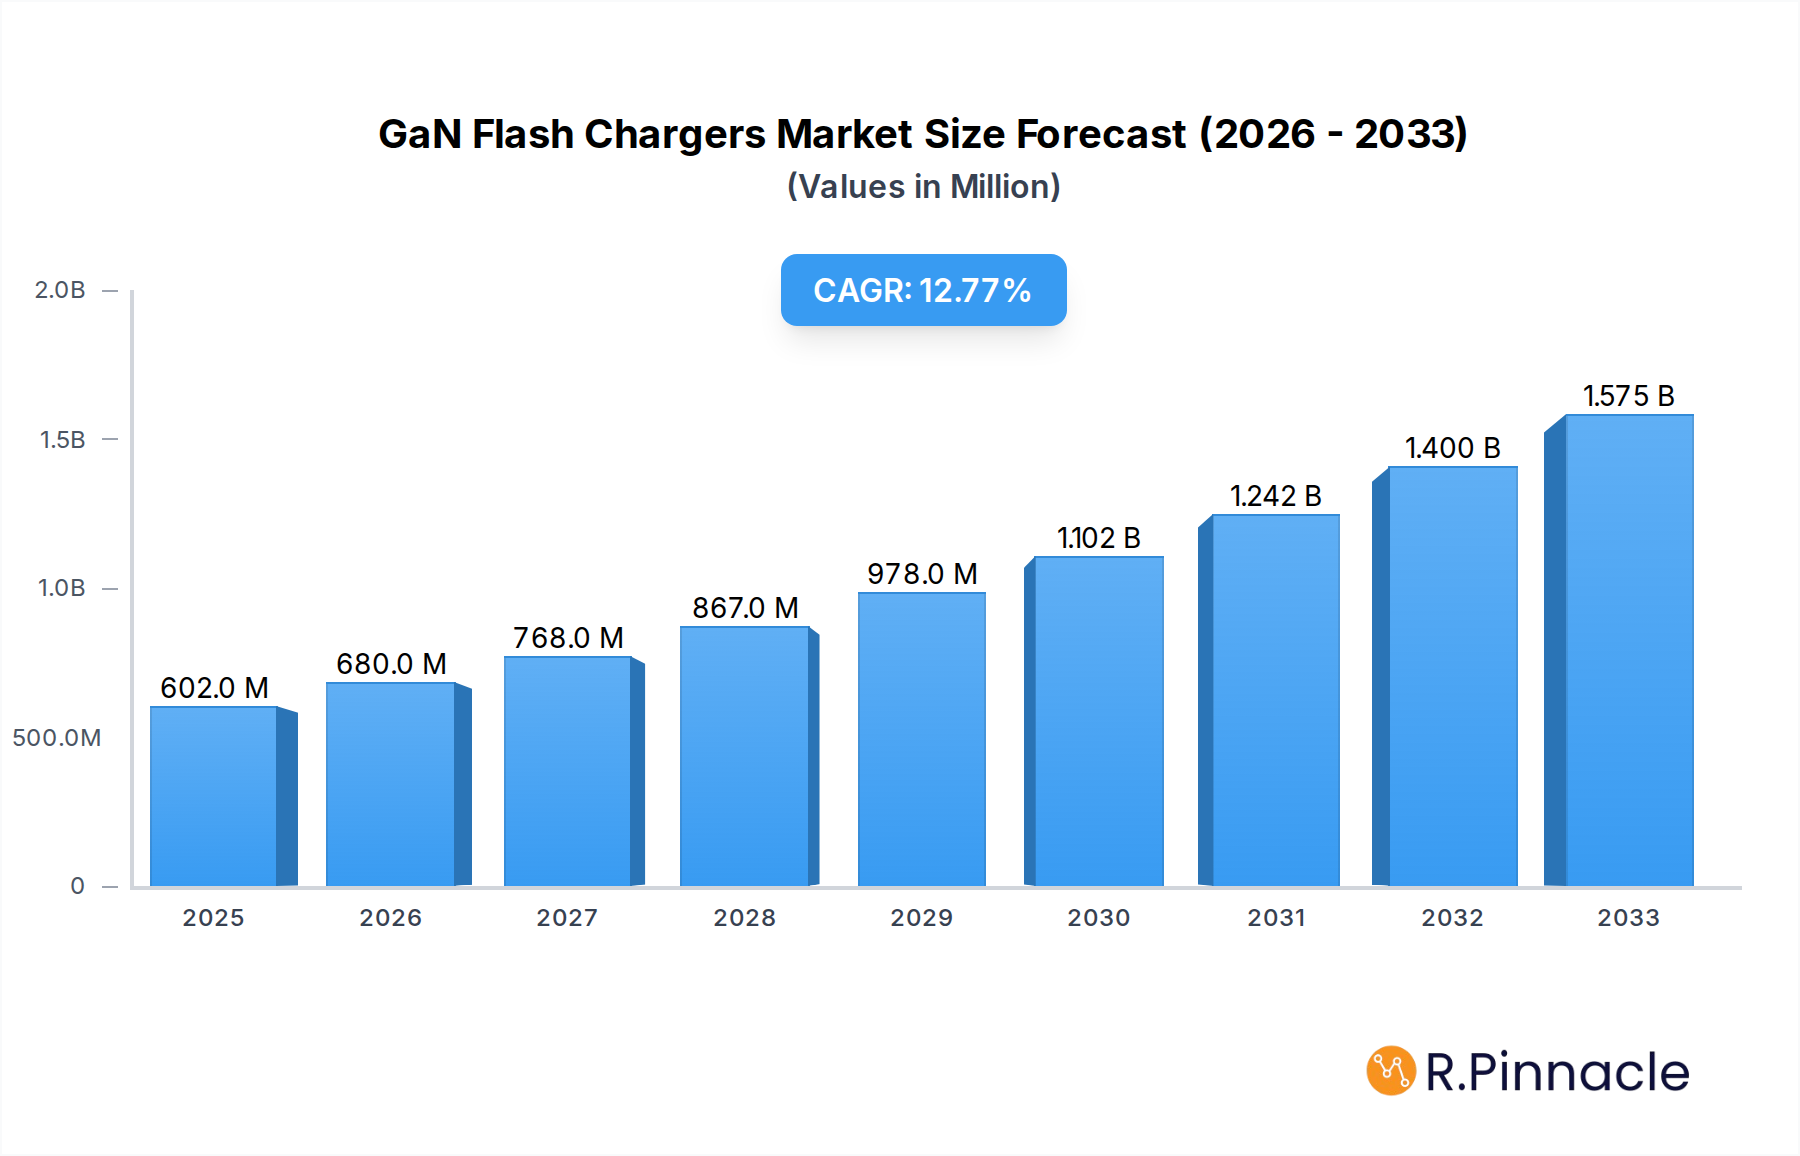
The GaN Flash Chargers market is poised for significant expansion, projected to reach USD 602 million by 2025, driven by an impressive CAGR of 12.7% through 2033. This robust growth is primarily fueled by the escalating demand for smaller, more efficient, and higher-power charging solutions across a wide spectrum of electronic devices. The burgeoning electric vehicle (EV) sector, with its increasing adoption rates and the need for rapid charging infrastructure, represents a pivotal driver. Similarly, the proliferation of IoT devices and the ever-growing wearable technology market, both requiring compact and fast charging capabilities, contribute substantially to market expansion. The inherent advantages of Gallium Nitride (GaN) technology—superior power efficiency, reduced heat generation, and miniaturization—make GaN flash chargers the preferred choice for both consumers and manufacturers seeking to optimize device performance and user experience. The market is witnessing a strong trend towards higher wattage chargers, with 65W and 100W variants gaining substantial traction as consumers seek to power multiple devices simultaneously and reduce charging times dramatically.

GaN Flash Chargers Market Size (In Million)
While the market experiences strong tailwinds, certain factors could influence its trajectory. The initial higher cost of GaN components compared to traditional silicon-based chargers, though decreasing, remains a potential restraint, particularly in price-sensitive markets. However, the long-term benefits of efficiency and longevity are increasingly outweighing this upfront cost. Fierce competition among established tech giants and emerging players, including Anker Innovations, Samsung, Apple, and Xiaomi, is spurring innovation and driving down prices, further accelerating market penetration. Geographically, Asia Pacific is anticipated to lead the market due to its massive manufacturing base and rapid adoption of new technologies, followed by North America and Europe, where the demand for premium and high-performance charging solutions is high. The continuous evolution of charging standards and the increasing power requirements of next-generation devices will ensure sustained innovation and market opportunities for GaN flash chargers in the coming years.
GaN Flash Chargers Company Market Share
This in-depth report offers a panoramic view of the burgeoning GaN (Gallium Nitride) flash chargers market, providing critical insights for industry professionals, investors, and technology strategists. Analyzing market dynamics from 2019 to 2033, with a focus on the base year 2025 and the forecast period 2025–2033, this report delves into the technological advancements, market segmentation, competitive landscape, and future growth trajectory of GaN flash chargers. With an estimated market size projected to reach XXX million by 2025, this research is essential for understanding the transformative impact of GaN technology on power delivery solutions.
GaN Flash Chargers Market Structure & Innovation Trends
The GaN flash chargers market exhibits a moderately fragmented structure, with a significant number of established players and emerging innovators vying for market share. Innovation is predominantly driven by the inherent advantages of GaN semiconductors – smaller size, higher efficiency, and faster charging capabilities compared to traditional silicon-based chargers. Key innovation trends include miniaturization, multi-port functionality, enhanced safety features like overvoltage protection, and the integration of GaN technology into a wider array of electronic devices. Regulatory frameworks are evolving to support the adoption of efficient power solutions, with a growing emphasis on energy conservation. Product substitutes, while present in the form of traditional chargers, are increasingly being displaced by the superior performance of GaN technology, particularly in high-power applications. End-user demographics are expanding rapidly, encompassing consumers seeking faster charging for smartphones and laptops, as well as the rapidly growing electric vehicle and IoT device sectors. Merger and acquisition (M&A) activities are anticipated to increase as larger companies seek to acquire GaN expertise and expand their product portfolios, with an estimated XXX million in M&A deal values anticipated within the forecast period.
- Market Concentration: Moderately fragmented with increasing consolidation trends.
- Innovation Drivers: GaN's inherent efficiency, miniaturization, and speed.
- Regulatory Frameworks: Supportive policies for energy efficiency and fast charging standards.
- Product Substitutes: Traditional silicon chargers, though losing ground.
- End-User Demographics: Consumers, EV manufacturers, IoT device makers, and wearable technology producers.
- M&A Activities: Expected to rise for technological acquisition and market expansion.
GaN Flash Chargers Market Dynamics & Trends
The GaN flash chargers market is experiencing robust growth, fueled by a confluence of powerful market dynamics and pervasive technological trends. The CAGR for the market is projected to be a substantial XX% from 2025 to 2033, underscoring its significant expansion potential. A primary growth driver is the insatiable consumer demand for faster charging speeds across a spectrum of electronic devices, from smartphones and laptops to tablets and gaming consoles. This demand is amplified by the increasing proliferation of high-performance mobile devices that necessitate rapid power replenishment. Technological disruptions are at the heart of this market's evolution. The adoption of Gallium Nitride (GaN) semiconductors, a superior alternative to silicon, is enabling the creation of chargers that are not only smaller and lighter but also significantly more energy-efficient and capable of delivering higher power outputs. This efficiency translates into reduced energy waste, a critical factor in today's environmentally conscious world. Consumer preferences are rapidly shifting towards convenience and portability. The compact form factor of GaN chargers makes them ideal for travel and daily use, eliminating the need for bulky power bricks. Furthermore, the trend towards multi-device charging solutions, where a single GaN charger can power multiple gadgets simultaneously, is gaining traction, further enhancing user convenience. The competitive dynamics within the GaN flash chargers sector are intensifying. Leading companies are engaged in a race to innovate, launching new products with advanced features and competitive pricing strategies. Market penetration is steadily increasing as GaN technology becomes more accessible and its benefits are more widely recognized by both consumers and manufacturers. The integration of GaN into electric vehicles (EVs) is also emerging as a significant trend, promising faster and more efficient charging solutions for the growing EV market.
Dominant Regions & Segments in GaN Flash Chargers
The GaN flash chargers market exhibits distinct regional dominance and segment leadership, driven by a combination of economic policies, infrastructure development, and consumer adoption patterns.
Leading Region: Asia Pacific
The Asia Pacific region stands as the dominant force in the GaN flash chargers market, primarily propelled by its status as a global manufacturing hub for consumer electronics and a rapidly expanding consumer base with a high propensity for adopting new technologies. Countries like China, South Korea, and Japan are at the forefront of both production and consumption.
- Economic Policies: Supportive government initiatives promoting technological innovation and manufacturing excellence in the electronics sector.
- Infrastructure Development: Widespread availability of advanced manufacturing facilities and a robust supply chain for semiconductor components.
- Consumer Adoption: A large and tech-savvy population eager to embrace faster charging solutions for their increasingly sophisticated mobile devices.
Dominant Application Segment: IoT Devices
The IoT Devices segment is projected to witness remarkable growth and emerge as a dominant application area for GaN flash chargers. The exponential increase in the number of connected devices, ranging from smart home appliances and industrial sensors to medical devices and advanced wearables, necessitates compact, efficient, and high-performance charging solutions.
- Miniaturization & Efficiency: GaN chargers’ small footprint and high efficiency are crucial for integrating into space-constrained IoT devices, ensuring minimal power loss during charging.
- Proliferation of Connected Devices: The sheer volume of IoT devices being deployed across various sectors creates substantial demand for reliable and fast charging.
- Demand for Portability: Many IoT applications require portable power, making lightweight and efficient GaN chargers an ideal solution.
Dominant Type Segment: 65W and 100W Chargers
Within the GaN flash chargers market, the 65W and 100W segments are poised for significant dominance. These power ratings cater to the increasing energy demands of a wide array of high-performance devices, including gaming laptops, ultrabooks, and more demanding consumer electronics, as well as emerging applications in electric vehicles.
- High-Performance Device Demand: Modern laptops and other power-hungry gadgets require higher wattage for optimal charging speeds, making 65W and 100W chargers essential.
- Versatility: These power levels offer a balance of speed and compatibility, serving a broad spectrum of devices.
- Future-Proofing: As device power requirements continue to rise, these higher wattage chargers are well-positioned for future growth.
GaN Flash Chargers Product Innovations
Product innovation in GaN flash chargers centers on maximizing the inherent benefits of Gallium Nitride technology. This includes the development of ultra-compact chargers that fit easily into pockets or small bags, enabling unparalleled portability. Innovations also focus on delivering multi-device charging capabilities from a single adapter, often with intelligent power distribution to optimize charging speeds for each connected device. Enhanced safety features, such as advanced thermal management and protection against overcurrent and overvoltage, are paramount. Competitive advantages are derived from superior charging speed, reduced heat generation, and a significantly smaller form factor compared to conventional silicon chargers, making them the preferred choice for power-hungry and portable electronics.
Report Scope & Segmentation Analysis
This comprehensive report segments the GaN flash chargers market by Application and Type. The Application segmentation includes Electric Vehicles, IoT Devices, Wearable Devices, and Others. The Type segmentation covers 30W, 65W, 100W, and Others. Each segment is analyzed in detail, with growth projections and market size estimations provided for the study period. The competitive dynamics within each segment are also scrutinized, identifying key players and their strategies for market penetration and expansion.
- Application Segments: Analysis of market size, growth rates, and competitive landscapes for Electric Vehicles, IoT Devices, Wearable Devices, and Others.
- Type Segments: Detailed breakdown of market share and growth forecasts for 30W, 65W, 100W, and Other power output categories.
Key Drivers of GaN Flash Chargers Growth
The growth of the GaN flash chargers market is propelled by several intertwined factors. Technologically, the superior efficiency and miniaturization capabilities of Gallium Nitride semiconductors are revolutionizing power delivery. Economically, increasing disposable incomes and the growing demand for premium electronic devices, particularly smartphones and laptops, are driving adoption. Regulatory factors, such as government mandates for energy efficiency and the phasing out of less efficient charging technologies, also play a crucial role in accelerating market penetration. Furthermore, the burgeoning electric vehicle sector presents a significant opportunity for high-power GaN charging solutions.
Challenges in the GaN Flash Chargers Sector
Despite its promising growth, the GaN flash chargers sector faces several challenges. Regulatory hurdles, though generally supportive, can sometimes lead to slower adoption rates due to complex certification processes for new materials and designs. Supply chain issues, particularly concerning the availability and cost of specialized GaN wafers and manufacturing equipment, can impact production volumes and pricing. Competitive pressures from established silicon-based charger manufacturers, who may engage in price wars, also pose a restraint. Additionally, consumer education remains a factor, with some users still unaware of the distinct advantages of GaN technology over traditional chargers, leading to a perceived higher cost barrier.
Emerging Opportunities in GaN Flash Chargers
Emerging opportunities in the GaN flash chargers market are abundant and diverse. The rapid expansion of the electric vehicle market presents a substantial avenue for high-power GaN charging solutions, including home charging stations and public charging infrastructure. The increasing adoption of IoT devices across industries like healthcare, manufacturing, and smart cities necessitates compact and efficient charging, creating a large untapped market. Furthermore, the demand for advanced charging solutions for high-performance laptops, gaming consoles, and professional-grade portable electronics continues to grow. The development of GaN technology for wireless charging applications also holds significant potential for future market expansion.
Leading Players in the GaN Flash Chargers Market
- Ravpower (Sunvalley)
- Belkin International
- Aukey
- Samsung
- Apple
- Zendure
- Hyper
- Baseus
- Anker Innovations Technology
- Ugreen Group
- Xiaomi
- HUAWEI
- Nubia Technology
- Shenzhen Remax Technology
- PISEN
- MOMAX
- Sunwoda Electronic
- Anfu CE LINK
- Lenovo
- ZTE
- OPPO
- realme
Key Developments in GaN Flash Chargers Industry
- 2023/01: Launch of GaN chargers with integrated smart features for optimized power delivery and device health monitoring.
- 2022/07: Significant advancements in GaN wafer manufacturing leading to reduced production costs.
- 2022/03: Increased adoption of 100W GaN chargers for gaming laptops and professional workstations.
- 2021/11: Introduction of multi-port GaN chargers capable of simultaneously powering laptops, tablets, and smartphones.
- 2021/05: Growing trend of GaN technology integration in power banks for faster portable charging.
- 2020/09: Emergence of GaN chargers with ultra-compact designs, revolutionizing portability.
- 2019/XX: Initial market penetration of GaN technology in consumer-grade chargers, signaling the start of a new era in power delivery.
Future Outlook for GaN Flash Chargers Market
The future outlook for the GaN flash chargers market is exceptionally bright, characterized by sustained growth and transformative potential. The continued advancement in GaN semiconductor technology will lead to even smaller, more efficient, and more powerful charging solutions. The expanding adoption in the electric vehicle sector, coupled with the relentless growth of IoT devices and the demand for high-performance consumer electronics, will serve as major growth accelerators. Strategic opportunities lie in further innovation in wireless charging integration, development of GaN solutions for industrial power applications, and exploring next-generation charging protocols. The market is poised to witness further consolidation through strategic partnerships and acquisitions, as key players aim to solidify their market positions and leverage the full potential of GaN technology.
GaN Flash Chargers Segmentation
-
1. Application
- 1.1. Electric Vehicles
- 1.2. IoT Devices
- 1.3. Wearable Devices
- 1.4. Others
-
2. Types
- 2.1. 30W
- 2.2. 65W
- 2.3. 100W
- 2.4. Others
GaN Flash Chargers Segmentation By Geography
-
1. North America
- 1.1. United States
- 1.2. Canada
- 1.3. Mexico
-
2. South America
- 2.1. Brazil
- 2.2. Argentina
- 2.3. Rest of South America
-
3. Europe
- 3.1. United Kingdom
- 3.2. Germany
- 3.3. France
- 3.4. Italy
- 3.5. Spain
- 3.6. Russia
- 3.7. Benelux
- 3.8. Nordics
- 3.9. Rest of Europe
-
4. Middle East & Africa
- 4.1. Turkey
- 4.2. Israel
- 4.3. GCC
- 4.4. North Africa
- 4.5. South Africa
- 4.6. Rest of Middle East & Africa
-
5. Asia Pacific
- 5.1. China
- 5.2. India
- 5.3. Japan
- 5.4. South Korea
- 5.5. ASEAN
- 5.6. Oceania
- 5.7. Rest of Asia Pacific
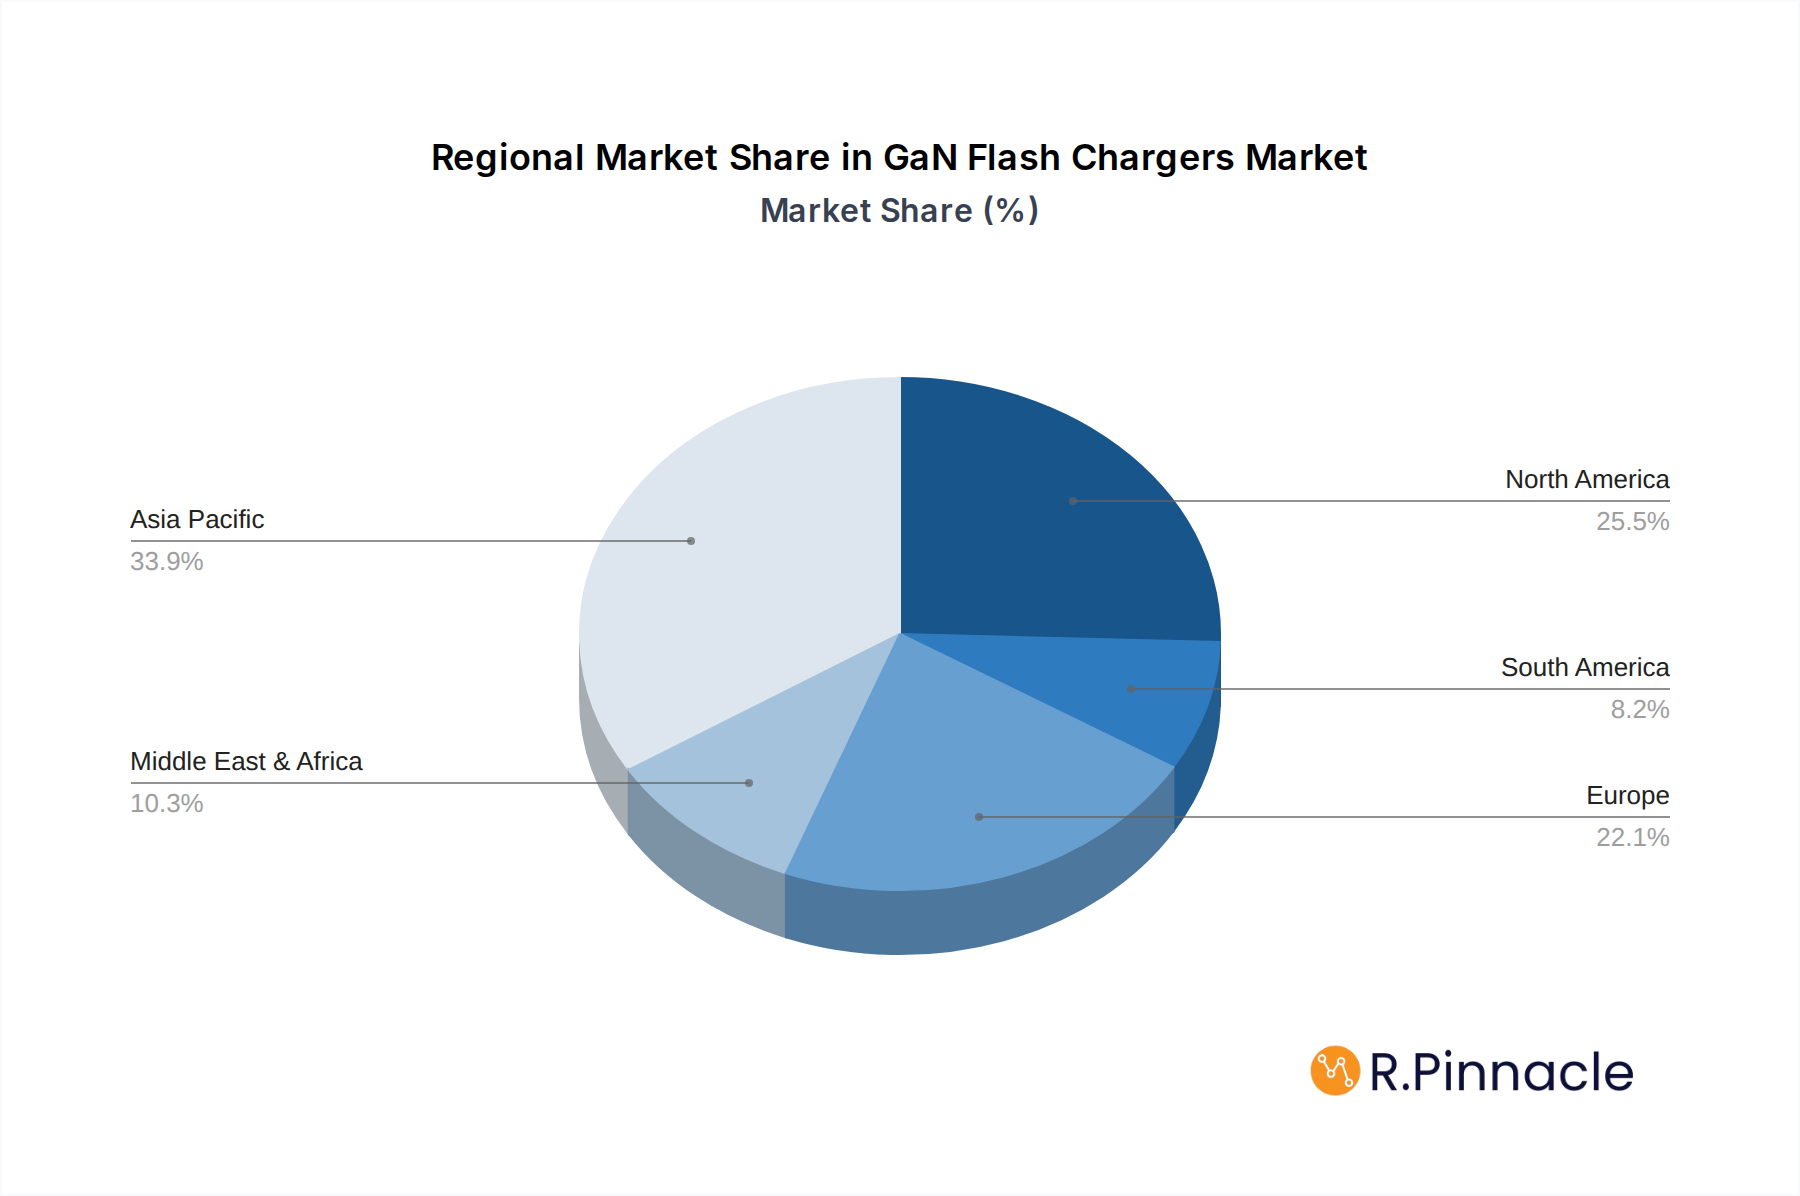
GaN Flash Chargers Regional Market Share
Geographic Coverage of GaN Flash Chargers
GaN Flash Chargers REPORT HIGHLIGHTS
| Aspects | Details |
|---|---|
| Study Period | 2020-2034 |
| Base Year | 2025 |
| Estimated Year | 2026 |
| Forecast Period | 2026-2034 |
| Historical Period | 2020-2025 |
| Growth Rate | CAGR of 12.7% from 2020-2034 |
| Segmentation |
|
Table of Contents
- 1. Introduction
- 1.1. Research Scope
- 1.2. Market Segmentation
- 1.3. Research Methodology
- 1.4. Definitions and Assumptions
- 2. Executive Summary
- 2.1. Introduction
- 3. Market Dynamics
- 3.1. Introduction
- 3.2. Market Drivers
- 3.3. Market Restrains
- 3.4. Market Trends
- 4. Market Factor Analysis
- 4.1. Porters Five Forces
- 4.2. Supply/Value Chain
- 4.3. PESTEL analysis
- 4.4. Market Entropy
- 4.5. Patent/Trademark Analysis
- 5. Global GaN Flash Chargers Analysis, Insights and Forecast, 2020-2032
- 5.1. Market Analysis, Insights and Forecast - by Application
- 5.1.1. Electric Vehicles
- 5.1.2. IoT Devices
- 5.1.3. Wearable Devices
- 5.1.4. Others
- 5.2. Market Analysis, Insights and Forecast - by Types
- 5.2.1. 30W
- 5.2.2. 65W
- 5.2.3. 100W
- 5.2.4. Others
- 5.3. Market Analysis, Insights and Forecast - by Region
- 5.3.1. North America
- 5.3.2. South America
- 5.3.3. Europe
- 5.3.4. Middle East & Africa
- 5.3.5. Asia Pacific
- 5.1. Market Analysis, Insights and Forecast - by Application
- 6. North America GaN Flash Chargers Analysis, Insights and Forecast, 2020-2032
- 6.1. Market Analysis, Insights and Forecast - by Application
- 6.1.1. Electric Vehicles
- 6.1.2. IoT Devices
- 6.1.3. Wearable Devices
- 6.1.4. Others
- 6.2. Market Analysis, Insights and Forecast - by Types
- 6.2.1. 30W
- 6.2.2. 65W
- 6.2.3. 100W
- 6.2.4. Others
- 6.1. Market Analysis, Insights and Forecast - by Application
- 7. South America GaN Flash Chargers Analysis, Insights and Forecast, 2020-2032
- 7.1. Market Analysis, Insights and Forecast - by Application
- 7.1.1. Electric Vehicles
- 7.1.2. IoT Devices
- 7.1.3. Wearable Devices
- 7.1.4. Others
- 7.2. Market Analysis, Insights and Forecast - by Types
- 7.2.1. 30W
- 7.2.2. 65W
- 7.2.3. 100W
- 7.2.4. Others
- 7.1. Market Analysis, Insights and Forecast - by Application
- 8. Europe GaN Flash Chargers Analysis, Insights and Forecast, 2020-2032
- 8.1. Market Analysis, Insights and Forecast - by Application
- 8.1.1. Electric Vehicles
- 8.1.2. IoT Devices
- 8.1.3. Wearable Devices
- 8.1.4. Others
- 8.2. Market Analysis, Insights and Forecast - by Types
- 8.2.1. 30W
- 8.2.2. 65W
- 8.2.3. 100W
- 8.2.4. Others
- 8.1. Market Analysis, Insights and Forecast - by Application
- 9. Middle East & Africa GaN Flash Chargers Analysis, Insights and Forecast, 2020-2032
- 9.1. Market Analysis, Insights and Forecast - by Application
- 9.1.1. Electric Vehicles
- 9.1.2. IoT Devices
- 9.1.3. Wearable Devices
- 9.1.4. Others
- 9.2. Market Analysis, Insights and Forecast - by Types
- 9.2.1. 30W
- 9.2.2. 65W
- 9.2.3. 100W
- 9.2.4. Others
- 9.1. Market Analysis, Insights and Forecast - by Application
- 10. Asia Pacific GaN Flash Chargers Analysis, Insights and Forecast, 2020-2032
- 10.1. Market Analysis, Insights and Forecast - by Application
- 10.1.1. Electric Vehicles
- 10.1.2. IoT Devices
- 10.1.3. Wearable Devices
- 10.1.4. Others
- 10.2. Market Analysis, Insights and Forecast - by Types
- 10.2.1. 30W
- 10.2.2. 65W
- 10.2.3. 100W
- 10.2.4. Others
- 10.1. Market Analysis, Insights and Forecast - by Application
- 11. Competitive Analysis
- 11.1. Global Market Share Analysis 2025
- 11.2. Company Profiles
- 11.2.1 Ravpower (Sunvalley)
- 11.2.1.1. Overview
- 11.2.1.2. Products
- 11.2.1.3. SWOT Analysis
- 11.2.1.4. Recent Developments
- 11.2.1.5. Financials (Based on Availability)
- 11.2.2 Belkin International
- 11.2.2.1. Overview
- 11.2.2.2. Products
- 11.2.2.3. SWOT Analysis
- 11.2.2.4. Recent Developments
- 11.2.2.5. Financials (Based on Availability)
- 11.2.3 Aukey
- 11.2.3.1. Overview
- 11.2.3.2. Products
- 11.2.3.3. SWOT Analysis
- 11.2.3.4. Recent Developments
- 11.2.3.5. Financials (Based on Availability)
- 11.2.4 Samsung
- 11.2.4.1. Overview
- 11.2.4.2. Products
- 11.2.4.3. SWOT Analysis
- 11.2.4.4. Recent Developments
- 11.2.4.5. Financials (Based on Availability)
- 11.2.5 Apple
- 11.2.5.1. Overview
- 11.2.5.2. Products
- 11.2.5.3. SWOT Analysis
- 11.2.5.4. Recent Developments
- 11.2.5.5. Financials (Based on Availability)
- 11.2.6 Zendure
- 11.2.6.1. Overview
- 11.2.6.2. Products
- 11.2.6.3. SWOT Analysis
- 11.2.6.4. Recent Developments
- 11.2.6.5. Financials (Based on Availability)
- 11.2.7 Hyper
- 11.2.7.1. Overview
- 11.2.7.2. Products
- 11.2.7.3. SWOT Analysis
- 11.2.7.4. Recent Developments
- 11.2.7.5. Financials (Based on Availability)
- 11.2.8 Baseus
- 11.2.8.1. Overview
- 11.2.8.2. Products
- 11.2.8.3. SWOT Analysis
- 11.2.8.4. Recent Developments
- 11.2.8.5. Financials (Based on Availability)
- 11.2.9 Anker Innovations Technology
- 11.2.9.1. Overview
- 11.2.9.2. Products
- 11.2.9.3. SWOT Analysis
- 11.2.9.4. Recent Developments
- 11.2.9.5. Financials (Based on Availability)
- 11.2.10 Ugreen Group
- 11.2.10.1. Overview
- 11.2.10.2. Products
- 11.2.10.3. SWOT Analysis
- 11.2.10.4. Recent Developments
- 11.2.10.5. Financials (Based on Availability)
- 11.2.11 Xiaomi
- 11.2.11.1. Overview
- 11.2.11.2. Products
- 11.2.11.3. SWOT Analysis
- 11.2.11.4. Recent Developments
- 11.2.11.5. Financials (Based on Availability)
- 11.2.12 HUAWEI
- 11.2.12.1. Overview
- 11.2.12.2. Products
- 11.2.12.3. SWOT Analysis
- 11.2.12.4. Recent Developments
- 11.2.12.5. Financials (Based on Availability)
- 11.2.13 Nubia Technology
- 11.2.13.1. Overview
- 11.2.13.2. Products
- 11.2.13.3. SWOT Analysis
- 11.2.13.4. Recent Developments
- 11.2.13.5. Financials (Based on Availability)
- 11.2.14 Shenzhen Remax Technology
- 11.2.14.1. Overview
- 11.2.14.2. Products
- 11.2.14.3. SWOT Analysis
- 11.2.14.4. Recent Developments
- 11.2.14.5. Financials (Based on Availability)
- 11.2.15 PISEN
- 11.2.15.1. Overview
- 11.2.15.2. Products
- 11.2.15.3. SWOT Analysis
- 11.2.15.4. Recent Developments
- 11.2.15.5. Financials (Based on Availability)
- 11.2.16 MOMAX
- 11.2.16.1. Overview
- 11.2.16.2. Products
- 11.2.16.3. SWOT Analysis
- 11.2.16.4. Recent Developments
- 11.2.16.5. Financials (Based on Availability)
- 11.2.17 Sunwoda Electronic
- 11.2.17.1. Overview
- 11.2.17.2. Products
- 11.2.17.3. SWOT Analysis
- 11.2.17.4. Recent Developments
- 11.2.17.5. Financials (Based on Availability)
- 11.2.18 Anfu CE LINK
- 11.2.18.1. Overview
- 11.2.18.2. Products
- 11.2.18.3. SWOT Analysis
- 11.2.18.4. Recent Developments
- 11.2.18.5. Financials (Based on Availability)
- 11.2.19 Lenovo
- 11.2.19.1. Overview
- 11.2.19.2. Products
- 11.2.19.3. SWOT Analysis
- 11.2.19.4. Recent Developments
- 11.2.19.5. Financials (Based on Availability)
- 11.2.20 ZTE
- 11.2.20.1. Overview
- 11.2.20.2. Products
- 11.2.20.3. SWOT Analysis
- 11.2.20.4. Recent Developments
- 11.2.20.5. Financials (Based on Availability)
- 11.2.21 OPPO
- 11.2.21.1. Overview
- 11.2.21.2. Products
- 11.2.21.3. SWOT Analysis
- 11.2.21.4. Recent Developments
- 11.2.21.5. Financials (Based on Availability)
- 11.2.22 realme
- 11.2.22.1. Overview
- 11.2.22.2. Products
- 11.2.22.3. SWOT Analysis
- 11.2.22.4. Recent Developments
- 11.2.22.5. Financials (Based on Availability)
- 11.2.1 Ravpower (Sunvalley)
List of Figures
- Figure 1: Global GaN Flash Chargers Revenue Breakdown (million, %) by Region 2025 & 2033
- Figure 2: Global GaN Flash Chargers Volume Breakdown (K, %) by Region 2025 & 2033
- Figure 3: North America GaN Flash Chargers Revenue (million), by Application 2025 & 2033
- Figure 4: North America GaN Flash Chargers Volume (K), by Application 2025 & 2033
- Figure 5: North America GaN Flash Chargers Revenue Share (%), by Application 2025 & 2033
- Figure 6: North America GaN Flash Chargers Volume Share (%), by Application 2025 & 2033
- Figure 7: North America GaN Flash Chargers Revenue (million), by Types 2025 & 2033
- Figure 8: North America GaN Flash Chargers Volume (K), by Types 2025 & 2033
- Figure 9: North America GaN Flash Chargers Revenue Share (%), by Types 2025 & 2033
- Figure 10: North America GaN Flash Chargers Volume Share (%), by Types 2025 & 2033
- Figure 11: North America GaN Flash Chargers Revenue (million), by Country 2025 & 2033
- Figure 12: North America GaN Flash Chargers Volume (K), by Country 2025 & 2033
- Figure 13: North America GaN Flash Chargers Revenue Share (%), by Country 2025 & 2033
- Figure 14: North America GaN Flash Chargers Volume Share (%), by Country 2025 & 2033
- Figure 15: South America GaN Flash Chargers Revenue (million), by Application 2025 & 2033
- Figure 16: South America GaN Flash Chargers Volume (K), by Application 2025 & 2033
- Figure 17: South America GaN Flash Chargers Revenue Share (%), by Application 2025 & 2033
- Figure 18: South America GaN Flash Chargers Volume Share (%), by Application 2025 & 2033
- Figure 19: South America GaN Flash Chargers Revenue (million), by Types 2025 & 2033
- Figure 20: South America GaN Flash Chargers Volume (K), by Types 2025 & 2033
- Figure 21: South America GaN Flash Chargers Revenue Share (%), by Types 2025 & 2033
- Figure 22: South America GaN Flash Chargers Volume Share (%), by Types 2025 & 2033
- Figure 23: South America GaN Flash Chargers Revenue (million), by Country 2025 & 2033
- Figure 24: South America GaN Flash Chargers Volume (K), by Country 2025 & 2033
- Figure 25: South America GaN Flash Chargers Revenue Share (%), by Country 2025 & 2033
- Figure 26: South America GaN Flash Chargers Volume Share (%), by Country 2025 & 2033
- Figure 27: Europe GaN Flash Chargers Revenue (million), by Application 2025 & 2033
- Figure 28: Europe GaN Flash Chargers Volume (K), by Application 2025 & 2033
- Figure 29: Europe GaN Flash Chargers Revenue Share (%), by Application 2025 & 2033
- Figure 30: Europe GaN Flash Chargers Volume Share (%), by Application 2025 & 2033
- Figure 31: Europe GaN Flash Chargers Revenue (million), by Types 2025 & 2033
- Figure 32: Europe GaN Flash Chargers Volume (K), by Types 2025 & 2033
- Figure 33: Europe GaN Flash Chargers Revenue Share (%), by Types 2025 & 2033
- Figure 34: Europe GaN Flash Chargers Volume Share (%), by Types 2025 & 2033
- Figure 35: Europe GaN Flash Chargers Revenue (million), by Country 2025 & 2033
- Figure 36: Europe GaN Flash Chargers Volume (K), by Country 2025 & 2033
- Figure 37: Europe GaN Flash Chargers Revenue Share (%), by Country 2025 & 2033
- Figure 38: Europe GaN Flash Chargers Volume Share (%), by Country 2025 & 2033
- Figure 39: Middle East & Africa GaN Flash Chargers Revenue (million), by Application 2025 & 2033
- Figure 40: Middle East & Africa GaN Flash Chargers Volume (K), by Application 2025 & 2033
- Figure 41: Middle East & Africa GaN Flash Chargers Revenue Share (%), by Application 2025 & 2033
- Figure 42: Middle East & Africa GaN Flash Chargers Volume Share (%), by Application 2025 & 2033
- Figure 43: Middle East & Africa GaN Flash Chargers Revenue (million), by Types 2025 & 2033
- Figure 44: Middle East & Africa GaN Flash Chargers Volume (K), by Types 2025 & 2033
- Figure 45: Middle East & Africa GaN Flash Chargers Revenue Share (%), by Types 2025 & 2033
- Figure 46: Middle East & Africa GaN Flash Chargers Volume Share (%), by Types 2025 & 2033
- Figure 47: Middle East & Africa GaN Flash Chargers Revenue (million), by Country 2025 & 2033
- Figure 48: Middle East & Africa GaN Flash Chargers Volume (K), by Country 2025 & 2033
- Figure 49: Middle East & Africa GaN Flash Chargers Revenue Share (%), by Country 2025 & 2033
- Figure 50: Middle East & Africa GaN Flash Chargers Volume Share (%), by Country 2025 & 2033
- Figure 51: Asia Pacific GaN Flash Chargers Revenue (million), by Application 2025 & 2033
- Figure 52: Asia Pacific GaN Flash Chargers Volume (K), by Application 2025 & 2033
- Figure 53: Asia Pacific GaN Flash Chargers Revenue Share (%), by Application 2025 & 2033
- Figure 54: Asia Pacific GaN Flash Chargers Volume Share (%), by Application 2025 & 2033
- Figure 55: Asia Pacific GaN Flash Chargers Revenue (million), by Types 2025 & 2033
- Figure 56: Asia Pacific GaN Flash Chargers Volume (K), by Types 2025 & 2033
- Figure 57: Asia Pacific GaN Flash Chargers Revenue Share (%), by Types 2025 & 2033
- Figure 58: Asia Pacific GaN Flash Chargers Volume Share (%), by Types 2025 & 2033
- Figure 59: Asia Pacific GaN Flash Chargers Revenue (million), by Country 2025 & 2033
- Figure 60: Asia Pacific GaN Flash Chargers Volume (K), by Country 2025 & 2033
- Figure 61: Asia Pacific GaN Flash Chargers Revenue Share (%), by Country 2025 & 2033
- Figure 62: Asia Pacific GaN Flash Chargers Volume Share (%), by Country 2025 & 2033
List of Tables
- Table 1: Global GaN Flash Chargers Revenue million Forecast, by Application 2020 & 2033
- Table 2: Global GaN Flash Chargers Volume K Forecast, by Application 2020 & 2033
- Table 3: Global GaN Flash Chargers Revenue million Forecast, by Types 2020 & 2033
- Table 4: Global GaN Flash Chargers Volume K Forecast, by Types 2020 & 2033
- Table 5: Global GaN Flash Chargers Revenue million Forecast, by Region 2020 & 2033
- Table 6: Global GaN Flash Chargers Volume K Forecast, by Region 2020 & 2033
- Table 7: Global GaN Flash Chargers Revenue million Forecast, by Application 2020 & 2033
- Table 8: Global GaN Flash Chargers Volume K Forecast, by Application 2020 & 2033
- Table 9: Global GaN Flash Chargers Revenue million Forecast, by Types 2020 & 2033
- Table 10: Global GaN Flash Chargers Volume K Forecast, by Types 2020 & 2033
- Table 11: Global GaN Flash Chargers Revenue million Forecast, by Country 2020 & 2033
- Table 12: Global GaN Flash Chargers Volume K Forecast, by Country 2020 & 2033
- Table 13: United States GaN Flash Chargers Revenue (million) Forecast, by Application 2020 & 2033
- Table 14: United States GaN Flash Chargers Volume (K) Forecast, by Application 2020 & 2033
- Table 15: Canada GaN Flash Chargers Revenue (million) Forecast, by Application 2020 & 2033
- Table 16: Canada GaN Flash Chargers Volume (K) Forecast, by Application 2020 & 2033
- Table 17: Mexico GaN Flash Chargers Revenue (million) Forecast, by Application 2020 & 2033
- Table 18: Mexico GaN Flash Chargers Volume (K) Forecast, by Application 2020 & 2033
- Table 19: Global GaN Flash Chargers Revenue million Forecast, by Application 2020 & 2033
- Table 20: Global GaN Flash Chargers Volume K Forecast, by Application 2020 & 2033
- Table 21: Global GaN Flash Chargers Revenue million Forecast, by Types 2020 & 2033
- Table 22: Global GaN Flash Chargers Volume K Forecast, by Types 2020 & 2033
- Table 23: Global GaN Flash Chargers Revenue million Forecast, by Country 2020 & 2033
- Table 24: Global GaN Flash Chargers Volume K Forecast, by Country 2020 & 2033
- Table 25: Brazil GaN Flash Chargers Revenue (million) Forecast, by Application 2020 & 2033
- Table 26: Brazil GaN Flash Chargers Volume (K) Forecast, by Application 2020 & 2033
- Table 27: Argentina GaN Flash Chargers Revenue (million) Forecast, by Application 2020 & 2033
- Table 28: Argentina GaN Flash Chargers Volume (K) Forecast, by Application 2020 & 2033
- Table 29: Rest of South America GaN Flash Chargers Revenue (million) Forecast, by Application 2020 & 2033
- Table 30: Rest of South America GaN Flash Chargers Volume (K) Forecast, by Application 2020 & 2033
- Table 31: Global GaN Flash Chargers Revenue million Forecast, by Application 2020 & 2033
- Table 32: Global GaN Flash Chargers Volume K Forecast, by Application 2020 & 2033
- Table 33: Global GaN Flash Chargers Revenue million Forecast, by Types 2020 & 2033
- Table 34: Global GaN Flash Chargers Volume K Forecast, by Types 2020 & 2033
- Table 35: Global GaN Flash Chargers Revenue million Forecast, by Country 2020 & 2033
- Table 36: Global GaN Flash Chargers Volume K Forecast, by Country 2020 & 2033
- Table 37: United Kingdom GaN Flash Chargers Revenue (million) Forecast, by Application 2020 & 2033
- Table 38: United Kingdom GaN Flash Chargers Volume (K) Forecast, by Application 2020 & 2033
- Table 39: Germany GaN Flash Chargers Revenue (million) Forecast, by Application 2020 & 2033
- Table 40: Germany GaN Flash Chargers Volume (K) Forecast, by Application 2020 & 2033
- Table 41: France GaN Flash Chargers Revenue (million) Forecast, by Application 2020 & 2033
- Table 42: France GaN Flash Chargers Volume (K) Forecast, by Application 2020 & 2033
- Table 43: Italy GaN Flash Chargers Revenue (million) Forecast, by Application 2020 & 2033
- Table 44: Italy GaN Flash Chargers Volume (K) Forecast, by Application 2020 & 2033
- Table 45: Spain GaN Flash Chargers Revenue (million) Forecast, by Application 2020 & 2033
- Table 46: Spain GaN Flash Chargers Volume (K) Forecast, by Application 2020 & 2033
- Table 47: Russia GaN Flash Chargers Revenue (million) Forecast, by Application 2020 & 2033
- Table 48: Russia GaN Flash Chargers Volume (K) Forecast, by Application 2020 & 2033
- Table 49: Benelux GaN Flash Chargers Revenue (million) Forecast, by Application 2020 & 2033
- Table 50: Benelux GaN Flash Chargers Volume (K) Forecast, by Application 2020 & 2033
- Table 51: Nordics GaN Flash Chargers Revenue (million) Forecast, by Application 2020 & 2033
- Table 52: Nordics GaN Flash Chargers Volume (K) Forecast, by Application 2020 & 2033
- Table 53: Rest of Europe GaN Flash Chargers Revenue (million) Forecast, by Application 2020 & 2033
- Table 54: Rest of Europe GaN Flash Chargers Volume (K) Forecast, by Application 2020 & 2033
- Table 55: Global GaN Flash Chargers Revenue million Forecast, by Application 2020 & 2033
- Table 56: Global GaN Flash Chargers Volume K Forecast, by Application 2020 & 2033
- Table 57: Global GaN Flash Chargers Revenue million Forecast, by Types 2020 & 2033
- Table 58: Global GaN Flash Chargers Volume K Forecast, by Types 2020 & 2033
- Table 59: Global GaN Flash Chargers Revenue million Forecast, by Country 2020 & 2033
- Table 60: Global GaN Flash Chargers Volume K Forecast, by Country 2020 & 2033
- Table 61: Turkey GaN Flash Chargers Revenue (million) Forecast, by Application 2020 & 2033
- Table 62: Turkey GaN Flash Chargers Volume (K) Forecast, by Application 2020 & 2033
- Table 63: Israel GaN Flash Chargers Revenue (million) Forecast, by Application 2020 & 2033
- Table 64: Israel GaN Flash Chargers Volume (K) Forecast, by Application 2020 & 2033
- Table 65: GCC GaN Flash Chargers Revenue (million) Forecast, by Application 2020 & 2033
- Table 66: GCC GaN Flash Chargers Volume (K) Forecast, by Application 2020 & 2033
- Table 67: North Africa GaN Flash Chargers Revenue (million) Forecast, by Application 2020 & 2033
- Table 68: North Africa GaN Flash Chargers Volume (K) Forecast, by Application 2020 & 2033
- Table 69: South Africa GaN Flash Chargers Revenue (million) Forecast, by Application 2020 & 2033
- Table 70: South Africa GaN Flash Chargers Volume (K) Forecast, by Application 2020 & 2033
- Table 71: Rest of Middle East & Africa GaN Flash Chargers Revenue (million) Forecast, by Application 2020 & 2033
- Table 72: Rest of Middle East & Africa GaN Flash Chargers Volume (K) Forecast, by Application 2020 & 2033
- Table 73: Global GaN Flash Chargers Revenue million Forecast, by Application 2020 & 2033
- Table 74: Global GaN Flash Chargers Volume K Forecast, by Application 2020 & 2033
- Table 75: Global GaN Flash Chargers Revenue million Forecast, by Types 2020 & 2033
- Table 76: Global GaN Flash Chargers Volume K Forecast, by Types 2020 & 2033
- Table 77: Global GaN Flash Chargers Revenue million Forecast, by Country 2020 & 2033
- Table 78: Global GaN Flash Chargers Volume K Forecast, by Country 2020 & 2033
- Table 79: China GaN Flash Chargers Revenue (million) Forecast, by Application 2020 & 2033
- Table 80: China GaN Flash Chargers Volume (K) Forecast, by Application 2020 & 2033
- Table 81: India GaN Flash Chargers Revenue (million) Forecast, by Application 2020 & 2033
- Table 82: India GaN Flash Chargers Volume (K) Forecast, by Application 2020 & 2033
- Table 83: Japan GaN Flash Chargers Revenue (million) Forecast, by Application 2020 & 2033
- Table 84: Japan GaN Flash Chargers Volume (K) Forecast, by Application 2020 & 2033
- Table 85: South Korea GaN Flash Chargers Revenue (million) Forecast, by Application 2020 & 2033
- Table 86: South Korea GaN Flash Chargers Volume (K) Forecast, by Application 2020 & 2033
- Table 87: ASEAN GaN Flash Chargers Revenue (million) Forecast, by Application 2020 & 2033
- Table 88: ASEAN GaN Flash Chargers Volume (K) Forecast, by Application 2020 & 2033
- Table 89: Oceania GaN Flash Chargers Revenue (million) Forecast, by Application 2020 & 2033
- Table 90: Oceania GaN Flash Chargers Volume (K) Forecast, by Application 2020 & 2033
- Table 91: Rest of Asia Pacific GaN Flash Chargers Revenue (million) Forecast, by Application 2020 & 2033
- Table 92: Rest of Asia Pacific GaN Flash Chargers Volume (K) Forecast, by Application 2020 & 2033
Frequently Asked Questions
1. What is the projected Compound Annual Growth Rate (CAGR) of the GaN Flash Chargers?
The projected CAGR is approximately 12.7%.
2. Which companies are prominent players in the GaN Flash Chargers?
Key companies in the market include Ravpower (Sunvalley), Belkin International, Aukey, Samsung, Apple, Zendure, Hyper, Baseus, Anker Innovations Technology, Ugreen Group, Xiaomi, HUAWEI, Nubia Technology, Shenzhen Remax Technology, PISEN, MOMAX, Sunwoda Electronic, Anfu CE LINK, Lenovo, ZTE, OPPO, realme.
3. What are the main segments of the GaN Flash Chargers?
The market segments include Application, Types.
4. Can you provide details about the market size?
The market size is estimated to be USD 602 million as of 2022.
5. What are some drivers contributing to market growth?
N/A
6. What are the notable trends driving market growth?
N/A
7. Are there any restraints impacting market growth?
N/A
8. Can you provide examples of recent developments in the market?
N/A
9. What pricing options are available for accessing the report?
Pricing options include single-user, multi-user, and enterprise licenses priced at USD 3950.00, USD 5925.00, and USD 7900.00 respectively.
10. Is the market size provided in terms of value or volume?
The market size is provided in terms of value, measured in million and volume, measured in K.
11. Are there any specific market keywords associated with the report?
Yes, the market keyword associated with the report is "GaN Flash Chargers," which aids in identifying and referencing the specific market segment covered.
12. How do I determine which pricing option suits my needs best?
The pricing options vary based on user requirements and access needs. Individual users may opt for single-user licenses, while businesses requiring broader access may choose multi-user or enterprise licenses for cost-effective access to the report.
13. Are there any additional resources or data provided in the GaN Flash Chargers report?
While the report offers comprehensive insights, it's advisable to review the specific contents or supplementary materials provided to ascertain if additional resources or data are available.
14. How can I stay updated on further developments or reports in the GaN Flash Chargers?
To stay informed about further developments, trends, and reports in the GaN Flash Chargers, consider subscribing to industry newsletters, following relevant companies and organizations, or regularly checking reputable industry news sources and publications.
Methodology
Step 1 - Identification of Relevant Samples Size from Population Database


Step 2 - Approaches for Defining Global Market Size (Value, Volume* & Price*)

Note*: In applicable scenarios
Step 3 - Data Sources
Primary Research
- Web Analytics
- Survey Reports
- Research Institute
- Latest Research Reports
- Opinion Leaders
Secondary Research
- Annual Reports
- White Paper
- Latest Press Release
- Industry Association
- Paid Database
- Investor Presentations

Step 4 - Data Triangulation
Involves using different sources of information in order to increase the validity of a study
These sources are likely to be stakeholders in a program - participants, other researchers, program staff, other community members, and so on.
Then we put all data in single framework & apply various statistical tools to find out the dynamic on the market.
During the analysis stage, feedback from the stakeholder groups would be compared to determine areas of agreement as well as areas of divergence