

Key Insights
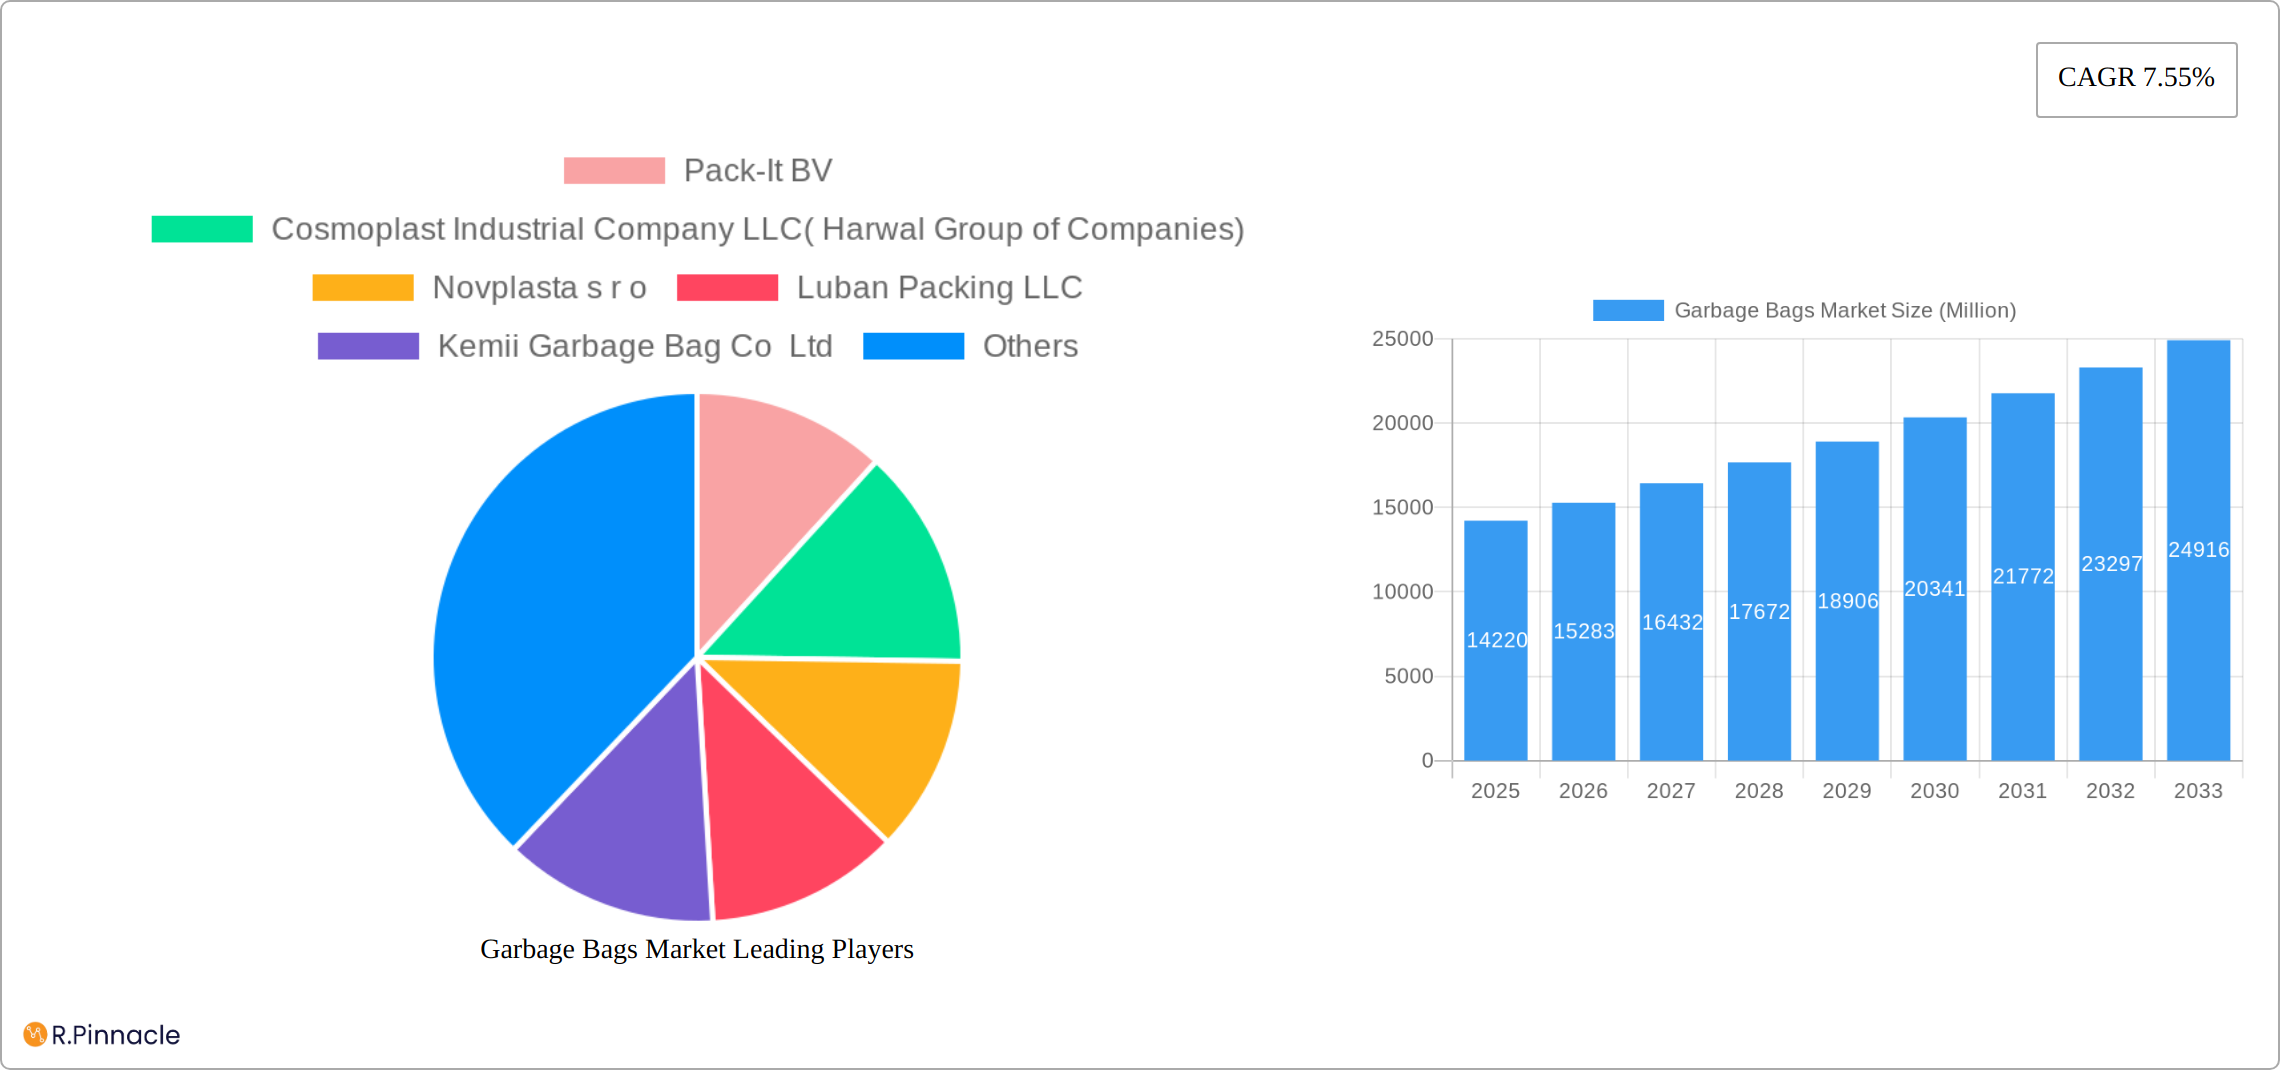
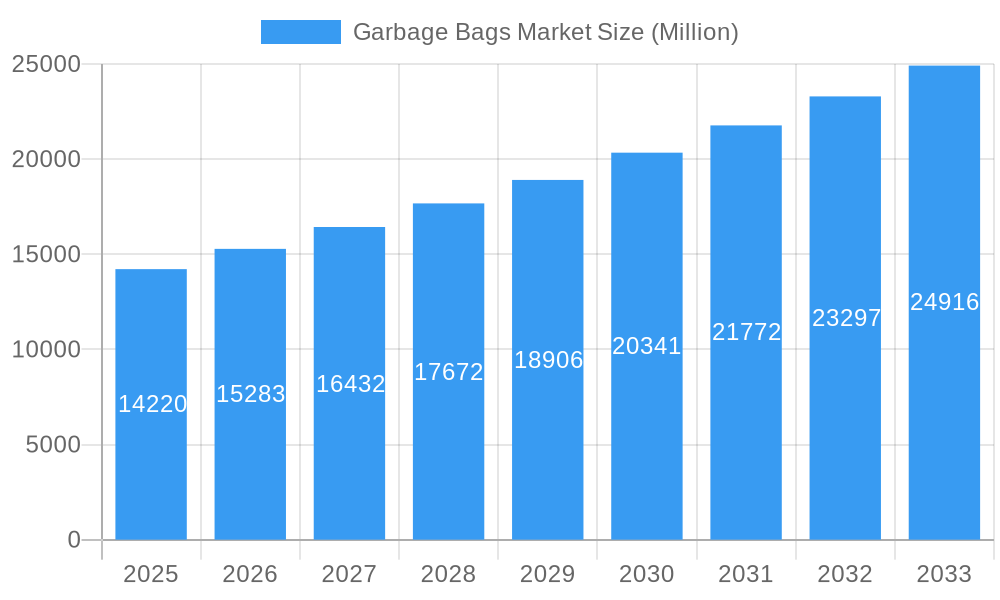
The global garbage bag market, valued at $14.22 billion in 2025, is projected to experience robust growth, exhibiting a Compound Annual Growth Rate (CAGR) of 7.55% from 2025 to 2033. This expansion is driven by several key factors. Increasing urbanization leads to higher waste generation, fueling demand for effective waste management solutions. Growing environmental awareness is promoting the adoption of biodegradable and compostable garbage bags, contributing to market growth in the sustainable packaging segment. Furthermore, the rising convenience offered by pre-tied and scented garbage bags is attracting a wider consumer base. The retail segment currently dominates the end-user industries, followed by institutional and industrial sectors. Key players in this market, such as Berry Global Inc., Hefty (Reynolds Consumer Products LLC), and Novolex, are focusing on innovation and product diversification to maintain their competitive edge. Geographical expansion, particularly in rapidly developing economies of Asia-Pacific, is another significant growth driver. While challenges such as fluctuating raw material prices and environmental regulations exist, the overall market outlook remains positive, driven by the consistent need for efficient waste disposal solutions globally.
Garbage Bags Market Market Size (In Billion)
The market segmentation reveals significant opportunities across different regions. North America, with its established waste management infrastructure and high consumer spending, holds a substantial market share. However, the Asia-Pacific region is expected to witness the fastest growth due to rapid urbanization and increasing disposable incomes, creating considerable demand for garbage bags. Europe, although a mature market, is witnessing a shift towards eco-friendly options, thereby presenting growth prospects for sustainable garbage bag manufacturers. Competition is intense, with both established multinational corporations and regional players vying for market share. Future growth will depend on factors such as the development of innovative materials, effective marketing strategies targeted at environmental consciousness, and strategic partnerships to optimize supply chains and distribution networks.
Garbage Bags Market Company Market Share
Garbage Bags Market: A Comprehensive Report (2019-2033)
This comprehensive report provides an in-depth analysis of the global Garbage Bags Market, offering invaluable insights for industry professionals, investors, and strategic decision-makers. Covering the period from 2019 to 2033, with a focus on 2025, this report delves into market dynamics, competitive landscapes, and future growth potential. The study period is 2019-2033, the base year is 2025, the estimated year is 2025 and the forecast period is 2025-2033. The historical period covered is 2019-2024. The market size is predicted to be xx Million in 2025.
Garbage Bags Market Market Structure & Innovation Trends
This section delves into the dynamic structure of the garbage bags market, analyzing key trends driving its evolution. We examine market concentration, identifying major players and their respective market shares, providing a comprehensive overview of the competitive landscape. The report meticulously assesses the influence of innovation drivers, regulatory frameworks, the presence of substitute products, and evolving consumer preferences. Furthermore, it explores end-user demographics and their impact on market demand, along with a detailed review of recent mergers and acquisitions (M&A) activities, including deal values and their impact on market consolidation. We also analyze the impact of supply chain disruptions and raw material price fluctuations on market stability.
- Market Concentration and Competitive Landscape: The market exhibits [Describe the level of concentration - e.g., moderate, high, fragmented] concentration, with key players holding [Specific percentage or range]% of the market share in 2025. Analysis includes a discussion of competitive strategies employed by leading players, including pricing strategies, product differentiation, and market expansion tactics.
- Innovation Drivers: The growing demand for eco-friendly alternatives, such as biodegradable and compostable bags, coupled with increasingly stringent environmental regulations globally, is a significant innovation driver. Advancements in material science and manufacturing processes are also contributing to the development of more sustainable and efficient garbage bag solutions.
- Regulatory Frameworks and their Impact: Government regulations concerning plastic waste management, including bans on single-use plastics and extended producer responsibility (EPR) schemes, significantly influence market dynamics, product development, and the adoption of sustainable alternatives.
- Product Substitutes and Competitive Threats: Reusable bags, alternative waste management solutions (e.g., waste-to-energy technologies), and advancements in recycling technologies pose a competitive challenge to traditional garbage bags. The report assesses the market share and growth potential of these substitutes.
- M&A Activity and Market Consolidation: The report details completed M&A deals in the historical period (2019-2024), analyzing their impact on market consolidation, deal values (approximately [Specific range or figure] Million), and the strategic rationale behind these transactions. We also forecast future M&A activity based on current market trends.
- End-User Demographics and Shifting Consumer Preferences: Shifting consumer preferences toward sustainability, convenience, and cost-effectiveness impact demand across various end-user segments (Retail, Institutional, Industrial). The report analyzes these preferences and their implications for market growth.
Garbage Bags Market Market Dynamics & Trends
This section analyzes the key factors driving market growth, technological disruptions, evolving consumer preferences, and the competitive landscape. We project a Compound Annual Growth Rate (CAGR) of xx% during the forecast period (2025-2033), driven by several factors. Market penetration for biodegradable bags is expected to increase from xx% in 2025 to xx% by 2033.
Dominant Regions & Segments in Garbage Bags Market
This section identifies the leading regions and segments within the garbage bags market. Analyzing data from the Retail, Institutional, and Industrial end-user industries, we pinpoint the most dominant areas and their key drivers. The analysis includes a geographical breakdown of market share and growth projections for each region and segment.
- Dominant Region: [Region Name] is expected to hold the largest market share by [Year] due to [Specific reasons, e.g., high population density, robust economic growth, favorable government policies, strong existing infrastructure for waste management]. The report provides a detailed regional analysis, highlighting growth opportunities and challenges in each key region.
- Leading Segment: The [Segment Name, e.g., Retail] segment is projected to dominate due to [Specific reasons, e.g., high demand for convenience, extensive distribution networks, and increased consumer spending on household products]. We explore the unique characteristics and drivers of each segment.
- Key Drivers:
- Economic Policies and Government Initiatives: Government incentives, subsidies for eco-friendly products, and regulations impacting plastic waste significantly influence market growth.
- Infrastructure Development: Efficient waste management systems, including collection, transportation, and processing infrastructure, directly impact market expansion in specific regions.
- Consumer Preferences and Lifestyle Changes: Changing lifestyles, increased awareness of environmental issues, and a growing preference for convenience drive segment-specific demand.
- Technological Advancements: Innovations in material science, manufacturing techniques, and packaging technologies are creating new opportunities for growth.
Garbage Bags Market Product Innovations
Recent innovations focus on biodegradable and compostable materials, aiming to reduce environmental impact. Companies are investing in advanced manufacturing techniques to enhance product durability and functionality, while addressing rising consumer demand for sustainable packaging solutions. These innovations have a positive impact on market share and profitability.
Report Scope & Segmentation Analysis
This report segments the garbage bags market by end-user industries: Retail, Institutional, and Industrial.
Retail: This segment encompasses garbage bags sold through supermarkets, convenience stores, and online retailers. The market size for Retail is projected to be xx Million in 2025, with a CAGR of xx% during the forecast period. Competitive dynamics are driven by pricing and brand recognition.
Institutional: This segment includes garbage bags used in hospitals, schools, and government buildings. The market size is projected to be xx Million in 2025, with a CAGR of xx% during the forecast period. Key factors include government contracts and bulk purchasing.
Industrial: This segment covers garbage bags used in manufacturing, construction, and other industrial applications. The market size for Industrial is projected to be xx Million in 2025, with a CAGR of xx% during the forecast period. This segment focuses on specialized materials and high-volume orders.
Key Drivers of Garbage Bags Market Growth
Growth is primarily driven by the increasing global generation of waste, rising environmental awareness and concerns about plastic pollution, stricter regulations on plastic waste, and the burgeoning adoption of biodegradable and compostable options. Technological advancements in material science and manufacturing processes, coupled with efficient supply chains, further contribute to market expansion. The report also quantifies the impact of each driver on market growth.
Challenges in the Garbage Bags Market Sector
The market faces challenges including fluctuations in raw material prices, increasing competition from substitute products, stringent environmental regulations, and potential supply chain disruptions. These factors can impact production costs and market profitability.
Emerging Opportunities in Garbage Bags Market
Emerging opportunities lie in the development of innovative biodegradable and compostable materials, expansion into new geographic markets, and catering to the rising demand for sustainable and eco-friendly packaging solutions. Further opportunities exist in customized solutions for niche industrial sectors.
Leading Players in the Garbage Bags Market Market
- Pack-It BV
- Cosmoplast Industrial Company LLC (Harwal Group of Companies)
- Novplasta s r o
- Luban Packing LLC
- Kemii Garbage Bag Co Ltd
- Berry Global Inc
- International Plastics Inc
- Hefty (Reynolds Consumer Products LLC)
- Novolex
- Terdex GmbH
Key Developments in Garbage Bags Market Industry
- October 2022: ECOSAC launches Ecopath, a line of biodegradable consumer products, including compostable garbage bags (Kachra sack), impacting the market by increasing consumer choice and promoting sustainability. This and other key developments are analyzed for their impact on market competition and innovation.
- [Add other significant developments with dates and descriptions of their impact on the market]
Future Outlook for Garbage Bags Market Market
The future of the garbage bags market is projected to witness continued growth, driven by persistent increases in waste generation, escalating environmental consciousness, and ongoing technological innovations in sustainable materials. Strategic partnerships, mergers and acquisitions, product diversification, and the development of innovative recycling solutions will play a crucial role in shaping the market's future trajectory. The report provides detailed market forecasts and growth projections for the coming years, considering various factors impacting market growth.
Garbage Bags Market Segmentation
-
1. End-user Industries
- 1.1. Residential
- 1.2. Institutional
- 1.3. Industrial and Commercial
Garbage Bags Market Segmentation By Geography
-
1. North America
- 1.1. United States
- 1.2. Canada
-
2. Europe
- 2.1. United Kingdom
- 2.2. Germany
- 2.3. France
- 2.4. Spain
-
3. Asia
- 3.1. India
- 3.2. China
- 3.3. Japan
- 3.4. Australia and New Zealand
- 4. Latin America
- 5. Middle East and Africa
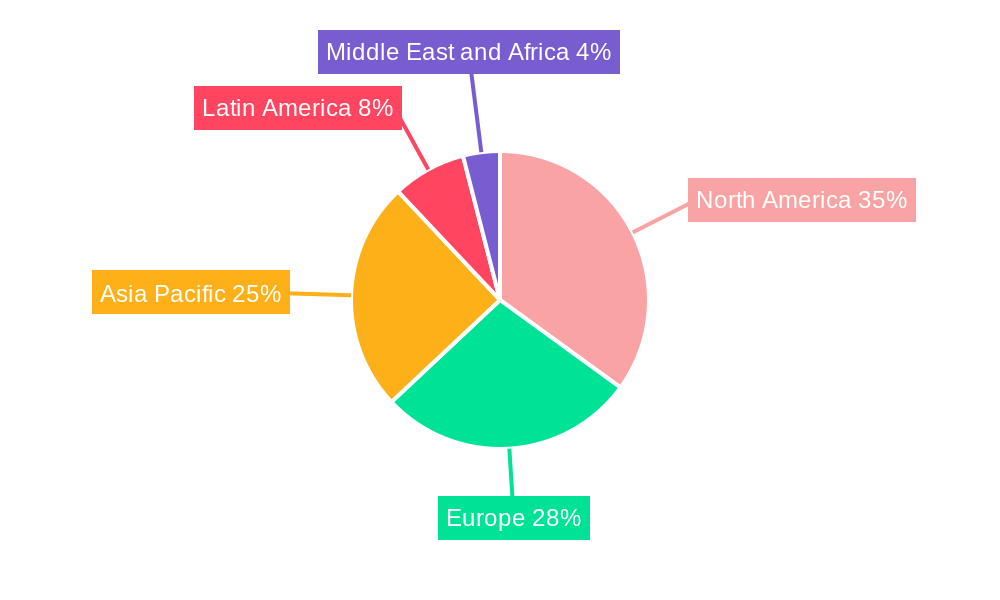
Garbage Bags Market Regional Market Share
Geographic Coverage of Garbage Bags Market
Garbage Bags Market REPORT HIGHLIGHTS
| Aspects | Details |
|---|---|
| Study Period | 2020-2034 |
| Base Year | 2025 |
| Estimated Year | 2026 |
| Forecast Period | 2026-2034 |
| Historical Period | 2020-2025 |
| Growth Rate | CAGR of 7.55% from 2020-2034 |
| Segmentation |
|
Table of Contents
- 1. Introduction
- 1.1. Research Scope
- 1.2. Market Segmentation
- 1.3. Research Objective
- 1.4. Definitions and Assumptions
- 2. Executive Summary
- 2.1. Market Snapshot
- 3. Market Dynamics
- 3.1. Market Drivers
- 3.2. Market Restrains
- 3.3. Market Trends
- 3.4. Market Opportunities
- 4. Market Factor Analysis
- 4.1. Porters Five Forces
- 4.1.1. Bargaining Power of Suppliers
- 4.1.2. Bargaining Power of Buyers
- 4.1.3. Threat of New Entrants
- 4.1.4. Threat of Substitutes
- 4.1.5. Competitive Rivalry
- 4.2. PESTEL analysis
- 4.3. BCG Analysis
- 4.3.1. Stars (High Growth, High Market Share)
- 4.3.2. Cash Cows (Low Growth, High Market Share)
- 4.3.3. Question Mark (High Growth, Low Market Share)
- 4.3.4. Dogs (Low Growth, Low Market Share)
- 4.4. Ansoff Matrix Analysis
- 4.5. Supply Chain Analysis
- 4.6. Regulatory Landscape
- 4.7. Current Market Potential and Opportunity Assessment (TAM–SAM–SOM Framework)
- 4.8. PRI Analyst Note
- 4.1. Porters Five Forces
- 5. Market Analysis, Insights and Forecast 2021-2033
- 5.1. Market Analysis, Insights and Forecast - by End-user Industries
- 5.1.1. Residential
- 5.1.2. Institutional
- 5.1.3. Industrial and Commercial
- 5.2. Market Analysis, Insights and Forecast - by Region
- 5.2.1. North America
- 5.2.2. Europe
- 5.2.3. Asia
- 5.2.4. Latin America
- 5.2.5. Middle East and Africa
- 5.1. Market Analysis, Insights and Forecast - by End-user Industries
- 6. Global Garbage Bags Market Analysis, Insights and Forecast, 2021-2033
- 6.1. Market Analysis, Insights and Forecast - by End-user Industries
- 6.1.1. Residential
- 6.1.2. Institutional
- 6.1.3. Industrial and Commercial
- 6.1. Market Analysis, Insights and Forecast - by End-user Industries
- 7. North America Garbage Bags Market Analysis, Insights and Forecast, 2020-2032
- 7.1. Market Analysis, Insights and Forecast - by End-user Industries
- 7.1.1. Residential
- 7.1.2. Institutional
- 7.1.3. Industrial and Commercial
- 7.1. Market Analysis, Insights and Forecast - by End-user Industries
- 8. Europe Garbage Bags Market Analysis, Insights and Forecast, 2020-2032
- 8.1. Market Analysis, Insights and Forecast - by End-user Industries
- 8.1.1. Residential
- 8.1.2. Institutional
- 8.1.3. Industrial and Commercial
- 8.1. Market Analysis, Insights and Forecast - by End-user Industries
- 9. Asia Garbage Bags Market Analysis, Insights and Forecast, 2020-2032
- 9.1. Market Analysis, Insights and Forecast - by End-user Industries
- 9.1.1. Residential
- 9.1.2. Institutional
- 9.1.3. Industrial and Commercial
- 9.1. Market Analysis, Insights and Forecast - by End-user Industries
- 10. Latin America Garbage Bags Market Analysis, Insights and Forecast, 2020-2032
- 10.1. Market Analysis, Insights and Forecast - by End-user Industries
- 10.1.1. Residential
- 10.1.2. Institutional
- 10.1.3. Industrial and Commercial
- 10.1. Market Analysis, Insights and Forecast - by End-user Industries
- 11. Middle East and Africa Garbage Bags Market Analysis, Insights and Forecast, 2020-2032
- 11.1. Market Analysis, Insights and Forecast - by End-user Industries
- 11.1.1. Residential
- 11.1.2. Institutional
- 11.1.3. Industrial and Commercial
- 11.1. Market Analysis, Insights and Forecast - by End-user Industries
- 12. Competitive Analysis
- 12.1. Company Profiles
- 12.1.1 Pack-It BV
- 12.1.1.1. Company Overview
- 12.1.1.2. Products
- 12.1.1.3. Company Financials
- 12.1.1.4. SWOT Analysis
- 12.1.2 Cosmoplast Industrial Company LLC( Harwal Group of Companies)
- 12.1.2.1. Company Overview
- 12.1.2.2. Products
- 12.1.2.3. Company Financials
- 12.1.2.4. SWOT Analysis
- 12.1.3 Novplasta s r o
- 12.1.3.1. Company Overview
- 12.1.3.2. Products
- 12.1.3.3. Company Financials
- 12.1.3.4. SWOT Analysis
- 12.1.4 Luban Packing LLC
- 12.1.4.1. Company Overview
- 12.1.4.2. Products
- 12.1.4.3. Company Financials
- 12.1.4.4. SWOT Analysis
- 12.1.5 Kemii Garbage Bag Co Ltd
- 12.1.5.1. Company Overview
- 12.1.5.2. Products
- 12.1.5.3. Company Financials
- 12.1.5.4. SWOT Analysis
- 12.1.6 Berry Global Inc *List Not Exhaustive
- 12.1.6.1. Company Overview
- 12.1.6.2. Products
- 12.1.6.3. Company Financials
- 12.1.6.4. SWOT Analysis
- 12.1.7 International Plastics Inc
- 12.1.7.1. Company Overview
- 12.1.7.2. Products
- 12.1.7.3. Company Financials
- 12.1.7.4. SWOT Analysis
- 12.1.8 Hefty(Reynolds Consumer Products LLC)
- 12.1.8.1. Company Overview
- 12.1.8.2. Products
- 12.1.8.3. Company Financials
- 12.1.8.4. SWOT Analysis
- 12.1.9 Novolex
- 12.1.9.1. Company Overview
- 12.1.9.2. Products
- 12.1.9.3. Company Financials
- 12.1.9.4. SWOT Analysis
- 12.1.10 Terdex GmbH
- 12.1.10.1. Company Overview
- 12.1.10.2. Products
- 12.1.10.3. Company Financials
- 12.1.10.4. SWOT Analysis
- 12.1.1 Pack-It BV
- 12.2. Market Entropy
- 12.2.1 Company's Key Areas Served
- 12.2.2 Recent Developments
- 12.3. Company Market Share Analysis 2025
- 12.3.1 Top 5 Companies Market Share Analysis
- 12.3.2 Top 3 Companies Market Share Analysis
- 12.4. List of Potential Customers
- 13. Research Methodology
List of Figures
- Figure 1: Global Garbage Bags Market Revenue Breakdown (Million, %) by Region 2025 & 2033
- Figure 2: Global Garbage Bags Market Volume Breakdown (K Tons, %) by Region 2025 & 2033
- Figure 3: North America Garbage Bags Market Revenue (Million), by End-user Industries 2025 & 2033
- Figure 4: North America Garbage Bags Market Volume (K Tons), by End-user Industries 2025 & 2033
- Figure 5: North America Garbage Bags Market Revenue Share (%), by End-user Industries 2025 & 2033
- Figure 6: North America Garbage Bags Market Volume Share (%), by End-user Industries 2025 & 2033
- Figure 7: North America Garbage Bags Market Revenue (Million), by Country 2025 & 2033
- Figure 8: North America Garbage Bags Market Volume (K Tons), by Country 2025 & 2033
- Figure 9: North America Garbage Bags Market Revenue Share (%), by Country 2025 & 2033
- Figure 10: North America Garbage Bags Market Volume Share (%), by Country 2025 & 2033
- Figure 11: Europe Garbage Bags Market Revenue (Million), by End-user Industries 2025 & 2033
- Figure 12: Europe Garbage Bags Market Volume (K Tons), by End-user Industries 2025 & 2033
- Figure 13: Europe Garbage Bags Market Revenue Share (%), by End-user Industries 2025 & 2033
- Figure 14: Europe Garbage Bags Market Volume Share (%), by End-user Industries 2025 & 2033
- Figure 15: Europe Garbage Bags Market Revenue (Million), by Country 2025 & 2033
- Figure 16: Europe Garbage Bags Market Volume (K Tons), by Country 2025 & 2033
- Figure 17: Europe Garbage Bags Market Revenue Share (%), by Country 2025 & 2033
- Figure 18: Europe Garbage Bags Market Volume Share (%), by Country 2025 & 2033
- Figure 19: Asia Garbage Bags Market Revenue (Million), by End-user Industries 2025 & 2033
- Figure 20: Asia Garbage Bags Market Volume (K Tons), by End-user Industries 2025 & 2033
- Figure 21: Asia Garbage Bags Market Revenue Share (%), by End-user Industries 2025 & 2033
- Figure 22: Asia Garbage Bags Market Volume Share (%), by End-user Industries 2025 & 2033
- Figure 23: Asia Garbage Bags Market Revenue (Million), by Country 2025 & 2033
- Figure 24: Asia Garbage Bags Market Volume (K Tons), by Country 2025 & 2033
- Figure 25: Asia Garbage Bags Market Revenue Share (%), by Country 2025 & 2033
- Figure 26: Asia Garbage Bags Market Volume Share (%), by Country 2025 & 2033
- Figure 27: Latin America Garbage Bags Market Revenue (Million), by End-user Industries 2025 & 2033
- Figure 28: Latin America Garbage Bags Market Volume (K Tons), by End-user Industries 2025 & 2033
- Figure 29: Latin America Garbage Bags Market Revenue Share (%), by End-user Industries 2025 & 2033
- Figure 30: Latin America Garbage Bags Market Volume Share (%), by End-user Industries 2025 & 2033
- Figure 31: Latin America Garbage Bags Market Revenue (Million), by Country 2025 & 2033
- Figure 32: Latin America Garbage Bags Market Volume (K Tons), by Country 2025 & 2033
- Figure 33: Latin America Garbage Bags Market Revenue Share (%), by Country 2025 & 2033
- Figure 34: Latin America Garbage Bags Market Volume Share (%), by Country 2025 & 2033
- Figure 35: Middle East and Africa Garbage Bags Market Revenue (Million), by End-user Industries 2025 & 2033
- Figure 36: Middle East and Africa Garbage Bags Market Volume (K Tons), by End-user Industries 2025 & 2033
- Figure 37: Middle East and Africa Garbage Bags Market Revenue Share (%), by End-user Industries 2025 & 2033
- Figure 38: Middle East and Africa Garbage Bags Market Volume Share (%), by End-user Industries 2025 & 2033
- Figure 39: Middle East and Africa Garbage Bags Market Revenue (Million), by Country 2025 & 2033
- Figure 40: Middle East and Africa Garbage Bags Market Volume (K Tons), by Country 2025 & 2033
- Figure 41: Middle East and Africa Garbage Bags Market Revenue Share (%), by Country 2025 & 2033
- Figure 42: Middle East and Africa Garbage Bags Market Volume Share (%), by Country 2025 & 2033
List of Tables
- Table 1: Global Garbage Bags Market Revenue Million Forecast, by End-user Industries 2020 & 2033
- Table 2: Global Garbage Bags Market Volume K Tons Forecast, by End-user Industries 2020 & 2033
- Table 3: Global Garbage Bags Market Revenue Million Forecast, by Region 2020 & 2033
- Table 4: Global Garbage Bags Market Volume K Tons Forecast, by Region 2020 & 2033
- Table 5: Global Garbage Bags Market Revenue Million Forecast, by End-user Industries 2020 & 2033
- Table 6: Global Garbage Bags Market Volume K Tons Forecast, by End-user Industries 2020 & 2033
- Table 7: Global Garbage Bags Market Revenue Million Forecast, by Country 2020 & 2033
- Table 8: Global Garbage Bags Market Volume K Tons Forecast, by Country 2020 & 2033
- Table 9: United States Garbage Bags Market Revenue (Million) Forecast, by Application 2020 & 2033
- Table 10: United States Garbage Bags Market Volume (K Tons) Forecast, by Application 2020 & 2033
- Table 11: Canada Garbage Bags Market Revenue (Million) Forecast, by Application 2020 & 2033
- Table 12: Canada Garbage Bags Market Volume (K Tons) Forecast, by Application 2020 & 2033
- Table 13: Global Garbage Bags Market Revenue Million Forecast, by End-user Industries 2020 & 2033
- Table 14: Global Garbage Bags Market Volume K Tons Forecast, by End-user Industries 2020 & 2033
- Table 15: Global Garbage Bags Market Revenue Million Forecast, by Country 2020 & 2033
- Table 16: Global Garbage Bags Market Volume K Tons Forecast, by Country 2020 & 2033
- Table 17: United Kingdom Garbage Bags Market Revenue (Million) Forecast, by Application 2020 & 2033
- Table 18: United Kingdom Garbage Bags Market Volume (K Tons) Forecast, by Application 2020 & 2033
- Table 19: Germany Garbage Bags Market Revenue (Million) Forecast, by Application 2020 & 2033
- Table 20: Germany Garbage Bags Market Volume (K Tons) Forecast, by Application 2020 & 2033
- Table 21: France Garbage Bags Market Revenue (Million) Forecast, by Application 2020 & 2033
- Table 22: France Garbage Bags Market Volume (K Tons) Forecast, by Application 2020 & 2033
- Table 23: Spain Garbage Bags Market Revenue (Million) Forecast, by Application 2020 & 2033
- Table 24: Spain Garbage Bags Market Volume (K Tons) Forecast, by Application 2020 & 2033
- Table 25: Global Garbage Bags Market Revenue Million Forecast, by End-user Industries 2020 & 2033
- Table 26: Global Garbage Bags Market Volume K Tons Forecast, by End-user Industries 2020 & 2033
- Table 27: Global Garbage Bags Market Revenue Million Forecast, by Country 2020 & 2033
- Table 28: Global Garbage Bags Market Volume K Tons Forecast, by Country 2020 & 2033
- Table 29: India Garbage Bags Market Revenue (Million) Forecast, by Application 2020 & 2033
- Table 30: India Garbage Bags Market Volume (K Tons) Forecast, by Application 2020 & 2033
- Table 31: China Garbage Bags Market Revenue (Million) Forecast, by Application 2020 & 2033
- Table 32: China Garbage Bags Market Volume (K Tons) Forecast, by Application 2020 & 2033
- Table 33: Japan Garbage Bags Market Revenue (Million) Forecast, by Application 2020 & 2033
- Table 34: Japan Garbage Bags Market Volume (K Tons) Forecast, by Application 2020 & 2033
- Table 35: Australia and New Zealand Garbage Bags Market Revenue (Million) Forecast, by Application 2020 & 2033
- Table 36: Australia and New Zealand Garbage Bags Market Volume (K Tons) Forecast, by Application 2020 & 2033
- Table 37: Global Garbage Bags Market Revenue Million Forecast, by End-user Industries 2020 & 2033
- Table 38: Global Garbage Bags Market Volume K Tons Forecast, by End-user Industries 2020 & 2033
- Table 39: Global Garbage Bags Market Revenue Million Forecast, by Country 2020 & 2033
- Table 40: Global Garbage Bags Market Volume K Tons Forecast, by Country 2020 & 2033
- Table 41: Global Garbage Bags Market Revenue Million Forecast, by End-user Industries 2020 & 2033
- Table 42: Global Garbage Bags Market Volume K Tons Forecast, by End-user Industries 2020 & 2033
- Table 43: Global Garbage Bags Market Revenue Million Forecast, by Country 2020 & 2033
- Table 44: Global Garbage Bags Market Volume K Tons Forecast, by Country 2020 & 2033
Frequently Asked Questions
1. What is the projected Compound Annual Growth Rate (CAGR) of the Garbage Bags Market?
The projected CAGR is approximately 7.55%.
2. Which companies are prominent players in the Garbage Bags Market?
Key companies in the market include Pack-It BV, Cosmoplast Industrial Company LLC( Harwal Group of Companies), Novplasta s r o, Luban Packing LLC, Kemii Garbage Bag Co Ltd, Berry Global Inc *List Not Exhaustive, International Plastics Inc, Hefty(Reynolds Consumer Products LLC), Novolex, Terdex GmbH.
3. What are the main segments of the Garbage Bags Market?
The market segments include End-user Industries.
4. Can you provide details about the market size?
The market size is estimated to be USD 14.22 Million as of 2022.
5. What are some drivers contributing to market growth?
Rapid Urbanization; Growing Awareness for Hygiene.
6. What are the notable trends driving market growth?
Growing Concern Of Sustainablity and Demand for Sustainable Solution..
7. Are there any restraints impacting market growth?
Increasing Plastic Bans.
8. Can you provide examples of recent developments in the market?
October 2022 - ECOSAC launches Ecopath- A Line of Biodegradable Consumer Products. Ecopath offers eco-friendly alternatives for daily use consumer products to 'Ecopaths,' who believe in environmentalism. These products made using responsibly sourced natural, and biodegradable raw materials range from coir dishwashing scrub pads, paper stem cotton buds, wooden toothbrushes, tongue cleaners, wooden combs, bamboo straws, wooden shaving brushes, and razors to compostable garbage bags named Kachra sack (which are widely available in all major supermarkets).
9. What pricing options are available for accessing the report?
Pricing options include single-user, multi-user, and enterprise licenses priced at USD 4750, USD 5250, and USD 8750 respectively.
10. Is the market size provided in terms of value or volume?
The market size is provided in terms of value, measured in Million and volume, measured in K Tons.
11. Are there any specific market keywords associated with the report?
Yes, the market keyword associated with the report is "Garbage Bags Market," which aids in identifying and referencing the specific market segment covered.
12. How do I determine which pricing option suits my needs best?
The pricing options vary based on user requirements and access needs. Individual users may opt for single-user licenses, while businesses requiring broader access may choose multi-user or enterprise licenses for cost-effective access to the report.
13. Are there any additional resources or data provided in the Garbage Bags Market report?
While the report offers comprehensive insights, it's advisable to review the specific contents or supplementary materials provided to ascertain if additional resources or data are available.
14. How can I stay updated on further developments or reports in the Garbage Bags Market?
To stay informed about further developments, trends, and reports in the Garbage Bags Market, consider subscribing to industry newsletters, following relevant companies and organizations, or regularly checking reputable industry news sources and publications.
Methodology
Step 1 - Identification of Relevant Samples Size from Population Database


Step 2 - Approaches for Defining Global Market Size (Value, Volume* & Price*)

Note*: In applicable scenarios
Step 3 - Data Sources
Primary Research
- Web Analytics
- Survey Reports
- Research Institute
- Latest Research Reports
- Opinion Leaders
Secondary Research
- Annual Reports
- White Paper
- Latest Press Release
- Industry Association
- Paid Database
- Investor Presentations

Step 4 - Data Triangulation
Involves using different sources of information in order to increase the validity of a study
These sources are likely to be stakeholders in a program - participants, other researchers, program staff, other community members, and so on.
Then we put all data in single framework & apply various statistical tools to find out the dynamic on the market.
During the analysis stage, feedback from the stakeholder groups would be compared to determine areas of agreement as well as areas of divergence