

Key Insights
The global gas generator market is projected for significant expansion, driven by a compound annual growth rate (CAGR) of 4.1%. The market is estimated to reach $28.5 billion by 2025. Key growth catalysts include the escalating demand for dependable backup power solutions in industrial sectors, particularly in regions facing grid instability. The increasing adoption of gas generators in commercial and residential applications, fueled by concerns over power outages and rising electricity costs, further propels market growth. Technological innovations enhancing efficiency, reducing emissions, and improving durability are also positively impacting market expansion. Despite initial investment costs, the long-term cost savings and reliability offered by gas generators are increasingly recognized. Market segmentation highlights strong adoption across industrial (heavy manufacturing, data centers), commercial (businesses, retail), and residential (homes, farms) end-user segments. Power rating segmentation spans from less than 75 kVA for smaller needs to over 375 kVA for larger industrial applications. Leading industry players like F G Wilson, Cooper Corporation, AKSA Power Generation, Kohler Co, Caterpillar Inc, Cummins Inc, General Electric Company, Generac Holdings Inc, MTU America Inc, and Mitsubishi Heavy Industries Ltd are driving innovation and competitive strategies. Geographically, strong growth is anticipated in Asia-Pacific and the Middle East & Africa due to rapidly developing economies and increasing energy demands.
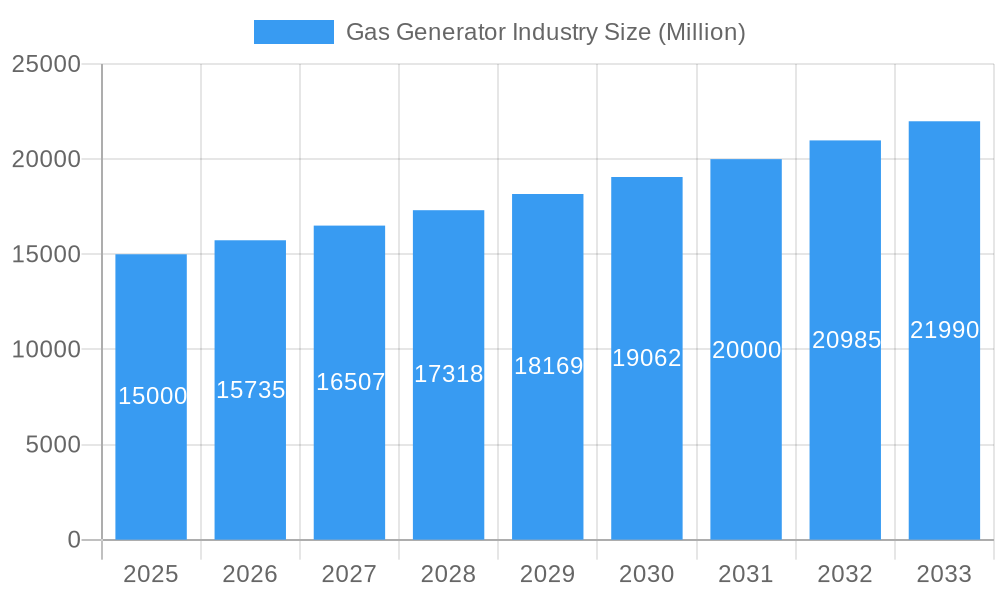
Gas Generator Industry Market Size (In Billion)
Emerging trends influencing the gas generator market include a heightened focus on environmentally friendly power solutions, prompting manufacturers to develop cleaner-burning generators with reduced carbon emissions. The integration of smart technologies for remote monitoring and predictive maintenance is enhancing operational efficiency and generator lifespan. While renewable energy adoption presents a long-term competitive landscape, it also creates opportunities for gas generators as complementary backup power for intermittent renewable sources. Future growth hinges on continued technological advancements, supportive regulations for cleaner energy, and ongoing infrastructure development. The market is expected to experience notable consolidation and strategic partnerships among key stakeholders.
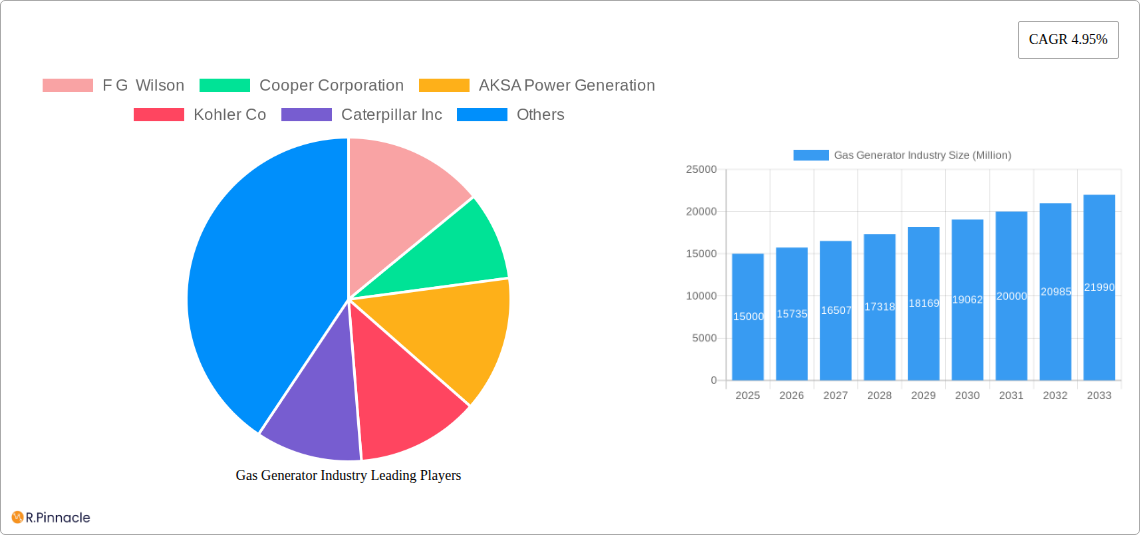
Gas Generator Industry Company Market Share
Gas Generator Industry Market Report: 2019-2033 Forecast
This comprehensive report provides an in-depth analysis of the global gas generator industry, offering valuable insights for industry professionals, investors, and strategic decision-makers. With a study period spanning 2019-2033, a base year of 2025, and a forecast period of 2025-2033, this report leverages historical data (2019-2024) to project future market trends and growth opportunities. The report covers key market segments, leading players, and emerging trends, providing a complete overview of this dynamic sector. Expected market size values are in Millions.
Gas Generator Industry Market Structure & Innovation Trends
The gas generator market exhibits a moderately concentrated structure, with several major players holding significant market share. Key companies include F G Wilson, Cooper Corporation, AKSA Power Generation, Kohler Co, Caterpillar Inc, Cummins Inc, General Electric Company, Generac Holdings Inc, MTU America Inc, Mitsubishi Heavy Industries Ltd, and others. The market share of these companies is estimated at xx Million in 2025, with a projected xx% CAGR between 2025 and 2033. Innovation is driven by increasing demand for reliable power solutions, stringent emission regulations, and advancements in gas engine technology. Regulatory frameworks, such as EPA emission standards in North America and equivalent regulations globally, significantly impact product development and market penetration. Product substitutes, primarily renewable energy sources, pose a growing competitive challenge, but gas generators still retain advantages in terms of reliability and scalability. M&A activities, including recent partnerships like Sterling Generators' collaboration with Moteurs Baudouin, are reshaping market dynamics, with deal values exceeding xx Million in recent years.
- Market Concentration: Moderately concentrated, with top players holding xx% of market share in 2025.
- Innovation Drivers: Stringent emission regulations, demand for reliable power, technological advancements.
- Regulatory Frameworks: EPA standards (North America) and equivalent global regulations.
- Product Substitutes: Renewable energy sources (solar, wind).
- M&A Activity: Significant activity in recent years, with deal values exceeding xx Million.
Gas Generator Industry Market Dynamics & Trends
The global gas generator market is experiencing robust growth, driven by rising energy demand across various sectors, particularly in developing economies. The increasing adoption of gas generators in industrial, commercial, and residential applications contributes to this upward trend. Technological advancements, such as the development of more fuel-efficient and environmentally friendly gas engines, are further stimulating market expansion. Consumer preferences are shifting toward reliable and sustainable power solutions, fueling demand for advanced gas generator technologies. The competitive landscape is marked by intense rivalry among established players and the emergence of new entrants. Market growth is projected at a CAGR of xx% during the forecast period (2025-2033), with market penetration increasing in underserved regions. Specific technological disruptions include the introduction of smart grid integration capabilities and the development of remote monitoring and control systems.
Dominant Regions & Segments in Gas Generator Industry
The North American market currently dominates the global gas generator industry, driven by robust infrastructure development, industrial growth, and strong demand from the commercial and residential sectors. However, the Asia-Pacific region is expected to witness substantial growth over the forecast period, fueled by rapid economic expansion and increasing urbanization.
- Leading Region: North America
- Key Drivers (North America): Strong infrastructure development, industrial growth, high commercial/residential demand.
- Key Drivers (Asia-Pacific): Rapid economic expansion, urbanization, rising energy demand.
- Dominant Segment (End-User): Industrial (xx Million market size in 2025) due to high power requirements.
- Dominant Segment (Power Rating): 75-375 kVA (xx Million market size in 2025), catering to a broad range of applications.
Detailed dominance analysis highlights North America's mature market with established infrastructure and regulatory frameworks. Asia-Pacific's rapid growth is driven by large-scale infrastructure projects and increasing industrialization. The Industrial segment's dominance reflects the high power requirements of factories and manufacturing plants. The 75-375 kVA segment caters to a wide range of applications, from small businesses to larger commercial facilities.
Gas Generator Industry Product Innovations
Recent product innovations focus on enhancing efficiency, reducing emissions, and improving reliability. Key trends include the incorporation of advanced control systems for optimized performance, the integration of renewable energy sources for hybrid power generation, and the development of quieter, more environmentally friendly gas engines. These advancements aim to meet evolving customer needs for sustainable and efficient power solutions, catering to diverse market segments. Cummins Inc's recent introduction of 175kW and 200kW natural gas generator sets exemplifies this trend towards higher power density and enhanced reliability.
Report Scope & Segmentation Analysis
This report comprehensively segments the gas generator market based on end-user (Industrial, Commercial, Residential) and power rating (Less than 75 kVA, 75-375 kVA, Above 375 kVA). Each segment's growth projections, market sizes, and competitive dynamics are meticulously analyzed. The Industrial segment is projected to experience significant growth driven by rising energy demands. The Commercial segment's expansion reflects the increasing need for backup power across various business sectors. The Residential segment showcases steady growth with rising adoption among homeowners and in remote areas. The power rating segment analysis shows the largest share held by the 75-375 kVA range due to its applicability to a wider range of applications.
Key Drivers of Gas Generator Industry Growth
Several factors propel the growth of the gas generator industry. Rising energy demand across various sectors, particularly in developing nations, is a primary driver. The need for reliable backup power in critical applications, like hospitals and data centers, also contributes significantly. Government initiatives promoting energy security and the development of robust power infrastructure further stimulate market expansion. Advancements in gas engine technology, leading to increased efficiency and reduced emissions, also contribute positively.
Challenges in the Gas Generator Industry Sector
The gas generator industry faces challenges including stringent emission regulations that increase manufacturing costs, fluctuations in raw material prices impacting profitability, and intense competition among established players and new entrants. The growing popularity of renewable energy sources and associated government incentives pose a significant threat. These factors result in a dynamic and competitive market landscape. Supply chain disruptions can lead to production delays and increased costs.
Emerging Opportunities in Gas Generator Industry
Emerging opportunities include the increasing demand for hybrid power systems that combine gas generators with renewable energy sources, providing a more sustainable and cost-effective power solution. The expansion into underserved markets in developing countries presents significant growth potential. Advancements in smart grid integration and the development of remote monitoring and control systems for gas generators open new avenues for innovation and efficiency gains.
Leading Players in the Gas Generator Industry Market
- F G Wilson
- Cooper Corporation
- AKSA Power Generation
- Kohler Co
- Caterpillar Inc
- Cummins Inc
- General Electric Company
- Generac Holdings Inc
- MTU America Inc
- Mitsubishi Heavy Industries Ltd
Key Developments in Gas Generator Industry
- February 2023: Cummins Inc. announced the addition of 175kW and 200kW natural gas standby generator sets, enhancing their sustainable technology portfolio and market competitiveness.
- July 2022: Sterling Generators formed a strategic partnership with Moteurs Baudouin, strengthening their product offerings and market reach.
- January 2022: Caterpillar Inc. unveiled the Cat G3516 Fast Reaction generator set, expanding its natural-gas power solutions for mission-critical applications.
Future Outlook for Gas Generator Industry Market
The gas generator market is poised for continued growth, driven by increasing energy demand, infrastructure development, and technological advancements. Strategic opportunities lie in developing innovative hybrid power solutions, expanding into emerging markets, and focusing on sustainable and environmentally friendly technologies. The industry's future success hinges on adapting to evolving regulatory landscapes and meeting the growing demand for reliable and efficient power solutions.
Gas Generator Industry Segmentation
-
1. Power Rating
- 1.1. Less than 75 kVA
- 1.2. 75-375 kVA
- 1.3. Above 375 kVA
-
2. End-User
- 2.1. Industrial
- 2.2. Commercial
- 2.3. Residential
Gas Generator Industry Segmentation By Geography
-
1. North America
- 1.1. United States
- 1.2. Canada
- 1.3. Rest of North America
-
2. Europe
- 2.1. Germany
- 2.2. France
- 2.3. United Kingdom
- 2.4. Rest of Europe
-
3. Asia Pacific
- 3.1. China
- 3.2. India
- 3.3. Japan
- 3.4. South Korea
- 3.5. Rest of Asia Pacific
-
4. South America
- 4.1. Brazil
- 4.2. Argentina
- 4.3. Rest of South America
-
5. Middle East and Africa
- 5.1. Saudi Arabia
- 5.2. United Arab Emirates
- 5.3. South Africa
- 5.4. Rest of Middle East and Africa
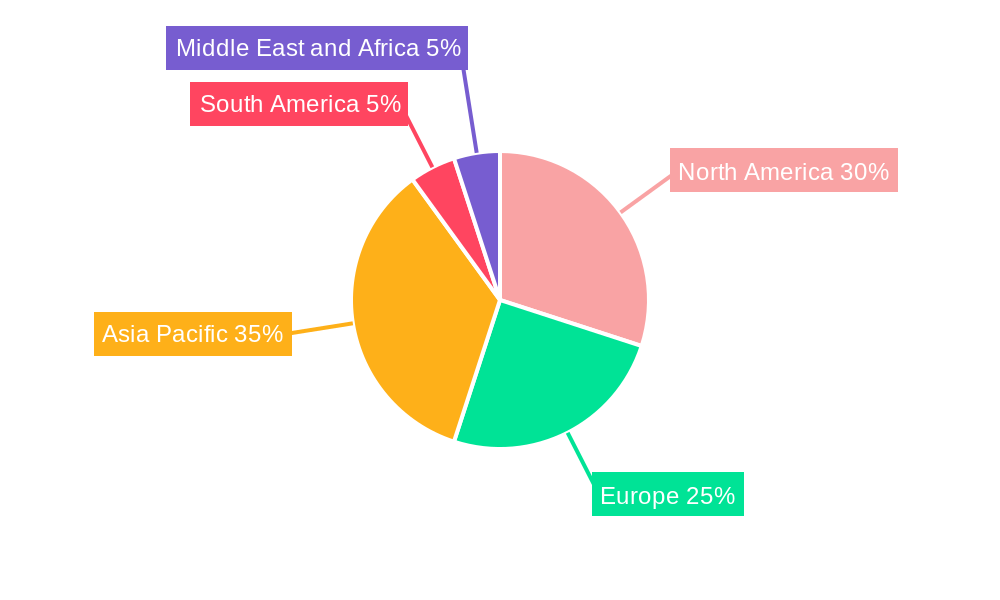
Gas Generator Industry Regional Market Share
Geographic Coverage of Gas Generator Industry
Gas Generator Industry REPORT HIGHLIGHTS
| Aspects | Details |
|---|---|
| Study Period | 2020-2034 |
| Base Year | 2025 |
| Estimated Year | 2026 |
| Forecast Period | 2026-2034 |
| Historical Period | 2020-2025 |
| Growth Rate | CAGR of 4.1% from 2020-2034 |
| Segmentation |
|
Table of Contents
- 1. Introduction
- 1.1. Research Scope
- 1.2. Market Segmentation
- 1.3. Research Objective
- 1.4. Definitions and Assumptions
- 2. Executive Summary
- 2.1. Market Snapshot
- 3. Market Dynamics
- 3.1. Market Drivers
- 3.2. Market Restrains
- 3.3. Market Trends
- 3.4. Market Opportunities
- 4. Market Factor Analysis
- 4.1. Porters Five Forces
- 4.1.1. Bargaining Power of Suppliers
- 4.1.2. Bargaining Power of Buyers
- 4.1.3. Threat of New Entrants
- 4.1.4. Threat of Substitutes
- 4.1.5. Competitive Rivalry
- 4.2. PESTEL analysis
- 4.3. BCG Analysis
- 4.3.1. Stars (High Growth, High Market Share)
- 4.3.2. Cash Cows (Low Growth, High Market Share)
- 4.3.3. Question Mark (High Growth, Low Market Share)
- 4.3.4. Dogs (Low Growth, Low Market Share)
- 4.4. Ansoff Matrix Analysis
- 4.5. Supply Chain Analysis
- 4.6. Regulatory Landscape
- 4.7. Current Market Potential and Opportunity Assessment (TAM–SAM–SOM Framework)
- 4.8. PRI Analyst Note
- 4.1. Porters Five Forces
- 5. Market Analysis, Insights and Forecast 2021-2033
- 5.1. Market Analysis, Insights and Forecast - by Power Rating
- 5.1.1. Less than 75 kVA
- 5.1.2. 75-375 kVA
- 5.1.3. Above 375 kVA
- 5.2. Market Analysis, Insights and Forecast - by End-User
- 5.2.1. Industrial
- 5.2.2. Commercial
- 5.2.3. Residential
- 5.3. Market Analysis, Insights and Forecast - by Region
- 5.3.1. North America
- 5.3.2. Europe
- 5.3.3. Asia Pacific
- 5.3.4. South America
- 5.3.5. Middle East and Africa
- 5.1. Market Analysis, Insights and Forecast - by Power Rating
- 6. Global Gas Generator Industry Analysis, Insights and Forecast, 2021-2033
- 6.1. Market Analysis, Insights and Forecast - by Power Rating
- 6.1.1. Less than 75 kVA
- 6.1.2. 75-375 kVA
- 6.1.3. Above 375 kVA
- 6.2. Market Analysis, Insights and Forecast - by End-User
- 6.2.1. Industrial
- 6.2.2. Commercial
- 6.2.3. Residential
- 6.1. Market Analysis, Insights and Forecast - by Power Rating
- 7. North America Gas Generator Industry Analysis, Insights and Forecast, 2020-2032
- 7.1. Market Analysis, Insights and Forecast - by Power Rating
- 7.1.1. Less than 75 kVA
- 7.1.2. 75-375 kVA
- 7.1.3. Above 375 kVA
- 7.2. Market Analysis, Insights and Forecast - by End-User
- 7.2.1. Industrial
- 7.2.2. Commercial
- 7.2.3. Residential
- 7.1. Market Analysis, Insights and Forecast - by Power Rating
- 8. Europe Gas Generator Industry Analysis, Insights and Forecast, 2020-2032
- 8.1. Market Analysis, Insights and Forecast - by Power Rating
- 8.1.1. Less than 75 kVA
- 8.1.2. 75-375 kVA
- 8.1.3. Above 375 kVA
- 8.2. Market Analysis, Insights and Forecast - by End-User
- 8.2.1. Industrial
- 8.2.2. Commercial
- 8.2.3. Residential
- 8.1. Market Analysis, Insights and Forecast - by Power Rating
- 9. Asia Pacific Gas Generator Industry Analysis, Insights and Forecast, 2020-2032
- 9.1. Market Analysis, Insights and Forecast - by Power Rating
- 9.1.1. Less than 75 kVA
- 9.1.2. 75-375 kVA
- 9.1.3. Above 375 kVA
- 9.2. Market Analysis, Insights and Forecast - by End-User
- 9.2.1. Industrial
- 9.2.2. Commercial
- 9.2.3. Residential
- 9.1. Market Analysis, Insights and Forecast - by Power Rating
- 10. South America Gas Generator Industry Analysis, Insights and Forecast, 2020-2032
- 10.1. Market Analysis, Insights and Forecast - by Power Rating
- 10.1.1. Less than 75 kVA
- 10.1.2. 75-375 kVA
- 10.1.3. Above 375 kVA
- 10.2. Market Analysis, Insights and Forecast - by End-User
- 10.2.1. Industrial
- 10.2.2. Commercial
- 10.2.3. Residential
- 10.1. Market Analysis, Insights and Forecast - by Power Rating
- 11. Middle East and Africa Gas Generator Industry Analysis, Insights and Forecast, 2020-2032
- 11.1. Market Analysis, Insights and Forecast - by Power Rating
- 11.1.1. Less than 75 kVA
- 11.1.2. 75-375 kVA
- 11.1.3. Above 375 kVA
- 11.2. Market Analysis, Insights and Forecast - by End-User
- 11.2.1. Industrial
- 11.2.2. Commercial
- 11.2.3. Residential
- 11.1. Market Analysis, Insights and Forecast - by Power Rating
- 12. Competitive Analysis
- 12.1. Company Profiles
- 12.1.1 F G Wilson
- 12.1.1.1. Company Overview
- 12.1.1.2. Products
- 12.1.1.3. Company Financials
- 12.1.1.4. SWOT Analysis
- 12.1.2 Cooper Corporation
- 12.1.2.1. Company Overview
- 12.1.2.2. Products
- 12.1.2.3. Company Financials
- 12.1.2.4. SWOT Analysis
- 12.1.3 AKSA Power Generation
- 12.1.3.1. Company Overview
- 12.1.3.2. Products
- 12.1.3.3. Company Financials
- 12.1.3.4. SWOT Analysis
- 12.1.4 Kohler Co
- 12.1.4.1. Company Overview
- 12.1.4.2. Products
- 12.1.4.3. Company Financials
- 12.1.4.4. SWOT Analysis
- 12.1.5 Caterpillar Inc
- 12.1.5.1. Company Overview
- 12.1.5.2. Products
- 12.1.5.3. Company Financials
- 12.1.5.4. SWOT Analysis
- 12.1.6 Cummins Inc
- 12.1.6.1. Company Overview
- 12.1.6.2. Products
- 12.1.6.3. Company Financials
- 12.1.6.4. SWOT Analysis
- 12.1.7 General Electric Company
- 12.1.7.1. Company Overview
- 12.1.7.2. Products
- 12.1.7.3. Company Financials
- 12.1.7.4. SWOT Analysis
- 12.1.8 Generac Holdings Inc
- 12.1.8.1. Company Overview
- 12.1.8.2. Products
- 12.1.8.3. Company Financials
- 12.1.8.4. SWOT Analysis
- 12.1.9 MTU America Inc *List Not Exhaustive
- 12.1.9.1. Company Overview
- 12.1.9.2. Products
- 12.1.9.3. Company Financials
- 12.1.9.4. SWOT Analysis
- 12.1.10 Mitsubishi Heavy Industries Ltd
- 12.1.10.1. Company Overview
- 12.1.10.2. Products
- 12.1.10.3. Company Financials
- 12.1.10.4. SWOT Analysis
- 12.1.1 F G Wilson
- 12.2. Market Entropy
- 12.2.1 Company's Key Areas Served
- 12.2.2 Recent Developments
- 12.3. Company Market Share Analysis 2025
- 12.3.1 Top 5 Companies Market Share Analysis
- 12.3.2 Top 3 Companies Market Share Analysis
- 12.4. List of Potential Customers
- 13. Research Methodology
List of Figures
- Figure 1: Global Gas Generator Industry Revenue Breakdown (billion, %) by Region 2025 & 2033
- Figure 2: Global Gas Generator Industry Volume Breakdown (K Unit, %) by Region 2025 & 2033
- Figure 3: North America Gas Generator Industry Revenue (billion), by Power Rating 2025 & 2033
- Figure 4: North America Gas Generator Industry Volume (K Unit), by Power Rating 2025 & 2033
- Figure 5: North America Gas Generator Industry Revenue Share (%), by Power Rating 2025 & 2033
- Figure 6: North America Gas Generator Industry Volume Share (%), by Power Rating 2025 & 2033
- Figure 7: North America Gas Generator Industry Revenue (billion), by End-User 2025 & 2033
- Figure 8: North America Gas Generator Industry Volume (K Unit), by End-User 2025 & 2033
- Figure 9: North America Gas Generator Industry Revenue Share (%), by End-User 2025 & 2033
- Figure 10: North America Gas Generator Industry Volume Share (%), by End-User 2025 & 2033
- Figure 11: North America Gas Generator Industry Revenue (billion), by Country 2025 & 2033
- Figure 12: North America Gas Generator Industry Volume (K Unit), by Country 2025 & 2033
- Figure 13: North America Gas Generator Industry Revenue Share (%), by Country 2025 & 2033
- Figure 14: North America Gas Generator Industry Volume Share (%), by Country 2025 & 2033
- Figure 15: Europe Gas Generator Industry Revenue (billion), by Power Rating 2025 & 2033
- Figure 16: Europe Gas Generator Industry Volume (K Unit), by Power Rating 2025 & 2033
- Figure 17: Europe Gas Generator Industry Revenue Share (%), by Power Rating 2025 & 2033
- Figure 18: Europe Gas Generator Industry Volume Share (%), by Power Rating 2025 & 2033
- Figure 19: Europe Gas Generator Industry Revenue (billion), by End-User 2025 & 2033
- Figure 20: Europe Gas Generator Industry Volume (K Unit), by End-User 2025 & 2033
- Figure 21: Europe Gas Generator Industry Revenue Share (%), by End-User 2025 & 2033
- Figure 22: Europe Gas Generator Industry Volume Share (%), by End-User 2025 & 2033
- Figure 23: Europe Gas Generator Industry Revenue (billion), by Country 2025 & 2033
- Figure 24: Europe Gas Generator Industry Volume (K Unit), by Country 2025 & 2033
- Figure 25: Europe Gas Generator Industry Revenue Share (%), by Country 2025 & 2033
- Figure 26: Europe Gas Generator Industry Volume Share (%), by Country 2025 & 2033
- Figure 27: Asia Pacific Gas Generator Industry Revenue (billion), by Power Rating 2025 & 2033
- Figure 28: Asia Pacific Gas Generator Industry Volume (K Unit), by Power Rating 2025 & 2033
- Figure 29: Asia Pacific Gas Generator Industry Revenue Share (%), by Power Rating 2025 & 2033
- Figure 30: Asia Pacific Gas Generator Industry Volume Share (%), by Power Rating 2025 & 2033
- Figure 31: Asia Pacific Gas Generator Industry Revenue (billion), by End-User 2025 & 2033
- Figure 32: Asia Pacific Gas Generator Industry Volume (K Unit), by End-User 2025 & 2033
- Figure 33: Asia Pacific Gas Generator Industry Revenue Share (%), by End-User 2025 & 2033
- Figure 34: Asia Pacific Gas Generator Industry Volume Share (%), by End-User 2025 & 2033
- Figure 35: Asia Pacific Gas Generator Industry Revenue (billion), by Country 2025 & 2033
- Figure 36: Asia Pacific Gas Generator Industry Volume (K Unit), by Country 2025 & 2033
- Figure 37: Asia Pacific Gas Generator Industry Revenue Share (%), by Country 2025 & 2033
- Figure 38: Asia Pacific Gas Generator Industry Volume Share (%), by Country 2025 & 2033
- Figure 39: South America Gas Generator Industry Revenue (billion), by Power Rating 2025 & 2033
- Figure 40: South America Gas Generator Industry Volume (K Unit), by Power Rating 2025 & 2033
- Figure 41: South America Gas Generator Industry Revenue Share (%), by Power Rating 2025 & 2033
- Figure 42: South America Gas Generator Industry Volume Share (%), by Power Rating 2025 & 2033
- Figure 43: South America Gas Generator Industry Revenue (billion), by End-User 2025 & 2033
- Figure 44: South America Gas Generator Industry Volume (K Unit), by End-User 2025 & 2033
- Figure 45: South America Gas Generator Industry Revenue Share (%), by End-User 2025 & 2033
- Figure 46: South America Gas Generator Industry Volume Share (%), by End-User 2025 & 2033
- Figure 47: South America Gas Generator Industry Revenue (billion), by Country 2025 & 2033
- Figure 48: South America Gas Generator Industry Volume (K Unit), by Country 2025 & 2033
- Figure 49: South America Gas Generator Industry Revenue Share (%), by Country 2025 & 2033
- Figure 50: South America Gas Generator Industry Volume Share (%), by Country 2025 & 2033
- Figure 51: Middle East and Africa Gas Generator Industry Revenue (billion), by Power Rating 2025 & 2033
- Figure 52: Middle East and Africa Gas Generator Industry Volume (K Unit), by Power Rating 2025 & 2033
- Figure 53: Middle East and Africa Gas Generator Industry Revenue Share (%), by Power Rating 2025 & 2033
- Figure 54: Middle East and Africa Gas Generator Industry Volume Share (%), by Power Rating 2025 & 2033
- Figure 55: Middle East and Africa Gas Generator Industry Revenue (billion), by End-User 2025 & 2033
- Figure 56: Middle East and Africa Gas Generator Industry Volume (K Unit), by End-User 2025 & 2033
- Figure 57: Middle East and Africa Gas Generator Industry Revenue Share (%), by End-User 2025 & 2033
- Figure 58: Middle East and Africa Gas Generator Industry Volume Share (%), by End-User 2025 & 2033
- Figure 59: Middle East and Africa Gas Generator Industry Revenue (billion), by Country 2025 & 2033
- Figure 60: Middle East and Africa Gas Generator Industry Volume (K Unit), by Country 2025 & 2033
- Figure 61: Middle East and Africa Gas Generator Industry Revenue Share (%), by Country 2025 & 2033
- Figure 62: Middle East and Africa Gas Generator Industry Volume Share (%), by Country 2025 & 2033
List of Tables
- Table 1: Global Gas Generator Industry Revenue billion Forecast, by Power Rating 2020 & 2033
- Table 2: Global Gas Generator Industry Volume K Unit Forecast, by Power Rating 2020 & 2033
- Table 3: Global Gas Generator Industry Revenue billion Forecast, by End-User 2020 & 2033
- Table 4: Global Gas Generator Industry Volume K Unit Forecast, by End-User 2020 & 2033
- Table 5: Global Gas Generator Industry Revenue billion Forecast, by Region 2020 & 2033
- Table 6: Global Gas Generator Industry Volume K Unit Forecast, by Region 2020 & 2033
- Table 7: Global Gas Generator Industry Revenue billion Forecast, by Power Rating 2020 & 2033
- Table 8: Global Gas Generator Industry Volume K Unit Forecast, by Power Rating 2020 & 2033
- Table 9: Global Gas Generator Industry Revenue billion Forecast, by End-User 2020 & 2033
- Table 10: Global Gas Generator Industry Volume K Unit Forecast, by End-User 2020 & 2033
- Table 11: Global Gas Generator Industry Revenue billion Forecast, by Country 2020 & 2033
- Table 12: Global Gas Generator Industry Volume K Unit Forecast, by Country 2020 & 2033
- Table 13: United States Gas Generator Industry Revenue (billion) Forecast, by Application 2020 & 2033
- Table 14: United States Gas Generator Industry Volume (K Unit) Forecast, by Application 2020 & 2033
- Table 15: Canada Gas Generator Industry Revenue (billion) Forecast, by Application 2020 & 2033
- Table 16: Canada Gas Generator Industry Volume (K Unit) Forecast, by Application 2020 & 2033
- Table 17: Rest of North America Gas Generator Industry Revenue (billion) Forecast, by Application 2020 & 2033
- Table 18: Rest of North America Gas Generator Industry Volume (K Unit) Forecast, by Application 2020 & 2033
- Table 19: Global Gas Generator Industry Revenue billion Forecast, by Power Rating 2020 & 2033
- Table 20: Global Gas Generator Industry Volume K Unit Forecast, by Power Rating 2020 & 2033
- Table 21: Global Gas Generator Industry Revenue billion Forecast, by End-User 2020 & 2033
- Table 22: Global Gas Generator Industry Volume K Unit Forecast, by End-User 2020 & 2033
- Table 23: Global Gas Generator Industry Revenue billion Forecast, by Country 2020 & 2033
- Table 24: Global Gas Generator Industry Volume K Unit Forecast, by Country 2020 & 2033
- Table 25: Germany Gas Generator Industry Revenue (billion) Forecast, by Application 2020 & 2033
- Table 26: Germany Gas Generator Industry Volume (K Unit) Forecast, by Application 2020 & 2033
- Table 27: France Gas Generator Industry Revenue (billion) Forecast, by Application 2020 & 2033
- Table 28: France Gas Generator Industry Volume (K Unit) Forecast, by Application 2020 & 2033
- Table 29: United Kingdom Gas Generator Industry Revenue (billion) Forecast, by Application 2020 & 2033
- Table 30: United Kingdom Gas Generator Industry Volume (K Unit) Forecast, by Application 2020 & 2033
- Table 31: Rest of Europe Gas Generator Industry Revenue (billion) Forecast, by Application 2020 & 2033
- Table 32: Rest of Europe Gas Generator Industry Volume (K Unit) Forecast, by Application 2020 & 2033
- Table 33: Global Gas Generator Industry Revenue billion Forecast, by Power Rating 2020 & 2033
- Table 34: Global Gas Generator Industry Volume K Unit Forecast, by Power Rating 2020 & 2033
- Table 35: Global Gas Generator Industry Revenue billion Forecast, by End-User 2020 & 2033
- Table 36: Global Gas Generator Industry Volume K Unit Forecast, by End-User 2020 & 2033
- Table 37: Global Gas Generator Industry Revenue billion Forecast, by Country 2020 & 2033
- Table 38: Global Gas Generator Industry Volume K Unit Forecast, by Country 2020 & 2033
- Table 39: China Gas Generator Industry Revenue (billion) Forecast, by Application 2020 & 2033
- Table 40: China Gas Generator Industry Volume (K Unit) Forecast, by Application 2020 & 2033
- Table 41: India Gas Generator Industry Revenue (billion) Forecast, by Application 2020 & 2033
- Table 42: India Gas Generator Industry Volume (K Unit) Forecast, by Application 2020 & 2033
- Table 43: Japan Gas Generator Industry Revenue (billion) Forecast, by Application 2020 & 2033
- Table 44: Japan Gas Generator Industry Volume (K Unit) Forecast, by Application 2020 & 2033
- Table 45: South Korea Gas Generator Industry Revenue (billion) Forecast, by Application 2020 & 2033
- Table 46: South Korea Gas Generator Industry Volume (K Unit) Forecast, by Application 2020 & 2033
- Table 47: Rest of Asia Pacific Gas Generator Industry Revenue (billion) Forecast, by Application 2020 & 2033
- Table 48: Rest of Asia Pacific Gas Generator Industry Volume (K Unit) Forecast, by Application 2020 & 2033
- Table 49: Global Gas Generator Industry Revenue billion Forecast, by Power Rating 2020 & 2033
- Table 50: Global Gas Generator Industry Volume K Unit Forecast, by Power Rating 2020 & 2033
- Table 51: Global Gas Generator Industry Revenue billion Forecast, by End-User 2020 & 2033
- Table 52: Global Gas Generator Industry Volume K Unit Forecast, by End-User 2020 & 2033
- Table 53: Global Gas Generator Industry Revenue billion Forecast, by Country 2020 & 2033
- Table 54: Global Gas Generator Industry Volume K Unit Forecast, by Country 2020 & 2033
- Table 55: Brazil Gas Generator Industry Revenue (billion) Forecast, by Application 2020 & 2033
- Table 56: Brazil Gas Generator Industry Volume (K Unit) Forecast, by Application 2020 & 2033
- Table 57: Argentina Gas Generator Industry Revenue (billion) Forecast, by Application 2020 & 2033
- Table 58: Argentina Gas Generator Industry Volume (K Unit) Forecast, by Application 2020 & 2033
- Table 59: Rest of South America Gas Generator Industry Revenue (billion) Forecast, by Application 2020 & 2033
- Table 60: Rest of South America Gas Generator Industry Volume (K Unit) Forecast, by Application 2020 & 2033
- Table 61: Global Gas Generator Industry Revenue billion Forecast, by Power Rating 2020 & 2033
- Table 62: Global Gas Generator Industry Volume K Unit Forecast, by Power Rating 2020 & 2033
- Table 63: Global Gas Generator Industry Revenue billion Forecast, by End-User 2020 & 2033
- Table 64: Global Gas Generator Industry Volume K Unit Forecast, by End-User 2020 & 2033
- Table 65: Global Gas Generator Industry Revenue billion Forecast, by Country 2020 & 2033
- Table 66: Global Gas Generator Industry Volume K Unit Forecast, by Country 2020 & 2033
- Table 67: Saudi Arabia Gas Generator Industry Revenue (billion) Forecast, by Application 2020 & 2033
- Table 68: Saudi Arabia Gas Generator Industry Volume (K Unit) Forecast, by Application 2020 & 2033
- Table 69: United Arab Emirates Gas Generator Industry Revenue (billion) Forecast, by Application 2020 & 2033
- Table 70: United Arab Emirates Gas Generator Industry Volume (K Unit) Forecast, by Application 2020 & 2033
- Table 71: South Africa Gas Generator Industry Revenue (billion) Forecast, by Application 2020 & 2033
- Table 72: South Africa Gas Generator Industry Volume (K Unit) Forecast, by Application 2020 & 2033
- Table 73: Rest of Middle East and Africa Gas Generator Industry Revenue (billion) Forecast, by Application 2020 & 2033
- Table 74: Rest of Middle East and Africa Gas Generator Industry Volume (K Unit) Forecast, by Application 2020 & 2033
Frequently Asked Questions
1. What is the projected Compound Annual Growth Rate (CAGR) of the Gas Generator Industry?
The projected CAGR is approximately 4.1%.
2. Which companies are prominent players in the Gas Generator Industry?
Key companies in the market include F G Wilson, Cooper Corporation, AKSA Power Generation, Kohler Co, Caterpillar Inc, Cummins Inc, General Electric Company, Generac Holdings Inc, MTU America Inc *List Not Exhaustive, Mitsubishi Heavy Industries Ltd.
3. What are the main segments of the Gas Generator Industry?
The market segments include Power Rating, End-User.
4. Can you provide details about the market size?
The market size is estimated to be USD 28.5 billion as of 2022.
5. What are some drivers contributing to market growth?
Increasing Awareness Regarding Natural Gas as a Clean and Reliable Fuel4.; Increasing Concerns Over Diesel Maintenance and Refueling Issues.
6. What are the notable trends driving market growth?
Below 75 kVA Capacity Rating to Dominate the Market.
7. Are there any restraints impacting market growth?
Lack of Gas Grid Connectivity Via Pipeline. Resulting in Hindered Fuel Supply.
8. Can you provide examples of recent developments in the market?
February 2023: Cummins Inc. announced adding 175kW and 200kW natural gas standby generator sets for North American customers. These two new generator sets are a part of Cummins's continual investment in new and sustainable technologies as part of Destination Zero, the company's strategy to reach zero emissions across its products. The new 175kW and 200kW natural gas generator sets offer customers industry-leading power density and are engineered to provide exceptional performance and consistent reliability to meet customers' power requirements.
9. What pricing options are available for accessing the report?
Pricing options include single-user, multi-user, and enterprise licenses priced at USD 4750, USD 5250, and USD 8750 respectively.
10. Is the market size provided in terms of value or volume?
The market size is provided in terms of value, measured in billion and volume, measured in K Unit.
11. Are there any specific market keywords associated with the report?
Yes, the market keyword associated with the report is "Gas Generator Industry," which aids in identifying and referencing the specific market segment covered.
12. How do I determine which pricing option suits my needs best?
The pricing options vary based on user requirements and access needs. Individual users may opt for single-user licenses, while businesses requiring broader access may choose multi-user or enterprise licenses for cost-effective access to the report.
13. Are there any additional resources or data provided in the Gas Generator Industry report?
While the report offers comprehensive insights, it's advisable to review the specific contents or supplementary materials provided to ascertain if additional resources or data are available.
14. How can I stay updated on further developments or reports in the Gas Generator Industry?
To stay informed about further developments, trends, and reports in the Gas Generator Industry, consider subscribing to industry newsletters, following relevant companies and organizations, or regularly checking reputable industry news sources and publications.
Methodology
Step 1 - Identification of Relevant Samples Size from Population Database


Step 2 - Approaches for Defining Global Market Size (Value, Volume* & Price*)

Note*: In applicable scenarios
Step 3 - Data Sources
Primary Research
- Web Analytics
- Survey Reports
- Research Institute
- Latest Research Reports
- Opinion Leaders
Secondary Research
- Annual Reports
- White Paper
- Latest Press Release
- Industry Association
- Paid Database
- Investor Presentations

Step 4 - Data Triangulation
Involves using different sources of information in order to increase the validity of a study
These sources are likely to be stakeholders in a program - participants, other researchers, program staff, other community members, and so on.
Then we put all data in single framework & apply various statistical tools to find out the dynamic on the market.
During the analysis stage, feedback from the stakeholder groups would be compared to determine areas of agreement as well as areas of divergence