

Key Insights
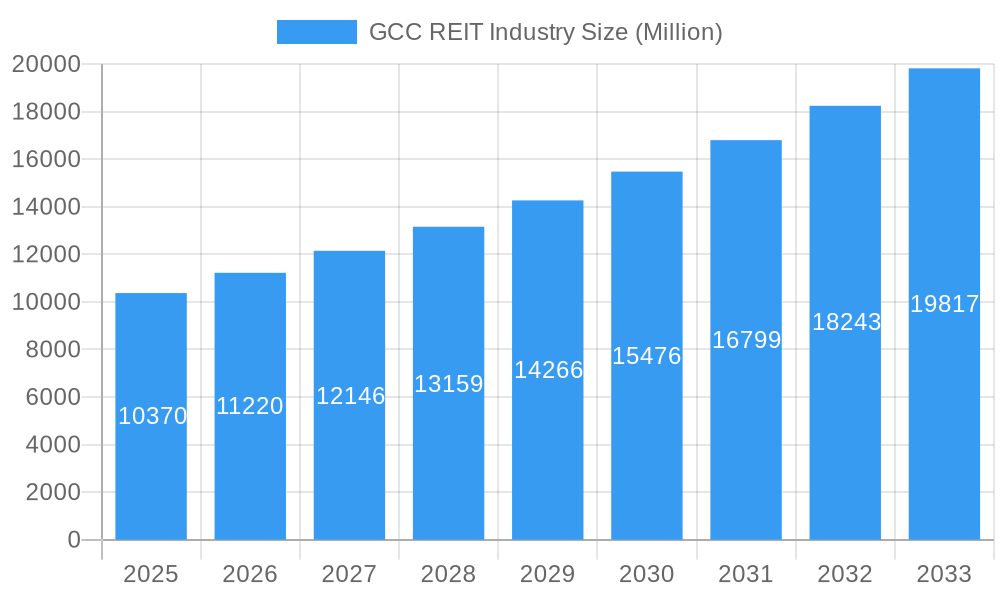
The GCC REIT (Real Estate Investment Trust) industry, valued at $10.37 billion in 2025, is poised for significant growth, driven by robust economic expansion, increasing urbanization, and supportive government initiatives promoting real estate investment. A compound annual growth rate (CAGR) of 8.24% is projected from 2025 to 2033, indicating a substantial market expansion. Key growth drivers include the diversification of the GCC economies beyond oil, attracting foreign investment into the region's burgeoning real estate sector, and the rising demand for modern, high-quality commercial and residential spaces. The increasing preference for REITs as a stable and income-generating investment vehicle further fuels this expansion. Specific segments like commercial and residential REITs are expected to lead the growth, fueled by robust demand in key cities like Dubai, Abu Dhabi, and Riyadh.
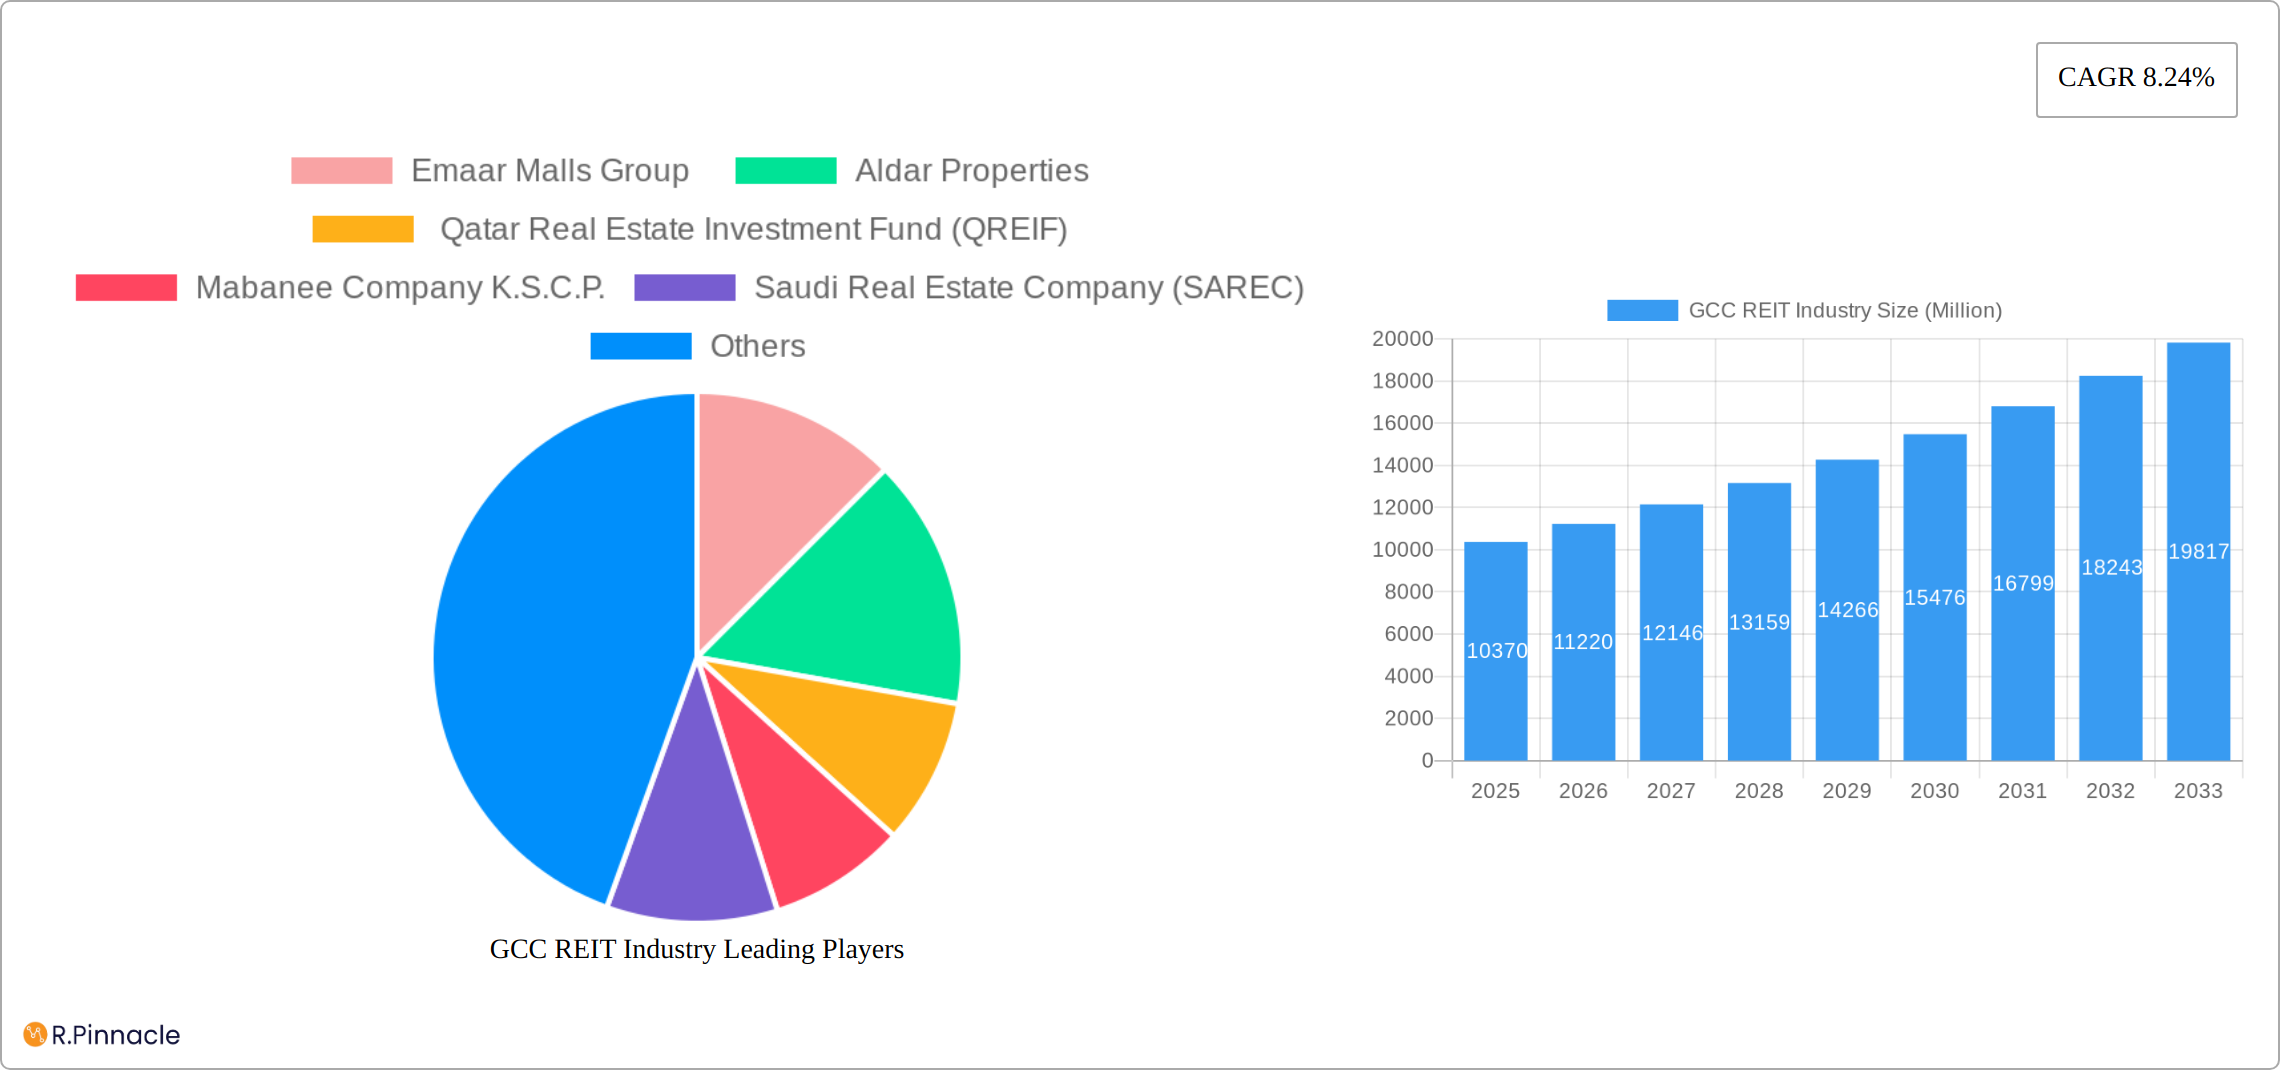
GCC REIT Industry Market Size (In Billion)
However, the market faces certain challenges. Potential restraints include macroeconomic uncertainties impacting investor sentiment, fluctuating oil prices that affect overall economic stability, and competition from other asset classes. Nevertheless, the long-term outlook remains positive, driven by sustained population growth, tourism influx, and ongoing infrastructure development across the GCC. The dominance of Equity REITs over Mortgage REITs is anticipated to continue, reflecting investor preference for direct ownership in real estate assets. Successful companies such as Emaar Malls Group and Aldar Properties will likely continue to shape the market landscape, alongside emerging players capitalizing on the growth potential. Strategic acquisitions, joint ventures, and expansion into new markets will likely characterize the industry’s competitive dynamics.
GCC REIT Industry Company Market Share
GCC REIT Industry: A Comprehensive Market Report (2019-2033)
This in-depth report provides a comprehensive analysis of the GCC REIT industry, offering invaluable insights for investors, industry professionals, and strategic decision-makers. Covering the period from 2019 to 2033, with a base year of 2025, this report forecasts market trends and identifies key opportunities within this rapidly evolving sector. The report leverages extensive data analysis to provide actionable intelligence on market structure, dynamics, leading players, and future prospects.
GCC REIT Industry Market Structure & Innovation Trends
This section analyzes the competitive landscape of the GCC REIT market, examining market concentration, innovation drivers, regulatory frameworks, and M&A activities. The report assesses the market share of key players like Emaar Malls Group, Aldar Properties, and others, quantifying their influence on market dynamics.
- Market Concentration: The GCC REIT market exhibits a [xx]% concentration ratio in 2025, indicating [high/medium/low] market fragmentation. This is expected to [increase/decrease] to [xx]% by 2033.
- Innovation Drivers: Technological advancements in property management, growing adoption of fintech solutions for REIT transactions, and evolving investor preferences drive innovation.
- Regulatory Frameworks: The introduction of the Saudi Arabian REIT regime in September 2022 significantly impacted market growth and investment. Variations in regulations across GCC countries influence market dynamics.
- M&A Activity: The report analyzes completed and projected M&A deals, including deal values (in Millions), highlighting key transactions and their implications for market consolidation. For example, the [xx] Million acquisition of [Company A] by [Company B] in [Year] significantly altered the market landscape. The total M&A deal value in 2024 was estimated at xx Million.
GCC REIT Industry Market Dynamics & Trends
The GCC REIT industry is experiencing robust growth, driven by a confluence of factors shaping its market dynamics and future trajectory. This section analyzes key drivers, emerging trends, and competitive landscapes, projecting a Compound Annual Growth Rate (CAGR) of [Insert Precise CAGR]% for the forecast period (2025-2033), based on a comprehensive methodology incorporating historical data, expert interviews, and market trend analysis. This projection accounts for both macroeconomic factors and specific industry developments.
- Market Growth Drivers: Increased foreign direct investment (FDI), particularly from global institutional investors seeking diversified portfolios, is a significant catalyst. Government initiatives promoting REITs, including favorable tax regulations and streamlined investment processes, further stimulate market expansion. The burgeoning middle class and rapid urbanization within the GCC region fuel strong demand for residential and commercial properties, creating a robust pipeline for REIT investment opportunities. Furthermore, the increasing adoption of Environmental, Social, and Governance (ESG) investing criteria is driving demand for REITs demonstrating strong sustainability practices.
- Technological Disruptions: Proptech innovations are revolutionizing property management, tenant engagement, and investment analysis. The integration of Artificial Intelligence (AI) and Big Data analytics enables predictive modeling, optimizing portfolio management, and enhancing risk assessment, thereby attracting tech-savvy investors and increasing market efficiency.
- Evolving Investor Preferences: Investors are increasingly seeking higher yields, diversified portfolios across asset classes, and robust ESG performance from their REIT investments. This preference is reflected in the growing demand for specific property types, such as residential, healthcare, and logistics REITs, with regional variations based on local market dynamics.
- Competitive Landscape: The GCC REIT market is characterized by [Insert Description of Competitive Intensity, e.g., a dynamic competitive landscape] with a mix of established players and emerging market entrants. Competitive strategies encompass mergers and acquisitions (M&A) activity, expansion into new geographic markets and property sectors, and the development of innovative product offerings to cater to diverse investor needs. For instance, the market penetration for Commercial REITs in 2025 is projected at [Insert Precise Percentage]%. Increased competition is expected to drive innovation and efficiency within the sector.
Dominant Regions & Segments in GCC REIT Industry
This section details the leading regions and segments within the GCC REIT market, providing a granular analysis of their performance, underlying growth drivers, and future prospects. The analysis considers various factors, including market size, growth rates, and the overall attractiveness of investment opportunities.
Dominant Region: [Country Name] currently holds the leading position, driven by [mention key factors with supporting data, e.g., robust economic growth averaging X% annually, supportive government policies such as [Specific Policy Example], and significant infrastructure development projects totaling [Value] in investment].
Dominant Segment (By Property Type): [Commercial/Residential/Industrial/Healthcare/Hospitality REITs] currently dominates the market due to [mention specific reasons with data to support the claim, e.g., high occupancy rates averaging X%, stable rental income streams yielding an average of Y%, and strong future demand projections based on [Source of Data]].
Dominant Segment (By Investment Type): [Equity/Mortgage REITs] hold a significant market share because of [mention factors with data, e.g., higher liquidity with average trading volume of Z, lower risk profiles reflected in credit ratings of AA, and government support through [Specific Government Programs]].
Key Growth Catalysts:
- Pro-Growth Economic Policies: Government incentives, tax benefits, and streamlined regulations continue to attract significant investment into the REIT sector, fostering sustainable growth.
- Strategic Infrastructure Development: Ongoing expansion of transportation networks, utilities, and communication systems provides a strong foundation for REIT growth, enhancing property values and attracting tenants.
- Tourism and Hospitality Expansion: The growth of the tourism sector, particularly in [Specific Regions], fuels increased demand for hospitality REITs, driving investment and expansion in this segment.
GCC REIT Industry Product Innovations
The GCC REIT market is witnessing a wave of product innovation, driven by technological advancements and the evolving needs of sophisticated investors. New products are emerging, including specialized REITs focused on high-growth asset classes such as data centers, renewable energy infrastructure, and logistics facilities. The increased utilization of technology enhances portfolio transparency, risk management, and operational efficiency, attracting a broader range of investors, including those seeking ESG-compliant investments. These innovations are fundamentally reshaping the market, improving efficiency, and fostering competition.
Report Scope & Segmentation Analysis
This report provides a comprehensive segmentation of the GCC REIT market, analyzing it by property type (Commercial, Residential, Industrial & Logistics, Healthcare, Hospitality) and investment type (Equity, Mortgage). A detailed analysis of each segment's market size (in Millions), growth projections, and competitive dynamics is presented. For example, the Commercial REIT segment is projected to reach [Insert Precise Value] Million by 2033, exhibiting a CAGR of [Insert Precise CAGR]%. The market for Residential REITs in 2025 is estimated at [Insert Precise Value] Million.
Key Drivers of GCC REIT Industry Growth
Several factors drive the growth of the GCC REIT industry. These include supportive government policies, increasing institutional investment, strong economic growth across the region, rising urbanization, and a growing demand for diversified investment products. The development of robust regulatory frameworks further enhances market confidence.
Challenges in the GCC REIT Industry Sector
Despite positive growth prospects, the GCC REIT sector faces challenges. These include regulatory complexities across different GCC countries, potential fluctuations in property valuations, competition from other investment classes, and the impact of global economic uncertainties on real estate markets. These challenges can impact investment decisions and overall market stability. For example, a [xx]% decrease in global interest rates could impact the profitability of some REITs by [xx] Million in [year].
Emerging Opportunities in GCC REIT Industry
The GCC REIT market presents numerous opportunities. These include the development of specialized REITs catering to niche sectors (e.g., renewable energy, logistics), increased adoption of technology to enhance operational efficiency and investor engagement, expansion into underserved markets, and leveraging the growing demand for sustainable and ESG-compliant investments.
Leading Players in the GCC REIT Industry Market
- Emaar Malls Group
- Aldar Properties
- Qatar Real Estate Investment Fund (QREIF)
- Mabanee Company K.S.C.P.
- Saudi Real Estate Company (SAREC)
- Mall of Oman
- National Real Estate Company (NREC)
Key Developments in GCC REIT Industry
- November 2016: Riyad REIT, the first REIT, listed in Saudi Arabia.
- September 2022: Saudi Arabia introduces a REIT regime.
- July 2022: 17 REITs listed in Saudi Arabia following Riyad REIT.
- January 2021: Dubai Financial Market (DFM) begins trading REITs.
Future Outlook for GCC REIT Industry Market
The GCC REIT industry is poised for continued robust growth, propelled by strong economic fundamentals, supportive government policies, and the increasing appeal to both domestic and international investors. Significant strategic opportunities exist for REITs focused on expansion into emerging market segments, adoption of cutting-edge technologies, and capitalization on the growing demand for sustainable and responsible investments. The market is expected to witness further consolidation through mergers and acquisitions (M&A), leading to the emergence of larger, more diversified, and resilient REIT players with enhanced market competitiveness.
GCC REIT Industry Segmentation
- 1. Production Analysis
- 2. Consumption Analysis
- 3. Import Market Analysis (Value & Volume)
- 4. Export Market Analysis (Value & Volume)
- 5. Price Trend Analysis
GCC REIT Industry Segmentation By Geography
-
1. North America
- 1.1. United States
- 1.2. Canada
- 1.3. Mexico
-
2. South America
- 2.1. Brazil
- 2.2. Argentina
- 2.3. Rest of South America
-
3. Europe
- 3.1. United Kingdom
- 3.2. Germany
- 3.3. France
- 3.4. Italy
- 3.5. Spain
- 3.6. Russia
- 3.7. Benelux
- 3.8. Nordics
- 3.9. Rest of Europe
-
4. Middle East & Africa
- 4.1. Turkey
- 4.2. Israel
- 4.3. GCC
- 4.4. North Africa
- 4.5. South Africa
- 4.6. Rest of Middle East & Africa
-
5. Asia Pacific
- 5.1. China
- 5.2. India
- 5.3. Japan
- 5.4. South Korea
- 5.5. ASEAN
- 5.6. Oceania
- 5.7. Rest of Asia Pacific
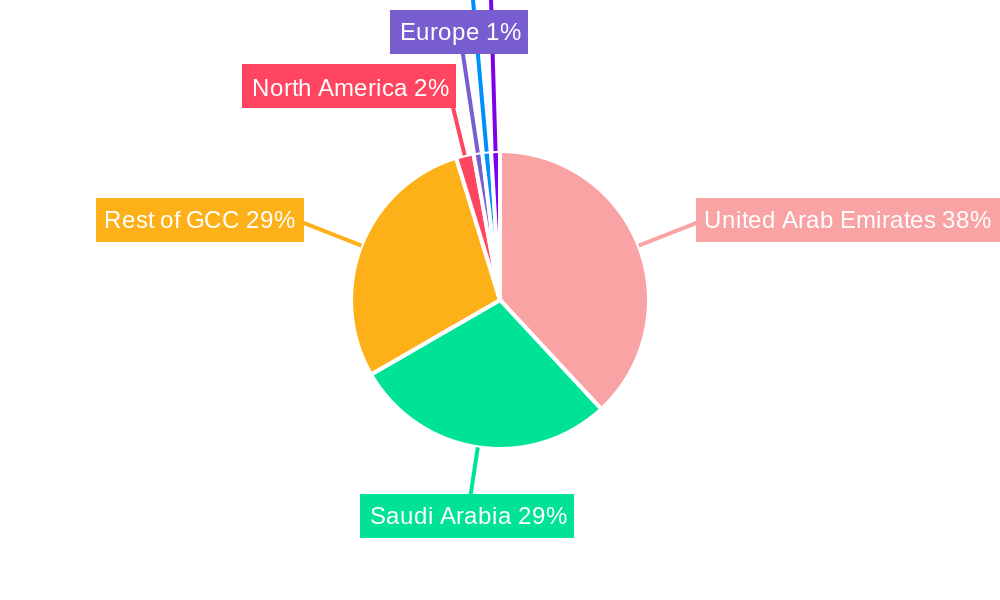
GCC REIT Industry Regional Market Share
Geographic Coverage of GCC REIT Industry
GCC REIT Industry REPORT HIGHLIGHTS
| Aspects | Details |
|---|---|
| Study Period | 2020-2034 |
| Base Year | 2025 |
| Estimated Year | 2026 |
| Forecast Period | 2026-2034 |
| Historical Period | 2020-2025 |
| Growth Rate | CAGR of 8.24% from 2020-2034 |
| Segmentation |
|
Table of Contents
- 1. Introduction
- 1.1. Research Scope
- 1.2. Market Segmentation
- 1.3. Research Objective
- 1.4. Definitions and Assumptions
- 2. Executive Summary
- 2.1. Market Snapshot
- 3. Market Dynamics
- 3.1. Market Drivers
- 3.2. Market Restrains
- 3.3. Market Trends
- 3.4. Market Opportunities
- 4. Market Factor Analysis
- 4.1. Porters Five Forces
- 4.1.1. Bargaining Power of Suppliers
- 4.1.2. Bargaining Power of Buyers
- 4.1.3. Threat of New Entrants
- 4.1.4. Threat of Substitutes
- 4.1.5. Competitive Rivalry
- 4.2. PESTEL analysis
- 4.3. BCG Analysis
- 4.3.1. Stars (High Growth, High Market Share)
- 4.3.2. Cash Cows (Low Growth, High Market Share)
- 4.3.3. Question Mark (High Growth, Low Market Share)
- 4.3.4. Dogs (Low Growth, Low Market Share)
- 4.4. Ansoff Matrix Analysis
- 4.5. Supply Chain Analysis
- 4.6. Regulatory Landscape
- 4.7. Current Market Potential and Opportunity Assessment (TAM–SAM–SOM Framework)
- 4.8. PRI Analyst Note
- 4.1. Porters Five Forces
- 5. Market Analysis, Insights and Forecast 2021-2033
- 5.1. Market Analysis, Insights and Forecast - by Production Analysis
- 5.2. Market Analysis, Insights and Forecast - by Consumption Analysis
- 5.3. Market Analysis, Insights and Forecast - by Import Market Analysis (Value & Volume)
- 5.4. Market Analysis, Insights and Forecast - by Export Market Analysis (Value & Volume)
- 5.5. Market Analysis, Insights and Forecast - by Price Trend Analysis
- 5.6. Market Analysis, Insights and Forecast - by Region
- 5.6.1. North America
- 5.6.2. South America
- 5.6.3. Europe
- 5.6.4. Middle East & Africa
- 5.6.5. Asia Pacific
- 6. Global GCC REIT Industry Analysis, Insights and Forecast, 2021-2033
- 6.1. Market Analysis, Insights and Forecast - by Production Analysis
- 6.2. Market Analysis, Insights and Forecast - by Consumption Analysis
- 6.3. Market Analysis, Insights and Forecast - by Import Market Analysis (Value & Volume)
- 6.4. Market Analysis, Insights and Forecast - by Export Market Analysis (Value & Volume)
- 6.5. Market Analysis, Insights and Forecast - by Price Trend Analysis
- 7. North America GCC REIT Industry Analysis, Insights and Forecast, 2020-2032
- 7.1. Market Analysis, Insights and Forecast - by Production Analysis
- 7.2. Market Analysis, Insights and Forecast - by Consumption Analysis
- 7.3. Market Analysis, Insights and Forecast - by Import Market Analysis (Value & Volume)
- 7.4. Market Analysis, Insights and Forecast - by Export Market Analysis (Value & Volume)
- 7.5. Market Analysis, Insights and Forecast - by Price Trend Analysis
- 8. South America GCC REIT Industry Analysis, Insights and Forecast, 2020-2032
- 8.1. Market Analysis, Insights and Forecast - by Production Analysis
- 8.2. Market Analysis, Insights and Forecast - by Consumption Analysis
- 8.3. Market Analysis, Insights and Forecast - by Import Market Analysis (Value & Volume)
- 8.4. Market Analysis, Insights and Forecast - by Export Market Analysis (Value & Volume)
- 8.5. Market Analysis, Insights and Forecast - by Price Trend Analysis
- 9. Europe GCC REIT Industry Analysis, Insights and Forecast, 2020-2032
- 9.1. Market Analysis, Insights and Forecast - by Production Analysis
- 9.2. Market Analysis, Insights and Forecast - by Consumption Analysis
- 9.3. Market Analysis, Insights and Forecast - by Import Market Analysis (Value & Volume)
- 9.4. Market Analysis, Insights and Forecast - by Export Market Analysis (Value & Volume)
- 9.5. Market Analysis, Insights and Forecast - by Price Trend Analysis
- 10. Middle East & Africa GCC REIT Industry Analysis, Insights and Forecast, 2020-2032
- 10.1. Market Analysis, Insights and Forecast - by Production Analysis
- 10.2. Market Analysis, Insights and Forecast - by Consumption Analysis
- 10.3. Market Analysis, Insights and Forecast - by Import Market Analysis (Value & Volume)
- 10.4. Market Analysis, Insights and Forecast - by Export Market Analysis (Value & Volume)
- 10.5. Market Analysis, Insights and Forecast - by Price Trend Analysis
- 11. Asia Pacific GCC REIT Industry Analysis, Insights and Forecast, 2020-2032
- 11.1. Market Analysis, Insights and Forecast - by Production Analysis
- 11.2. Market Analysis, Insights and Forecast - by Consumption Analysis
- 11.3. Market Analysis, Insights and Forecast - by Import Market Analysis (Value & Volume)
- 11.4. Market Analysis, Insights and Forecast - by Export Market Analysis (Value & Volume)
- 11.5. Market Analysis, Insights and Forecast - by Price Trend Analysis
- 12. Competitive Analysis
- 12.1. Company Profiles
- 12.1.1 Emaar Malls Group
- 12.1.1.1. Company Overview
- 12.1.1.2. Products
- 12.1.1.3. Company Financials
- 12.1.1.4. SWOT Analysis
- 12.1.2 Aldar Properties
- 12.1.2.1. Company Overview
- 12.1.2.2. Products
- 12.1.2.3. Company Financials
- 12.1.2.4. SWOT Analysis
- 12.1.3 Qatar Real Estate Investment Fund (QREIF)
- 12.1.3.1. Company Overview
- 12.1.3.2. Products
- 12.1.3.3. Company Financials
- 12.1.3.4. SWOT Analysis
- 12.1.4 Mabanee Company K.S.C.P.
- 12.1.4.1. Company Overview
- 12.1.4.2. Products
- 12.1.4.3. Company Financials
- 12.1.4.4. SWOT Analysis
- 12.1.5 Saudi Real Estate Company (SAREC)
- 12.1.5.1. Company Overview
- 12.1.5.2. Products
- 12.1.5.3. Company Financials
- 12.1.5.4. SWOT Analysis
- 12.1.6 Mall of Oman
- 12.1.6.1. Company Overview
- 12.1.6.2. Products
- 12.1.6.3. Company Financials
- 12.1.6.4. SWOT Analysis
- 12.1.7 National Real Estate Company (NREC)
- 12.1.7.1. Company Overview
- 12.1.7.2. Products
- 12.1.7.3. Company Financials
- 12.1.7.4. SWOT Analysis
- 12.1.1 Emaar Malls Group
- 12.2. Market Entropy
- 12.2.1 Company's Key Areas Served
- 12.2.2 Recent Developments
- 12.3. Company Market Share Analysis 2025
- 12.3.1 Top 5 Companies Market Share Analysis
- 12.3.2 Top 3 Companies Market Share Analysis
- 12.4. List of Potential Customers
- 13. Research Methodology
List of Figures
- Figure 1: Global GCC REIT Industry Revenue Breakdown (Million, %) by Region 2025 & 2033
- Figure 2: North America GCC REIT Industry Revenue (Million), by Production Analysis 2025 & 2033
- Figure 3: North America GCC REIT Industry Revenue Share (%), by Production Analysis 2025 & 2033
- Figure 4: North America GCC REIT Industry Revenue (Million), by Consumption Analysis 2025 & 2033
- Figure 5: North America GCC REIT Industry Revenue Share (%), by Consumption Analysis 2025 & 2033
- Figure 6: North America GCC REIT Industry Revenue (Million), by Import Market Analysis (Value & Volume) 2025 & 2033
- Figure 7: North America GCC REIT Industry Revenue Share (%), by Import Market Analysis (Value & Volume) 2025 & 2033
- Figure 8: North America GCC REIT Industry Revenue (Million), by Export Market Analysis (Value & Volume) 2025 & 2033
- Figure 9: North America GCC REIT Industry Revenue Share (%), by Export Market Analysis (Value & Volume) 2025 & 2033
- Figure 10: North America GCC REIT Industry Revenue (Million), by Price Trend Analysis 2025 & 2033
- Figure 11: North America GCC REIT Industry Revenue Share (%), by Price Trend Analysis 2025 & 2033
- Figure 12: North America GCC REIT Industry Revenue (Million), by Country 2025 & 2033
- Figure 13: North America GCC REIT Industry Revenue Share (%), by Country 2025 & 2033
- Figure 14: South America GCC REIT Industry Revenue (Million), by Production Analysis 2025 & 2033
- Figure 15: South America GCC REIT Industry Revenue Share (%), by Production Analysis 2025 & 2033
- Figure 16: South America GCC REIT Industry Revenue (Million), by Consumption Analysis 2025 & 2033
- Figure 17: South America GCC REIT Industry Revenue Share (%), by Consumption Analysis 2025 & 2033
- Figure 18: South America GCC REIT Industry Revenue (Million), by Import Market Analysis (Value & Volume) 2025 & 2033
- Figure 19: South America GCC REIT Industry Revenue Share (%), by Import Market Analysis (Value & Volume) 2025 & 2033
- Figure 20: South America GCC REIT Industry Revenue (Million), by Export Market Analysis (Value & Volume) 2025 & 2033
- Figure 21: South America GCC REIT Industry Revenue Share (%), by Export Market Analysis (Value & Volume) 2025 & 2033
- Figure 22: South America GCC REIT Industry Revenue (Million), by Price Trend Analysis 2025 & 2033
- Figure 23: South America GCC REIT Industry Revenue Share (%), by Price Trend Analysis 2025 & 2033
- Figure 24: South America GCC REIT Industry Revenue (Million), by Country 2025 & 2033
- Figure 25: South America GCC REIT Industry Revenue Share (%), by Country 2025 & 2033
- Figure 26: Europe GCC REIT Industry Revenue (Million), by Production Analysis 2025 & 2033
- Figure 27: Europe GCC REIT Industry Revenue Share (%), by Production Analysis 2025 & 2033
- Figure 28: Europe GCC REIT Industry Revenue (Million), by Consumption Analysis 2025 & 2033
- Figure 29: Europe GCC REIT Industry Revenue Share (%), by Consumption Analysis 2025 & 2033
- Figure 30: Europe GCC REIT Industry Revenue (Million), by Import Market Analysis (Value & Volume) 2025 & 2033
- Figure 31: Europe GCC REIT Industry Revenue Share (%), by Import Market Analysis (Value & Volume) 2025 & 2033
- Figure 32: Europe GCC REIT Industry Revenue (Million), by Export Market Analysis (Value & Volume) 2025 & 2033
- Figure 33: Europe GCC REIT Industry Revenue Share (%), by Export Market Analysis (Value & Volume) 2025 & 2033
- Figure 34: Europe GCC REIT Industry Revenue (Million), by Price Trend Analysis 2025 & 2033
- Figure 35: Europe GCC REIT Industry Revenue Share (%), by Price Trend Analysis 2025 & 2033
- Figure 36: Europe GCC REIT Industry Revenue (Million), by Country 2025 & 2033
- Figure 37: Europe GCC REIT Industry Revenue Share (%), by Country 2025 & 2033
- Figure 38: Middle East & Africa GCC REIT Industry Revenue (Million), by Production Analysis 2025 & 2033
- Figure 39: Middle East & Africa GCC REIT Industry Revenue Share (%), by Production Analysis 2025 & 2033
- Figure 40: Middle East & Africa GCC REIT Industry Revenue (Million), by Consumption Analysis 2025 & 2033
- Figure 41: Middle East & Africa GCC REIT Industry Revenue Share (%), by Consumption Analysis 2025 & 2033
- Figure 42: Middle East & Africa GCC REIT Industry Revenue (Million), by Import Market Analysis (Value & Volume) 2025 & 2033
- Figure 43: Middle East & Africa GCC REIT Industry Revenue Share (%), by Import Market Analysis (Value & Volume) 2025 & 2033
- Figure 44: Middle East & Africa GCC REIT Industry Revenue (Million), by Export Market Analysis (Value & Volume) 2025 & 2033
- Figure 45: Middle East & Africa GCC REIT Industry Revenue Share (%), by Export Market Analysis (Value & Volume) 2025 & 2033
- Figure 46: Middle East & Africa GCC REIT Industry Revenue (Million), by Price Trend Analysis 2025 & 2033
- Figure 47: Middle East & Africa GCC REIT Industry Revenue Share (%), by Price Trend Analysis 2025 & 2033
- Figure 48: Middle East & Africa GCC REIT Industry Revenue (Million), by Country 2025 & 2033
- Figure 49: Middle East & Africa GCC REIT Industry Revenue Share (%), by Country 2025 & 2033
- Figure 50: Asia Pacific GCC REIT Industry Revenue (Million), by Production Analysis 2025 & 2033
- Figure 51: Asia Pacific GCC REIT Industry Revenue Share (%), by Production Analysis 2025 & 2033
- Figure 52: Asia Pacific GCC REIT Industry Revenue (Million), by Consumption Analysis 2025 & 2033
- Figure 53: Asia Pacific GCC REIT Industry Revenue Share (%), by Consumption Analysis 2025 & 2033
- Figure 54: Asia Pacific GCC REIT Industry Revenue (Million), by Import Market Analysis (Value & Volume) 2025 & 2033
- Figure 55: Asia Pacific GCC REIT Industry Revenue Share (%), by Import Market Analysis (Value & Volume) 2025 & 2033
- Figure 56: Asia Pacific GCC REIT Industry Revenue (Million), by Export Market Analysis (Value & Volume) 2025 & 2033
- Figure 57: Asia Pacific GCC REIT Industry Revenue Share (%), by Export Market Analysis (Value & Volume) 2025 & 2033
- Figure 58: Asia Pacific GCC REIT Industry Revenue (Million), by Price Trend Analysis 2025 & 2033
- Figure 59: Asia Pacific GCC REIT Industry Revenue Share (%), by Price Trend Analysis 2025 & 2033
- Figure 60: Asia Pacific GCC REIT Industry Revenue (Million), by Country 2025 & 2033
- Figure 61: Asia Pacific GCC REIT Industry Revenue Share (%), by Country 2025 & 2033
List of Tables
- Table 1: Global GCC REIT Industry Revenue Million Forecast, by Production Analysis 2020 & 2033
- Table 2: Global GCC REIT Industry Revenue Million Forecast, by Consumption Analysis 2020 & 2033
- Table 3: Global GCC REIT Industry Revenue Million Forecast, by Import Market Analysis (Value & Volume) 2020 & 2033
- Table 4: Global GCC REIT Industry Revenue Million Forecast, by Export Market Analysis (Value & Volume) 2020 & 2033
- Table 5: Global GCC REIT Industry Revenue Million Forecast, by Price Trend Analysis 2020 & 2033
- Table 6: Global GCC REIT Industry Revenue Million Forecast, by Region 2020 & 2033
- Table 7: Global GCC REIT Industry Revenue Million Forecast, by Production Analysis 2020 & 2033
- Table 8: Global GCC REIT Industry Revenue Million Forecast, by Consumption Analysis 2020 & 2033
- Table 9: Global GCC REIT Industry Revenue Million Forecast, by Import Market Analysis (Value & Volume) 2020 & 2033
- Table 10: Global GCC REIT Industry Revenue Million Forecast, by Export Market Analysis (Value & Volume) 2020 & 2033
- Table 11: Global GCC REIT Industry Revenue Million Forecast, by Price Trend Analysis 2020 & 2033
- Table 12: Global GCC REIT Industry Revenue Million Forecast, by Country 2020 & 2033
- Table 13: United States GCC REIT Industry Revenue (Million) Forecast, by Application 2020 & 2033
- Table 14: Canada GCC REIT Industry Revenue (Million) Forecast, by Application 2020 & 2033
- Table 15: Mexico GCC REIT Industry Revenue (Million) Forecast, by Application 2020 & 2033
- Table 16: Global GCC REIT Industry Revenue Million Forecast, by Production Analysis 2020 & 2033
- Table 17: Global GCC REIT Industry Revenue Million Forecast, by Consumption Analysis 2020 & 2033
- Table 18: Global GCC REIT Industry Revenue Million Forecast, by Import Market Analysis (Value & Volume) 2020 & 2033
- Table 19: Global GCC REIT Industry Revenue Million Forecast, by Export Market Analysis (Value & Volume) 2020 & 2033
- Table 20: Global GCC REIT Industry Revenue Million Forecast, by Price Trend Analysis 2020 & 2033
- Table 21: Global GCC REIT Industry Revenue Million Forecast, by Country 2020 & 2033
- Table 22: Brazil GCC REIT Industry Revenue (Million) Forecast, by Application 2020 & 2033
- Table 23: Argentina GCC REIT Industry Revenue (Million) Forecast, by Application 2020 & 2033
- Table 24: Rest of South America GCC REIT Industry Revenue (Million) Forecast, by Application 2020 & 2033
- Table 25: Global GCC REIT Industry Revenue Million Forecast, by Production Analysis 2020 & 2033
- Table 26: Global GCC REIT Industry Revenue Million Forecast, by Consumption Analysis 2020 & 2033
- Table 27: Global GCC REIT Industry Revenue Million Forecast, by Import Market Analysis (Value & Volume) 2020 & 2033
- Table 28: Global GCC REIT Industry Revenue Million Forecast, by Export Market Analysis (Value & Volume) 2020 & 2033
- Table 29: Global GCC REIT Industry Revenue Million Forecast, by Price Trend Analysis 2020 & 2033
- Table 30: Global GCC REIT Industry Revenue Million Forecast, by Country 2020 & 2033
- Table 31: United Kingdom GCC REIT Industry Revenue (Million) Forecast, by Application 2020 & 2033
- Table 32: Germany GCC REIT Industry Revenue (Million) Forecast, by Application 2020 & 2033
- Table 33: France GCC REIT Industry Revenue (Million) Forecast, by Application 2020 & 2033
- Table 34: Italy GCC REIT Industry Revenue (Million) Forecast, by Application 2020 & 2033
- Table 35: Spain GCC REIT Industry Revenue (Million) Forecast, by Application 2020 & 2033
- Table 36: Russia GCC REIT Industry Revenue (Million) Forecast, by Application 2020 & 2033
- Table 37: Benelux GCC REIT Industry Revenue (Million) Forecast, by Application 2020 & 2033
- Table 38: Nordics GCC REIT Industry Revenue (Million) Forecast, by Application 2020 & 2033
- Table 39: Rest of Europe GCC REIT Industry Revenue (Million) Forecast, by Application 2020 & 2033
- Table 40: Global GCC REIT Industry Revenue Million Forecast, by Production Analysis 2020 & 2033
- Table 41: Global GCC REIT Industry Revenue Million Forecast, by Consumption Analysis 2020 & 2033
- Table 42: Global GCC REIT Industry Revenue Million Forecast, by Import Market Analysis (Value & Volume) 2020 & 2033
- Table 43: Global GCC REIT Industry Revenue Million Forecast, by Export Market Analysis (Value & Volume) 2020 & 2033
- Table 44: Global GCC REIT Industry Revenue Million Forecast, by Price Trend Analysis 2020 & 2033
- Table 45: Global GCC REIT Industry Revenue Million Forecast, by Country 2020 & 2033
- Table 46: Turkey GCC REIT Industry Revenue (Million) Forecast, by Application 2020 & 2033
- Table 47: Israel GCC REIT Industry Revenue (Million) Forecast, by Application 2020 & 2033
- Table 48: GCC GCC REIT Industry Revenue (Million) Forecast, by Application 2020 & 2033
- Table 49: North Africa GCC REIT Industry Revenue (Million) Forecast, by Application 2020 & 2033
- Table 50: South Africa GCC REIT Industry Revenue (Million) Forecast, by Application 2020 & 2033
- Table 51: Rest of Middle East & Africa GCC REIT Industry Revenue (Million) Forecast, by Application 2020 & 2033
- Table 52: Global GCC REIT Industry Revenue Million Forecast, by Production Analysis 2020 & 2033
- Table 53: Global GCC REIT Industry Revenue Million Forecast, by Consumption Analysis 2020 & 2033
- Table 54: Global GCC REIT Industry Revenue Million Forecast, by Import Market Analysis (Value & Volume) 2020 & 2033
- Table 55: Global GCC REIT Industry Revenue Million Forecast, by Export Market Analysis (Value & Volume) 2020 & 2033
- Table 56: Global GCC REIT Industry Revenue Million Forecast, by Price Trend Analysis 2020 & 2033
- Table 57: Global GCC REIT Industry Revenue Million Forecast, by Country 2020 & 2033
- Table 58: China GCC REIT Industry Revenue (Million) Forecast, by Application 2020 & 2033
- Table 59: India GCC REIT Industry Revenue (Million) Forecast, by Application 2020 & 2033
- Table 60: Japan GCC REIT Industry Revenue (Million) Forecast, by Application 2020 & 2033
- Table 61: South Korea GCC REIT Industry Revenue (Million) Forecast, by Application 2020 & 2033
- Table 62: ASEAN GCC REIT Industry Revenue (Million) Forecast, by Application 2020 & 2033
- Table 63: Oceania GCC REIT Industry Revenue (Million) Forecast, by Application 2020 & 2033
- Table 64: Rest of Asia Pacific GCC REIT Industry Revenue (Million) Forecast, by Application 2020 & 2033
Frequently Asked Questions
1. What is the projected Compound Annual Growth Rate (CAGR) of the GCC REIT Industry?
The projected CAGR is approximately 8.24%.
2. Which companies are prominent players in the GCC REIT Industry?
Key companies in the market include Emaar Malls Group , Aldar Properties , Qatar Real Estate Investment Fund (QREIF) , Mabanee Company K.S.C.P., Saudi Real Estate Company (SAREC) , Mall of Oman , National Real Estate Company (NREC) .
3. What are the main segments of the GCC REIT Industry?
The market segments include Production Analysis, Consumption Analysis, Import Market Analysis (Value & Volume), Export Market Analysis (Value & Volume), Price Trend Analysis.
4. Can you provide details about the market size?
The market size is estimated to be USD 10.37 Million as of 2022.
5. What are some drivers contributing to market growth?
Fund Inflows is Driving the ETF Market.
6. What are the notable trends driving market growth?
Growing Asset Allocation to Real Estate by Large Investors in The Region.
7. Are there any restraints impacting market growth?
Underlying Fluctuations and Risks are Restraining the Market.
8. Can you provide examples of recent developments in the market?
In September 2022, Saudi Arabia introduced a real estate investment trust (REIT) regime. In November 2016, Riyad REIT was the first REIT to be listed in Saudi Arabia (and only the second REIT to be listed in the Middle East), which was followed by another 17 REITs up to July 2022, with a number of them also increasing their capital to acquire additional assets.
9. What pricing options are available for accessing the report?
Pricing options include single-user, multi-user, and enterprise licenses priced at USD 3800, USD 4500, and USD 5800 respectively.
10. Is the market size provided in terms of value or volume?
The market size is provided in terms of value, measured in Million.
11. Are there any specific market keywords associated with the report?
Yes, the market keyword associated with the report is "GCC REIT Industry," which aids in identifying and referencing the specific market segment covered.
12. How do I determine which pricing option suits my needs best?
The pricing options vary based on user requirements and access needs. Individual users may opt for single-user licenses, while businesses requiring broader access may choose multi-user or enterprise licenses for cost-effective access to the report.
13. Are there any additional resources or data provided in the GCC REIT Industry report?
While the report offers comprehensive insights, it's advisable to review the specific contents or supplementary materials provided to ascertain if additional resources or data are available.
14. How can I stay updated on further developments or reports in the GCC REIT Industry?
To stay informed about further developments, trends, and reports in the GCC REIT Industry, consider subscribing to industry newsletters, following relevant companies and organizations, or regularly checking reputable industry news sources and publications.
Methodology
Step 1 - Identification of Relevant Samples Size from Population Database


Step 2 - Approaches for Defining Global Market Size (Value, Volume* & Price*)

Note*: In applicable scenarios
Step 3 - Data Sources
Primary Research
- Web Analytics
- Survey Reports
- Research Institute
- Latest Research Reports
- Opinion Leaders
Secondary Research
- Annual Reports
- White Paper
- Latest Press Release
- Industry Association
- Paid Database
- Investor Presentations

Step 4 - Data Triangulation
Involves using different sources of information in order to increase the validity of a study
These sources are likely to be stakeholders in a program - participants, other researchers, program staff, other community members, and so on.
Then we put all data in single framework & apply various statistical tools to find out the dynamic on the market.
During the analysis stage, feedback from the stakeholder groups would be compared to determine areas of agreement as well as areas of divergence