

Key Insights
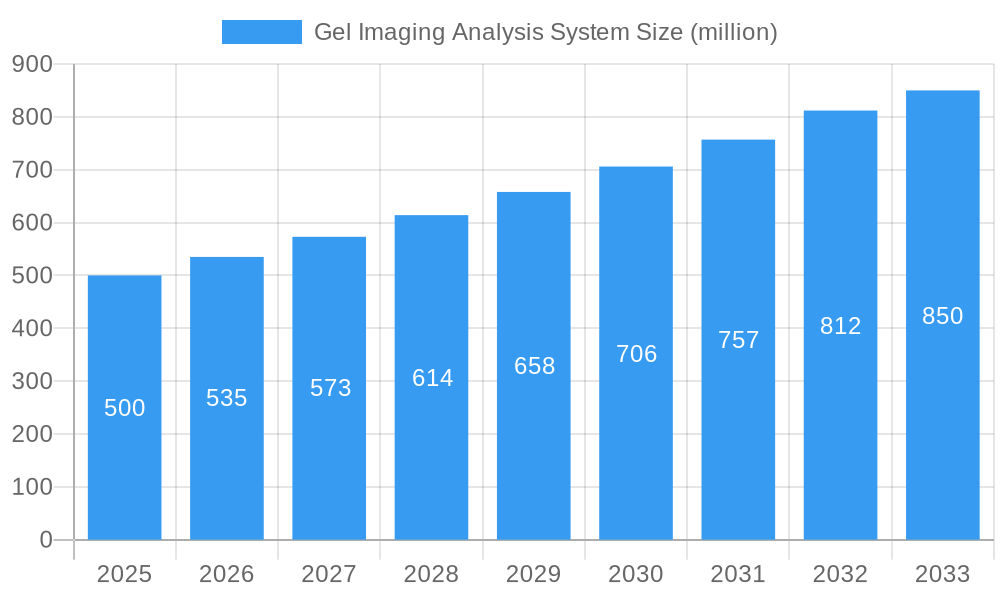
The global gel imaging analysis system market is poised for significant expansion, driven by the escalating demand for sophisticated life science research tools in genomics, proteomics, and molecular biology. The market, valued at $373.9 million in 2025, is forecasted to grow at a compound annual growth rate (CAGR) of 6.21% from 2025 to 2033, reaching an estimated value of over $600 million by 2033. This upward trajectory is underpinned by several critical factors: advancements in imaging technology, including enhanced resolution, sensitivity, and automated analysis, are elevating system efficiency and efficacy. Concurrently, the increasing burden of chronic diseases is stimulating pharmaceutical and biotechnology R&D, consequently boosting demand for these essential systems. Furthermore, the synergistic integration with next-generation sequencing (NGS) technologies is fostering complementary market growth. Key challenges, such as substantial initial investment and the requirement for specialized technical proficiency, are present.
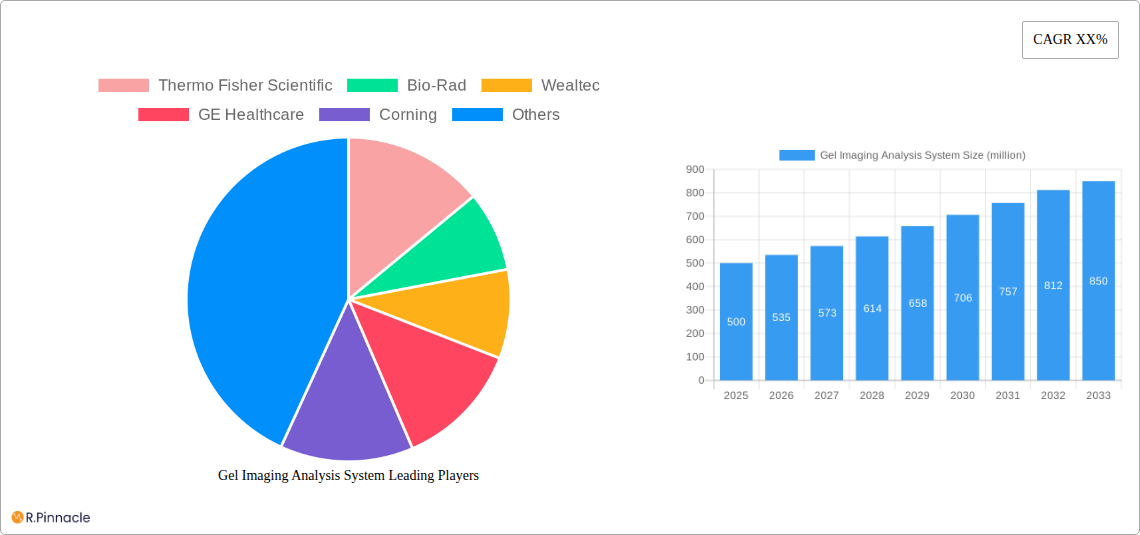
Gel Imaging Analysis System Market Size (In Million)
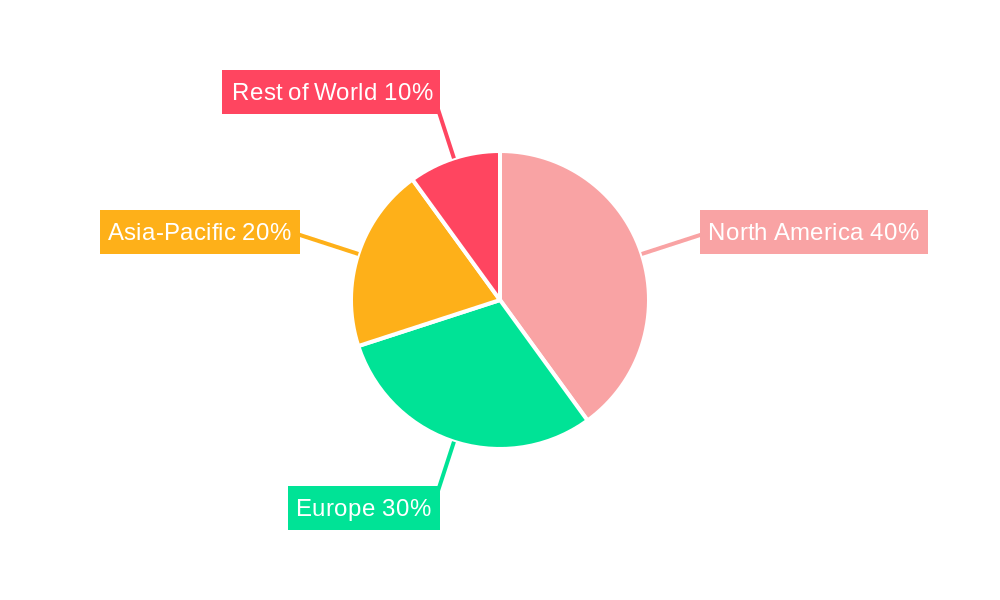
Despite these hurdles, market segmentation presents considerable opportunities. The demand for high-throughput systems for large-scale research operations, alongside the development of portable and cost-effective solutions for smaller laboratories and educational settings, is shaping the market’s evolution. Major industry contributors, including Thermo Fisher Scientific, Bio-Rad, and GE Healthcare, command a significant market presence, capitalizing on established brand equity and extensive distribution channels. Nevertheless, the emergence of innovative niche players specializing in advanced image analysis software and novel detection methodologies contributes to a vibrant competitive environment. Regional dynamics indicate North America and Europe currently lead in market share due to robust R&D investment and a strong concentration of key manufacturers. However, emerging economies within the Asia-Pacific region are demonstrating a substantial increase in demand, signaling considerable future growth potential.
Gel Imaging Analysis System Company Market Share
Gel Imaging Analysis System Market Report: 2019-2033
This comprehensive report provides an in-depth analysis of the global Gel Imaging Analysis System market, offering valuable insights for industry professionals, investors, and researchers. The study covers the period 2019-2033, with a focus on the forecast period 2025-2033, and utilizes 2025 as the base year. The report projects a market valued at $XX million in 2025, growing at a CAGR of XX% to reach $XX million by 2033.
Gel Imaging Analysis System Market Structure & Innovation Trends
This section analyzes the market structure, highlighting key players, their market share, and the competitive landscape. We delve into innovation drivers, regulatory influences, and the impact of mergers and acquisitions (M&A).
- Market Concentration: The Gel Imaging Analysis System market is moderately concentrated, with key players like Thermo Fisher Scientific, Bio-Rad, and GE Healthcare holding significant market share. However, smaller players are also making inroads with niche products and innovative solutions. We estimate that the top 5 players account for approximately XX% of the market in 2025.
- Innovation Drivers: Advancements in detector technology, software analytics, and automation are key drivers of innovation. The demand for higher throughput, improved sensitivity, and more sophisticated image analysis capabilities is pushing companies to develop advanced systems.
- Regulatory Frameworks: Regulatory compliance, particularly concerning safety and data security, influences market dynamics. Stringent regulations in certain regions can affect the adoption and deployment of new systems.
- Product Substitutes: While there are limited direct substitutes, alternative techniques such as densitometry are used in some instances. However, the increasing demand for high-throughput and precise analysis is driving greater adoption of gel imaging systems.
- End-User Demographics: Key end-users are research institutions, pharmaceutical companies, biotechnology firms, and hospitals. The growth of the pharmaceutical and biotechnology industries is directly impacting market growth.
- M&A Activities: The past five years have seen several significant M&A deals in the industry, with transaction values totaling approximately $XX million. These activities have reshaped the competitive landscape and accelerated innovation.
Gel Imaging Analysis System Market Dynamics & Trends
This section explores the key factors shaping market dynamics, including growth drivers, technological advancements, consumer preferences, and competitive pressures.
The Gel Imaging Analysis System market is experiencing robust growth driven by several factors. Increased research funding in life sciences, the rise of personalized medicine, and the growing adoption of advanced imaging techniques are key drivers. Technological advancements such as higher resolution imaging, improved software capabilities, and the incorporation of automation are further fueling market expansion. The preference for higher throughput, reduced hands-on time, and enhanced data analysis capabilities are also influencing market trends. Competition is intense, with established players and emerging companies vying for market share. This competition is driving innovation and price pressures. Market penetration in emerging economies remains relatively low, presenting significant growth potential.
Dominant Regions & Segments in Gel Imaging Analysis System
This section identifies the leading regions and segments within the Gel Imaging Analysis System market, analyzing the underlying factors contributing to their dominance.
North America consistently emerges as the dominant region, fueled by robust research funding, a well-established biotechnology sector, and early adoption of advanced technologies. Key drivers include:
- Strong government support for research and development.
- A large number of pharmaceutical and biotechnology companies.
- High awareness and adoption of advanced technologies.
Other significant regions include Europe and Asia-Pacific, which are experiencing substantial growth, driven by rising research activities and increasing healthcare spending.
Detailed analysis reveals that the [Specific Segment - e.g., High-Throughput Systems] segment is the fastest-growing, driven by the demand for increased efficiency and reduced processing times in research labs.
Gel Imaging Analysis System Product Innovations
Recent product innovations focus on enhanced sensitivity, higher resolution imaging, improved software for data analysis, and increased automation. These advancements address the need for faster, more accurate, and user-friendly gel imaging systems. Miniaturization, portability, and integration with other lab equipment are also emerging trends enhancing market fit.
Report Scope & Segmentation Analysis
This report provides a comprehensive segmentation of the Gel Imaging Analysis System market based on [mention specific segmentation criteria, e.g., product type, application, end-user]. Each segment is analyzed based on its market size, growth rate, and competitive dynamics. Detailed growth projections are provided for each segment for the forecast period.
Key Drivers of Gel Imaging Analysis System Growth
Several factors are driving the growth of the Gel Imaging Analysis System market, including:
- Increasing demand for high-throughput systems in research laboratories.
- Technological advancements in image acquisition and analysis.
- Growth of the pharmaceutical and biotechnology industries.
- Rising research funding in life sciences.
Challenges in the Gel Imaging Analysis System Sector
The Gel Imaging Analysis System sector faces challenges such as:
- High initial investment costs for advanced systems.
- Increasing competition from emerging players.
- Stringent regulatory requirements in certain regions.
- Potential supply chain disruptions affecting component availability.
Emerging Opportunities in Gel Imaging Analysis System
Emerging opportunities lie in:
- Expanding into untapped markets in developing economies.
- Developing systems for specific applications (e.g., point-of-care diagnostics).
- Integrating AI and machine learning for advanced image analysis.
- Developing user-friendly and cost-effective systems.
Leading Players in the Gel Imaging Analysis System Market
- Thermo Fisher Scientific
- Bio-Rad
- Wealtec
- GE Healthcare
- Corning
- Gel Company
- ATTO
- Cleaver Scientific
- LI-COR
- Analytik Jena
- Tanon
- Shenhua Science Technolog
- Beijing Liuyi Biotechnology
- Shanghai Jinpeng Analysis Instrument
- CMVC lnternational GmbH
Key Developments in Gel Imaging Analysis System Industry
- 2022 Q4: Thermo Fisher Scientific launched a new high-throughput gel imaging system.
- 2023 Q1: Bio-Rad acquired a smaller competitor, expanding its market share.
- 2024 Q2: New regulatory guidelines were implemented in Europe impacting system certification.
- (Add more recent developments as available)
Future Outlook for Gel Imaging Analysis System Market
The Gel Imaging Analysis System market is poised for continued growth, driven by ongoing technological advancements, increasing research activities, and expanding applications in various fields. Strategic opportunities exist for companies focusing on innovation, expanding into emerging markets, and developing customized solutions for specific needs. The market's future hinges on the continued investment in research and development and the adaptation to evolving regulatory landscapes.
Gel Imaging Analysis System Segmentation
-
1. Application
- 1.1. Research
- 1.2. Medical
- 1.3. Teaching
- 1.4. Others
-
2. Types
- 2.1. UV Gel Imaging Analysis System
- 2.2. Blue Light Gel Imaging Analysis System
- 2.3. Others
Gel Imaging Analysis System Segmentation By Geography
-
1. North America
- 1.1. United States
- 1.2. Canada
- 1.3. Mexico
-
2. South America
- 2.1. Brazil
- 2.2. Argentina
- 2.3. Rest of South America
-
3. Europe
- 3.1. United Kingdom
- 3.2. Germany
- 3.3. France
- 3.4. Italy
- 3.5. Spain
- 3.6. Russia
- 3.7. Benelux
- 3.8. Nordics
- 3.9. Rest of Europe
-
4. Middle East & Africa
- 4.1. Turkey
- 4.2. Israel
- 4.3. GCC
- 4.4. North Africa
- 4.5. South Africa
- 4.6. Rest of Middle East & Africa
-
5. Asia Pacific
- 5.1. China
- 5.2. India
- 5.3. Japan
- 5.4. South Korea
- 5.5. ASEAN
- 5.6. Oceania
- 5.7. Rest of Asia Pacific
Gel Imaging Analysis System Regional Market Share
Geographic Coverage of Gel Imaging Analysis System
Gel Imaging Analysis System REPORT HIGHLIGHTS
| Aspects | Details |
|---|---|
| Study Period | 2020-2034 |
| Base Year | 2025 |
| Estimated Year | 2026 |
| Forecast Period | 2026-2034 |
| Historical Period | 2020-2025 |
| Growth Rate | CAGR of 6.21% from 2020-2034 |
| Segmentation |
|
Table of Contents
- 1. Introduction
- 1.1. Research Scope
- 1.2. Market Segmentation
- 1.3. Research Objective
- 1.4. Definitions and Assumptions
- 2. Executive Summary
- 2.1. Market Snapshot
- 3. Market Dynamics
- 3.1. Market Drivers
- 3.2. Market Restrains
- 3.3. Market Trends
- 3.4. Market Opportunities
- 4. Market Factor Analysis
- 4.1. Porters Five Forces
- 4.1.1. Bargaining Power of Suppliers
- 4.1.2. Bargaining Power of Buyers
- 4.1.3. Threat of New Entrants
- 4.1.4. Threat of Substitutes
- 4.1.5. Competitive Rivalry
- 4.2. PESTEL analysis
- 4.3. BCG Analysis
- 4.3.1. Stars (High Growth, High Market Share)
- 4.3.2. Cash Cows (Low Growth, High Market Share)
- 4.3.3. Question Mark (High Growth, Low Market Share)
- 4.3.4. Dogs (Low Growth, Low Market Share)
- 4.4. Ansoff Matrix Analysis
- 4.5. Supply Chain Analysis
- 4.6. Regulatory Landscape
- 4.7. Current Market Potential and Opportunity Assessment (TAM–SAM–SOM Framework)
- 4.8. PRI Analyst Note
- 4.1. Porters Five Forces
- 5. Market Analysis, Insights and Forecast 2021-2033
- 5.1. Market Analysis, Insights and Forecast - by Application
- 5.1.1. Research
- 5.1.2. Medical
- 5.1.3. Teaching
- 5.1.4. Others
- 5.2. Market Analysis, Insights and Forecast - by Types
- 5.2.1. UV Gel Imaging Analysis System
- 5.2.2. Blue Light Gel Imaging Analysis System
- 5.2.3. Others
- 5.3. Market Analysis, Insights and Forecast - by Region
- 5.3.1. North America
- 5.3.2. South America
- 5.3.3. Europe
- 5.3.4. Middle East & Africa
- 5.3.5. Asia Pacific
- 5.1. Market Analysis, Insights and Forecast - by Application
- 6. Global Gel Imaging Analysis System Analysis, Insights and Forecast, 2021-2033
- 6.1. Market Analysis, Insights and Forecast - by Application
- 6.1.1. Research
- 6.1.2. Medical
- 6.1.3. Teaching
- 6.1.4. Others
- 6.2. Market Analysis, Insights and Forecast - by Types
- 6.2.1. UV Gel Imaging Analysis System
- 6.2.2. Blue Light Gel Imaging Analysis System
- 6.2.3. Others
- 6.1. Market Analysis, Insights and Forecast - by Application
- 7. North America Gel Imaging Analysis System Analysis, Insights and Forecast, 2020-2032
- 7.1. Market Analysis, Insights and Forecast - by Application
- 7.1.1. Research
- 7.1.2. Medical
- 7.1.3. Teaching
- 7.1.4. Others
- 7.2. Market Analysis, Insights and Forecast - by Types
- 7.2.1. UV Gel Imaging Analysis System
- 7.2.2. Blue Light Gel Imaging Analysis System
- 7.2.3. Others
- 7.1. Market Analysis, Insights and Forecast - by Application
- 8. South America Gel Imaging Analysis System Analysis, Insights and Forecast, 2020-2032
- 8.1. Market Analysis, Insights and Forecast - by Application
- 8.1.1. Research
- 8.1.2. Medical
- 8.1.3. Teaching
- 8.1.4. Others
- 8.2. Market Analysis, Insights and Forecast - by Types
- 8.2.1. UV Gel Imaging Analysis System
- 8.2.2. Blue Light Gel Imaging Analysis System
- 8.2.3. Others
- 8.1. Market Analysis, Insights and Forecast - by Application
- 9. Europe Gel Imaging Analysis System Analysis, Insights and Forecast, 2020-2032
- 9.1. Market Analysis, Insights and Forecast - by Application
- 9.1.1. Research
- 9.1.2. Medical
- 9.1.3. Teaching
- 9.1.4. Others
- 9.2. Market Analysis, Insights and Forecast - by Types
- 9.2.1. UV Gel Imaging Analysis System
- 9.2.2. Blue Light Gel Imaging Analysis System
- 9.2.3. Others
- 9.1. Market Analysis, Insights and Forecast - by Application
- 10. Middle East & Africa Gel Imaging Analysis System Analysis, Insights and Forecast, 2020-2032
- 10.1. Market Analysis, Insights and Forecast - by Application
- 10.1.1. Research
- 10.1.2. Medical
- 10.1.3. Teaching
- 10.1.4. Others
- 10.2. Market Analysis, Insights and Forecast - by Types
- 10.2.1. UV Gel Imaging Analysis System
- 10.2.2. Blue Light Gel Imaging Analysis System
- 10.2.3. Others
- 10.1. Market Analysis, Insights and Forecast - by Application
- 11. Asia Pacific Gel Imaging Analysis System Analysis, Insights and Forecast, 2020-2032
- 11.1. Market Analysis, Insights and Forecast - by Application
- 11.1.1. Research
- 11.1.2. Medical
- 11.1.3. Teaching
- 11.1.4. Others
- 11.2. Market Analysis, Insights and Forecast - by Types
- 11.2.1. UV Gel Imaging Analysis System
- 11.2.2. Blue Light Gel Imaging Analysis System
- 11.2.3. Others
- 11.1. Market Analysis, Insights and Forecast - by Application
- 12. Competitive Analysis
- 12.1. Company Profiles
- 12.1.1 Thermo Fisher Scientific
- 12.1.1.1. Company Overview
- 12.1.1.2. Products
- 12.1.1.3. Company Financials
- 12.1.1.4. SWOT Analysis
- 12.1.2 Bio-Rad
- 12.1.2.1. Company Overview
- 12.1.2.2. Products
- 12.1.2.3. Company Financials
- 12.1.2.4. SWOT Analysis
- 12.1.3 Wealtec
- 12.1.3.1. Company Overview
- 12.1.3.2. Products
- 12.1.3.3. Company Financials
- 12.1.3.4. SWOT Analysis
- 12.1.4 GE Healthcare
- 12.1.4.1. Company Overview
- 12.1.4.2. Products
- 12.1.4.3. Company Financials
- 12.1.4.4. SWOT Analysis
- 12.1.5 Corning
- 12.1.5.1. Company Overview
- 12.1.5.2. Products
- 12.1.5.3. Company Financials
- 12.1.5.4. SWOT Analysis
- 12.1.6 Gel Company
- 12.1.6.1. Company Overview
- 12.1.6.2. Products
- 12.1.6.3. Company Financials
- 12.1.6.4. SWOT Analysis
- 12.1.7 ATTO
- 12.1.7.1. Company Overview
- 12.1.7.2. Products
- 12.1.7.3. Company Financials
- 12.1.7.4. SWOT Analysis
- 12.1.8 Cleaver Scientific
- 12.1.8.1. Company Overview
- 12.1.8.2. Products
- 12.1.8.3. Company Financials
- 12.1.8.4. SWOT Analysis
- 12.1.9 LI-COR
- 12.1.9.1. Company Overview
- 12.1.9.2. Products
- 12.1.9.3. Company Financials
- 12.1.9.4. SWOT Analysis
- 12.1.10 Analytik Jena
- 12.1.10.1. Company Overview
- 12.1.10.2. Products
- 12.1.10.3. Company Financials
- 12.1.10.4. SWOT Analysis
- 12.1.11 Tanon
- 12.1.11.1. Company Overview
- 12.1.11.2. Products
- 12.1.11.3. Company Financials
- 12.1.11.4. SWOT Analysis
- 12.1.12 Shenhua Science Technolog
- 12.1.12.1. Company Overview
- 12.1.12.2. Products
- 12.1.12.3. Company Financials
- 12.1.12.4. SWOT Analysis
- 12.1.13 Beijing Liuyi Biotechnology
- 12.1.13.1. Company Overview
- 12.1.13.2. Products
- 12.1.13.3. Company Financials
- 12.1.13.4. SWOT Analysis
- 12.1.14 Shanghai Jinpeng Analysis Instrument
- 12.1.14.1. Company Overview
- 12.1.14.2. Products
- 12.1.14.3. Company Financials
- 12.1.14.4. SWOT Analysis
- 12.1.15 CMVC lnternational GmbH
- 12.1.15.1. Company Overview
- 12.1.15.2. Products
- 12.1.15.3. Company Financials
- 12.1.15.4. SWOT Analysis
- 12.1.1 Thermo Fisher Scientific
- 12.2. Market Entropy
- 12.2.1 Company's Key Areas Served
- 12.2.2 Recent Developments
- 12.3. Company Market Share Analysis 2025
- 12.3.1 Top 5 Companies Market Share Analysis
- 12.3.2 Top 3 Companies Market Share Analysis
- 12.4. List of Potential Customers
- 13. Research Methodology
List of Figures
- Figure 1: Global Gel Imaging Analysis System Revenue Breakdown (million, %) by Region 2025 & 2033
- Figure 2: North America Gel Imaging Analysis System Revenue (million), by Application 2025 & 2033
- Figure 3: North America Gel Imaging Analysis System Revenue Share (%), by Application 2025 & 2033
- Figure 4: North America Gel Imaging Analysis System Revenue (million), by Types 2025 & 2033
- Figure 5: North America Gel Imaging Analysis System Revenue Share (%), by Types 2025 & 2033
- Figure 6: North America Gel Imaging Analysis System Revenue (million), by Country 2025 & 2033
- Figure 7: North America Gel Imaging Analysis System Revenue Share (%), by Country 2025 & 2033
- Figure 8: South America Gel Imaging Analysis System Revenue (million), by Application 2025 & 2033
- Figure 9: South America Gel Imaging Analysis System Revenue Share (%), by Application 2025 & 2033
- Figure 10: South America Gel Imaging Analysis System Revenue (million), by Types 2025 & 2033
- Figure 11: South America Gel Imaging Analysis System Revenue Share (%), by Types 2025 & 2033
- Figure 12: South America Gel Imaging Analysis System Revenue (million), by Country 2025 & 2033
- Figure 13: South America Gel Imaging Analysis System Revenue Share (%), by Country 2025 & 2033
- Figure 14: Europe Gel Imaging Analysis System Revenue (million), by Application 2025 & 2033
- Figure 15: Europe Gel Imaging Analysis System Revenue Share (%), by Application 2025 & 2033
- Figure 16: Europe Gel Imaging Analysis System Revenue (million), by Types 2025 & 2033
- Figure 17: Europe Gel Imaging Analysis System Revenue Share (%), by Types 2025 & 2033
- Figure 18: Europe Gel Imaging Analysis System Revenue (million), by Country 2025 & 2033
- Figure 19: Europe Gel Imaging Analysis System Revenue Share (%), by Country 2025 & 2033
- Figure 20: Middle East & Africa Gel Imaging Analysis System Revenue (million), by Application 2025 & 2033
- Figure 21: Middle East & Africa Gel Imaging Analysis System Revenue Share (%), by Application 2025 & 2033
- Figure 22: Middle East & Africa Gel Imaging Analysis System Revenue (million), by Types 2025 & 2033
- Figure 23: Middle East & Africa Gel Imaging Analysis System Revenue Share (%), by Types 2025 & 2033
- Figure 24: Middle East & Africa Gel Imaging Analysis System Revenue (million), by Country 2025 & 2033
- Figure 25: Middle East & Africa Gel Imaging Analysis System Revenue Share (%), by Country 2025 & 2033
- Figure 26: Asia Pacific Gel Imaging Analysis System Revenue (million), by Application 2025 & 2033
- Figure 27: Asia Pacific Gel Imaging Analysis System Revenue Share (%), by Application 2025 & 2033
- Figure 28: Asia Pacific Gel Imaging Analysis System Revenue (million), by Types 2025 & 2033
- Figure 29: Asia Pacific Gel Imaging Analysis System Revenue Share (%), by Types 2025 & 2033
- Figure 30: Asia Pacific Gel Imaging Analysis System Revenue (million), by Country 2025 & 2033
- Figure 31: Asia Pacific Gel Imaging Analysis System Revenue Share (%), by Country 2025 & 2033
List of Tables
- Table 1: Global Gel Imaging Analysis System Revenue million Forecast, by Application 2020 & 2033
- Table 2: Global Gel Imaging Analysis System Revenue million Forecast, by Types 2020 & 2033
- Table 3: Global Gel Imaging Analysis System Revenue million Forecast, by Region 2020 & 2033
- Table 4: Global Gel Imaging Analysis System Revenue million Forecast, by Application 2020 & 2033
- Table 5: Global Gel Imaging Analysis System Revenue million Forecast, by Types 2020 & 2033
- Table 6: Global Gel Imaging Analysis System Revenue million Forecast, by Country 2020 & 2033
- Table 7: United States Gel Imaging Analysis System Revenue (million) Forecast, by Application 2020 & 2033
- Table 8: Canada Gel Imaging Analysis System Revenue (million) Forecast, by Application 2020 & 2033
- Table 9: Mexico Gel Imaging Analysis System Revenue (million) Forecast, by Application 2020 & 2033
- Table 10: Global Gel Imaging Analysis System Revenue million Forecast, by Application 2020 & 2033
- Table 11: Global Gel Imaging Analysis System Revenue million Forecast, by Types 2020 & 2033
- Table 12: Global Gel Imaging Analysis System Revenue million Forecast, by Country 2020 & 2033
- Table 13: Brazil Gel Imaging Analysis System Revenue (million) Forecast, by Application 2020 & 2033
- Table 14: Argentina Gel Imaging Analysis System Revenue (million) Forecast, by Application 2020 & 2033
- Table 15: Rest of South America Gel Imaging Analysis System Revenue (million) Forecast, by Application 2020 & 2033
- Table 16: Global Gel Imaging Analysis System Revenue million Forecast, by Application 2020 & 2033
- Table 17: Global Gel Imaging Analysis System Revenue million Forecast, by Types 2020 & 2033
- Table 18: Global Gel Imaging Analysis System Revenue million Forecast, by Country 2020 & 2033
- Table 19: United Kingdom Gel Imaging Analysis System Revenue (million) Forecast, by Application 2020 & 2033
- Table 20: Germany Gel Imaging Analysis System Revenue (million) Forecast, by Application 2020 & 2033
- Table 21: France Gel Imaging Analysis System Revenue (million) Forecast, by Application 2020 & 2033
- Table 22: Italy Gel Imaging Analysis System Revenue (million) Forecast, by Application 2020 & 2033
- Table 23: Spain Gel Imaging Analysis System Revenue (million) Forecast, by Application 2020 & 2033
- Table 24: Russia Gel Imaging Analysis System Revenue (million) Forecast, by Application 2020 & 2033
- Table 25: Benelux Gel Imaging Analysis System Revenue (million) Forecast, by Application 2020 & 2033
- Table 26: Nordics Gel Imaging Analysis System Revenue (million) Forecast, by Application 2020 & 2033
- Table 27: Rest of Europe Gel Imaging Analysis System Revenue (million) Forecast, by Application 2020 & 2033
- Table 28: Global Gel Imaging Analysis System Revenue million Forecast, by Application 2020 & 2033
- Table 29: Global Gel Imaging Analysis System Revenue million Forecast, by Types 2020 & 2033
- Table 30: Global Gel Imaging Analysis System Revenue million Forecast, by Country 2020 & 2033
- Table 31: Turkey Gel Imaging Analysis System Revenue (million) Forecast, by Application 2020 & 2033
- Table 32: Israel Gel Imaging Analysis System Revenue (million) Forecast, by Application 2020 & 2033
- Table 33: GCC Gel Imaging Analysis System Revenue (million) Forecast, by Application 2020 & 2033
- Table 34: North Africa Gel Imaging Analysis System Revenue (million) Forecast, by Application 2020 & 2033
- Table 35: South Africa Gel Imaging Analysis System Revenue (million) Forecast, by Application 2020 & 2033
- Table 36: Rest of Middle East & Africa Gel Imaging Analysis System Revenue (million) Forecast, by Application 2020 & 2033
- Table 37: Global Gel Imaging Analysis System Revenue million Forecast, by Application 2020 & 2033
- Table 38: Global Gel Imaging Analysis System Revenue million Forecast, by Types 2020 & 2033
- Table 39: Global Gel Imaging Analysis System Revenue million Forecast, by Country 2020 & 2033
- Table 40: China Gel Imaging Analysis System Revenue (million) Forecast, by Application 2020 & 2033
- Table 41: India Gel Imaging Analysis System Revenue (million) Forecast, by Application 2020 & 2033
- Table 42: Japan Gel Imaging Analysis System Revenue (million) Forecast, by Application 2020 & 2033
- Table 43: South Korea Gel Imaging Analysis System Revenue (million) Forecast, by Application 2020 & 2033
- Table 44: ASEAN Gel Imaging Analysis System Revenue (million) Forecast, by Application 2020 & 2033
- Table 45: Oceania Gel Imaging Analysis System Revenue (million) Forecast, by Application 2020 & 2033
- Table 46: Rest of Asia Pacific Gel Imaging Analysis System Revenue (million) Forecast, by Application 2020 & 2033
Frequently Asked Questions
1. What is the projected Compound Annual Growth Rate (CAGR) of the Gel Imaging Analysis System?
The projected CAGR is approximately 6.21%.
2. Which companies are prominent players in the Gel Imaging Analysis System?
Key companies in the market include Thermo Fisher Scientific, Bio-Rad, Wealtec, GE Healthcare, Corning, Gel Company, ATTO, Cleaver Scientific, LI-COR, Analytik Jena, Tanon, Shenhua Science Technolog, Beijing Liuyi Biotechnology, Shanghai Jinpeng Analysis Instrument, CMVC lnternational GmbH.
3. What are the main segments of the Gel Imaging Analysis System?
The market segments include Application, Types.
4. Can you provide details about the market size?
The market size is estimated to be USD 373.9 million as of 2022.
5. What are some drivers contributing to market growth?
N/A
6. What are the notable trends driving market growth?
N/A
7. Are there any restraints impacting market growth?
N/A
8. Can you provide examples of recent developments in the market?
N/A
9. What pricing options are available for accessing the report?
Pricing options include single-user, multi-user, and enterprise licenses priced at USD 2900.00, USD 4350.00, and USD 5800.00 respectively.
10. Is the market size provided in terms of value or volume?
The market size is provided in terms of value, measured in million.
11. Are there any specific market keywords associated with the report?
Yes, the market keyword associated with the report is "Gel Imaging Analysis System," which aids in identifying and referencing the specific market segment covered.
12. How do I determine which pricing option suits my needs best?
The pricing options vary based on user requirements and access needs. Individual users may opt for single-user licenses, while businesses requiring broader access may choose multi-user or enterprise licenses for cost-effective access to the report.
13. Are there any additional resources or data provided in the Gel Imaging Analysis System report?
While the report offers comprehensive insights, it's advisable to review the specific contents or supplementary materials provided to ascertain if additional resources or data are available.
14. How can I stay updated on further developments or reports in the Gel Imaging Analysis System?
To stay informed about further developments, trends, and reports in the Gel Imaging Analysis System, consider subscribing to industry newsletters, following relevant companies and organizations, or regularly checking reputable industry news sources and publications.
Methodology
Step 1 - Identification of Relevant Samples Size from Population Database


Step 2 - Approaches for Defining Global Market Size (Value, Volume* & Price*)

Note*: In applicable scenarios
Step 3 - Data Sources
Primary Research
- Web Analytics
- Survey Reports
- Research Institute
- Latest Research Reports
- Opinion Leaders
Secondary Research
- Annual Reports
- White Paper
- Latest Press Release
- Industry Association
- Paid Database
- Investor Presentations

Step 4 - Data Triangulation
Involves using different sources of information in order to increase the validity of a study
These sources are likely to be stakeholders in a program - participants, other researchers, program staff, other community members, and so on.
Then we put all data in single framework & apply various statistical tools to find out the dynamic on the market.
During the analysis stage, feedback from the stakeholder groups would be compared to determine areas of agreement as well as areas of divergence