

Key Insights
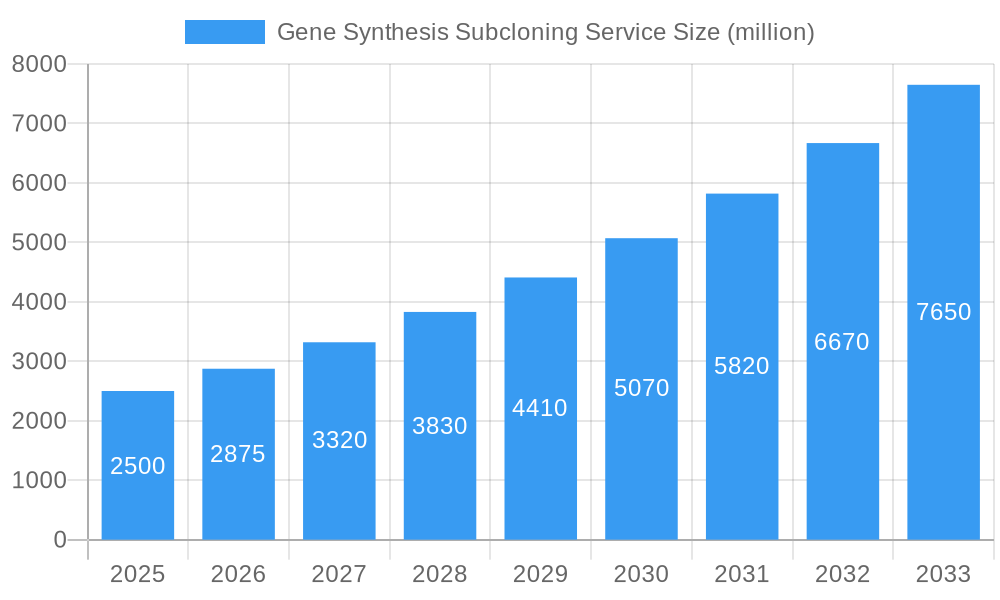
The Gene Synthesis Subcloning Service market is experiencing robust growth, driven by the increasing demand for customized gene sequences in various life science applications. The market, estimated at $2.5 billion in 2025, is projected to exhibit a Compound Annual Growth Rate (CAGR) of 15% from 2025 to 2033, reaching an estimated market value of approximately $7 billion by 2033. This expansion is fueled by several key factors. Firstly, the burgeoning biotechnology and pharmaceutical industries rely heavily on gene synthesis for drug discovery, development, and production, significantly boosting market demand. Secondly, advancements in gene editing technologies, such as CRISPR-Cas9, are creating new opportunities for gene synthesis and subcloning services. Thirdly, the growing adoption of personalized medicine necessitates the development of tailored therapeutic approaches, further driving market growth. The market is segmented by various factors, including service type (e.g., gene synthesis, subcloning, optimization), application (e.g., therapeutics, diagnostics, research), and end-user (e.g., pharmaceutical companies, research institutions).

Gene Synthesis Subcloning Service Market Size (In Billion)
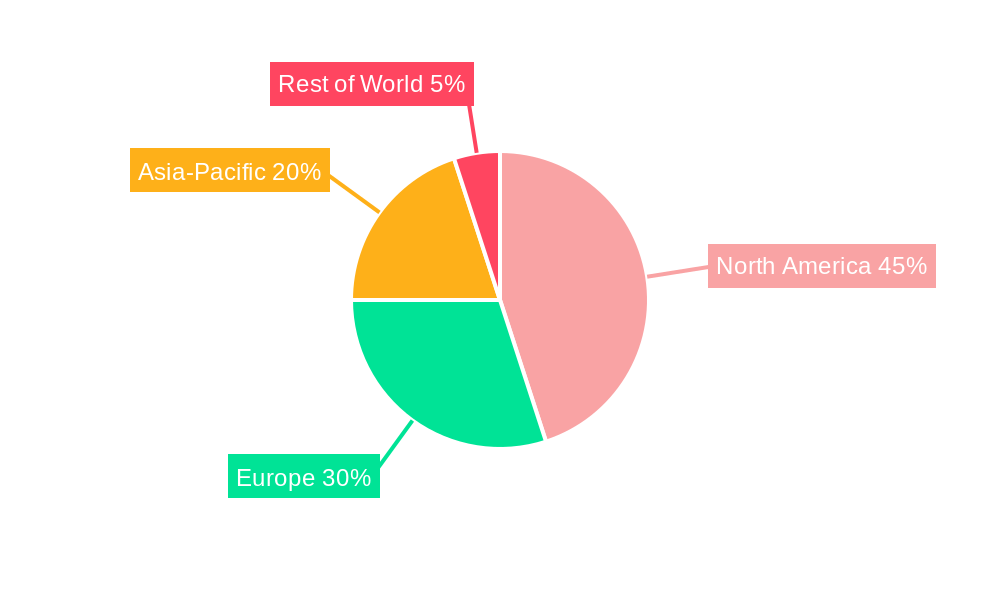
Competition in the Gene Synthesis Subcloning Service market is intense, with several key players vying for market share. Companies such as Thermo Fisher Scientific, Eurofins Scientific, and Merck KGaA hold significant market positions due to their established brand reputation, extensive product portfolios, and global reach. However, smaller, specialized companies like Genscript Biotech Corp and Synbio Technologies are also gaining traction through innovation and targeted market strategies. Geographic expansion and strategic collaborations are key competitive strategies within this sector. The North American market currently holds the largest share, primarily driven by strong R&D investments and the presence of major industry players. However, the Asia-Pacific region is anticipated to experience the fastest growth, fueled by increasing government support for biotechnology and rising demand from emerging economies. While the market faces potential restraints such as regulatory hurdles and high operational costs, the overall outlook remains highly optimistic due to the continuous advancements in biotechnology and the increasing reliance on gene synthesis for diverse applications.
Gene Synthesis Subcloning Service Company Market Share
Gene Synthesis Subcloning Service Market Report: 2019-2033
This comprehensive report provides a detailed analysis of the Gene Synthesis Subcloning Service market, offering invaluable insights for industry professionals, investors, and strategic decision-makers. The study period covers 2019-2033, with 2025 serving as the base and estimated year. The forecast period spans 2025-2033, and the historical period encompasses 2019-2024. The report projects a market valued at $XX million in 2025, exhibiting a Compound Annual Growth Rate (CAGR) of XX% throughout the forecast period.
Gene Synthesis Subcloning Service Market Structure & Innovation Trends
The Gene Synthesis Subcloning Service market is characterized by a moderately concentrated structure, with key players like Thermo Fisher Scientific, Eurofins Scientific, Merck KGaA, and Genscript Biotech Corp holding significant market share. The combined market share of these four companies in 2025 is estimated at xx%. Innovation is driven by advancements in gene editing technologies (CRISPR-Cas9, TALENs), automation, and high-throughput screening. Regulatory frameworks, such as those governing the use of genetically modified organisms (GMOs), significantly influence market growth. Product substitutes, such as traditional cloning methods, pose a competitive challenge, albeit limited by the efficiency and speed of gene synthesis subcloning. End-users primarily include academic research institutions, pharmaceutical companies, and biotechnology firms. M&A activity within the sector has been moderate, with several deals valued at over $XX million in the historical period. Notable deals include (Specific examples and values would be included here in the full report).
- Market Concentration: Moderately concentrated, with top 4 players holding xx% market share in 2025.
- Innovation Drivers: Advancements in gene editing, automation, and high-throughput screening.
- Regulatory Framework: Stringent regulations governing GMOs impact market growth.
- Product Substitutes: Traditional cloning methods pose limited competition.
- M&A Activity: Moderate activity, with several deals exceeding $XX million.
Gene Synthesis Subcloning Service Market Dynamics & Trends
The Gene Synthesis Subcloning Service market is experiencing robust growth driven by the increasing demand for customized gene constructs in various applications, including drug discovery, gene therapy, and synthetic biology. Technological advancements, particularly in next-generation sequencing (NGS) and gene editing, are further accelerating market expansion. Consumer preferences are shifting towards faster turnaround times, higher accuracy, and cost-effective services. Competitive dynamics are intense, with companies focusing on technological innovation, strategic partnerships, and expansion into new markets to gain a competitive edge. The market penetration of gene synthesis subcloning services is increasing steadily, particularly in the pharmaceutical and biotechnology sectors. The market is expected to reach $XX million by 2033.
Dominant Regions & Segments in Gene Synthesis Subcloning Service
North America currently holds the dominant position in the Gene Synthesis Subcloning Service market, driven by factors such as robust R&D investments, a well-established biotechnology industry, and stringent regulatory frameworks that ensure high quality.
- Key Drivers in North America:
- High R&D spending.
- Strong presence of major players.
- Supportive government policies and funding.
- Well-developed infrastructure.
The dominance of North America stems from a confluence of factors: strong presence of key players, high investment in R&D, and supportive government policies. European and Asian markets are also witnessing significant growth, driven by increased investments in life sciences and technological advancements. Within the market segments, the demand for custom gene synthesis services is high, owing to the requirement of tailor-made constructs for specific research and therapeutic applications. This segment is projected to account for XX% of the total market by 2033.
Gene Synthesis Subcloning Service Product Innovations
Recent product innovations have focused on improving accuracy, throughput, and cost-effectiveness. Advances in automation and high-throughput screening technologies have enhanced the efficiency of the process. Companies are also developing novel platforms that integrate multiple steps, such as gene synthesis, subcloning, and vector construction, into a single workflow. These streamlined workflows offer significant advantages in terms of speed and cost. The market is also witnessing the emergence of more sophisticated and specialized subcloning services catering to specific applications and research needs.
Report Scope & Segmentation Analysis
This report segments the Gene Synthesis Subcloning Service market by type (e.g., standard subcloning, Gibson Assembly, Golden Gate Assembly), application (e.g., drug discovery, gene therapy, synthetic biology), end-user (e.g., academic research institutions, pharmaceutical companies, biotechnology companies), and region (North America, Europe, Asia-Pacific, and Rest of World). Each segment exhibits different growth trajectories and competitive dynamics. For example, the drug discovery segment is projected to experience the highest growth rate over the forecast period due to the rising demand for novel therapeutics.
Key Drivers of Gene Synthesis Subcloning Service Growth
Several factors contribute to the growth of the Gene Synthesis Subcloning Service market. Firstly, the increasing demand for gene-based therapies and biopharmaceuticals fuels the need for efficient and cost-effective gene synthesis and subcloning services. Secondly, continuous advancements in gene editing technologies and automation further propel market expansion. Finally, government initiatives and funding in life sciences research support the growth of this industry. These factors collectively contribute to the overall expansion of the market.
Challenges in the Gene Synthesis Subcloning Service Sector
The Gene Synthesis Subcloning Service sector faces certain challenges. Regulatory hurdles and complexities associated with GMO regulations can cause delays and increase costs. Fluctuations in raw material prices and supply chain disruptions can impact service delivery and profitability. Furthermore, intense competition from established players and emerging entrants necessitates continuous innovation and strategic agility to maintain market share.
Emerging Opportunities in Gene Synthesis Subcloning Service
Emerging opportunities lie in expanding into new markets, particularly in developing economies with growing life science research initiatives. Additionally, focusing on niche applications like personalized medicine and advanced gene therapy presents significant potential. Integrating artificial intelligence (AI) and machine learning (ML) into service workflows can enhance efficiency and accuracy, creating new opportunities for differentiation and market leadership.
Leading Players in the Gene Synthesis Subcloning Service Market
- Thermo Fisher Scientific
- Eurofins Scientific
- Merck KGaA
- Genscript Biotech Corp
- Synbio Technologies
- Bio Basic
- Bioneer Corporation
- Applied Biological Materials
- Takara Bio
- Canvax Biotech
- Codex DNA
- Azenta US
- Macrogen
- InvivoGen
- BioCat GmbH
- BEX Co., Ltd
- Lonza Group
Key Developments in Gene Synthesis Subcloning Service Industry
- 2022-Q4: Genscript Biotech Corp launched a new high-throughput gene synthesis platform.
- 2023-Q1: Thermo Fisher Scientific acquired a smaller gene synthesis company, expanding its service offerings.
- 2023-Q3: Eurofins Scientific announced a strategic partnership to improve its subcloning capabilities (Specific examples and values would be included here in the full report).
(Further details on key developments would be included here in the full report)
Future Outlook for Gene Synthesis Subcloning Service Market
The Gene Synthesis Subcloning Service market is poised for continued growth, driven by advancements in gene editing technologies, increased demand for personalized medicine, and rising investments in life science research. Strategic partnerships and technological innovations will be crucial for companies to maintain a competitive edge and capitalize on emerging opportunities. The market is projected to reach $XX million by 2033.
Gene Synthesis Subcloning Service Segmentation
-
1. Application
- 1.1. Academic and Research Institutions
- 1.2. Clinical Laboratories
- 1.3. Pharmaceutical and Biotechnology Companies
- 1.4. Other
-
2. Types
- 2.1. Stranded Gene
- 2.2. Complex Gene
- 2.3. Others
Gene Synthesis Subcloning Service Segmentation By Geography
-
1. North America
- 1.1. United States
- 1.2. Canada
- 1.3. Mexico
-
2. South America
- 2.1. Brazil
- 2.2. Argentina
- 2.3. Rest of South America
-
3. Europe
- 3.1. United Kingdom
- 3.2. Germany
- 3.3. France
- 3.4. Italy
- 3.5. Spain
- 3.6. Russia
- 3.7. Benelux
- 3.8. Nordics
- 3.9. Rest of Europe
-
4. Middle East & Africa
- 4.1. Turkey
- 4.2. Israel
- 4.3. GCC
- 4.4. North Africa
- 4.5. South Africa
- 4.6. Rest of Middle East & Africa
-
5. Asia Pacific
- 5.1. China
- 5.2. India
- 5.3. Japan
- 5.4. South Korea
- 5.5. ASEAN
- 5.6. Oceania
- 5.7. Rest of Asia Pacific
Gene Synthesis Subcloning Service Regional Market Share
Geographic Coverage of Gene Synthesis Subcloning Service
Gene Synthesis Subcloning Service REPORT HIGHLIGHTS
| Aspects | Details |
|---|---|
| Study Period | 2020-2034 |
| Base Year | 2025 |
| Estimated Year | 2026 |
| Forecast Period | 2026-2034 |
| Historical Period | 2020-2025 |
| Growth Rate | CAGR of 14.2% from 2020-2034 |
| Segmentation |
|
Table of Contents
- 1. Introduction
- 1.1. Research Scope
- 1.2. Market Segmentation
- 1.3. Research Objective
- 1.4. Definitions and Assumptions
- 2. Executive Summary
- 2.1. Market Snapshot
- 3. Market Dynamics
- 3.1. Market Drivers
- 3.2. Market Restrains
- 3.3. Market Trends
- 3.4. Market Opportunities
- 4. Market Factor Analysis
- 4.1. Porters Five Forces
- 4.1.1. Bargaining Power of Suppliers
- 4.1.2. Bargaining Power of Buyers
- 4.1.3. Threat of New Entrants
- 4.1.4. Threat of Substitutes
- 4.1.5. Competitive Rivalry
- 4.2. PESTEL analysis
- 4.3. BCG Analysis
- 4.3.1. Stars (High Growth, High Market Share)
- 4.3.2. Cash Cows (Low Growth, High Market Share)
- 4.3.3. Question Mark (High Growth, Low Market Share)
- 4.3.4. Dogs (Low Growth, Low Market Share)
- 4.4. Ansoff Matrix Analysis
- 4.5. Supply Chain Analysis
- 4.6. Regulatory Landscape
- 4.7. Current Market Potential and Opportunity Assessment (TAM–SAM–SOM Framework)
- 4.8. PRI Analyst Note
- 4.1. Porters Five Forces
- 5. Market Analysis, Insights and Forecast 2021-2033
- 5.1. Market Analysis, Insights and Forecast - by Application
- 5.1.1. Academic and Research Institutions
- 5.1.2. Clinical Laboratories
- 5.1.3. Pharmaceutical and Biotechnology Companies
- 5.1.4. Other
- 5.2. Market Analysis, Insights and Forecast - by Types
- 5.2.1. Stranded Gene
- 5.2.2. Complex Gene
- 5.2.3. Others
- 5.3. Market Analysis, Insights and Forecast - by Region
- 5.3.1. North America
- 5.3.2. South America
- 5.3.3. Europe
- 5.3.4. Middle East & Africa
- 5.3.5. Asia Pacific
- 5.1. Market Analysis, Insights and Forecast - by Application
- 6. Global Gene Synthesis Subcloning Service Analysis, Insights and Forecast, 2021-2033
- 6.1. Market Analysis, Insights and Forecast - by Application
- 6.1.1. Academic and Research Institutions
- 6.1.2. Clinical Laboratories
- 6.1.3. Pharmaceutical and Biotechnology Companies
- 6.1.4. Other
- 6.2. Market Analysis, Insights and Forecast - by Types
- 6.2.1. Stranded Gene
- 6.2.2. Complex Gene
- 6.2.3. Others
- 6.1. Market Analysis, Insights and Forecast - by Application
- 7. North America Gene Synthesis Subcloning Service Analysis, Insights and Forecast, 2020-2032
- 7.1. Market Analysis, Insights and Forecast - by Application
- 7.1.1. Academic and Research Institutions
- 7.1.2. Clinical Laboratories
- 7.1.3. Pharmaceutical and Biotechnology Companies
- 7.1.4. Other
- 7.2. Market Analysis, Insights and Forecast - by Types
- 7.2.1. Stranded Gene
- 7.2.2. Complex Gene
- 7.2.3. Others
- 7.1. Market Analysis, Insights and Forecast - by Application
- 8. South America Gene Synthesis Subcloning Service Analysis, Insights and Forecast, 2020-2032
- 8.1. Market Analysis, Insights and Forecast - by Application
- 8.1.1. Academic and Research Institutions
- 8.1.2. Clinical Laboratories
- 8.1.3. Pharmaceutical and Biotechnology Companies
- 8.1.4. Other
- 8.2. Market Analysis, Insights and Forecast - by Types
- 8.2.1. Stranded Gene
- 8.2.2. Complex Gene
- 8.2.3. Others
- 8.1. Market Analysis, Insights and Forecast - by Application
- 9. Europe Gene Synthesis Subcloning Service Analysis, Insights and Forecast, 2020-2032
- 9.1. Market Analysis, Insights and Forecast - by Application
- 9.1.1. Academic and Research Institutions
- 9.1.2. Clinical Laboratories
- 9.1.3. Pharmaceutical and Biotechnology Companies
- 9.1.4. Other
- 9.2. Market Analysis, Insights and Forecast - by Types
- 9.2.1. Stranded Gene
- 9.2.2. Complex Gene
- 9.2.3. Others
- 9.1. Market Analysis, Insights and Forecast - by Application
- 10. Middle East & Africa Gene Synthesis Subcloning Service Analysis, Insights and Forecast, 2020-2032
- 10.1. Market Analysis, Insights and Forecast - by Application
- 10.1.1. Academic and Research Institutions
- 10.1.2. Clinical Laboratories
- 10.1.3. Pharmaceutical and Biotechnology Companies
- 10.1.4. Other
- 10.2. Market Analysis, Insights and Forecast - by Types
- 10.2.1. Stranded Gene
- 10.2.2. Complex Gene
- 10.2.3. Others
- 10.1. Market Analysis, Insights and Forecast - by Application
- 11. Asia Pacific Gene Synthesis Subcloning Service Analysis, Insights and Forecast, 2020-2032
- 11.1. Market Analysis, Insights and Forecast - by Application
- 11.1.1. Academic and Research Institutions
- 11.1.2. Clinical Laboratories
- 11.1.3. Pharmaceutical and Biotechnology Companies
- 11.1.4. Other
- 11.2. Market Analysis, Insights and Forecast - by Types
- 11.2.1. Stranded Gene
- 11.2.2. Complex Gene
- 11.2.3. Others
- 11.1. Market Analysis, Insights and Forecast - by Application
- 12. Competitive Analysis
- 12.1. Company Profiles
- 12.1.1 Thermo Fisher Scientific
- 12.1.1.1. Company Overview
- 12.1.1.2. Products
- 12.1.1.3. Company Financials
- 12.1.1.4. SWOT Analysis
- 12.1.2 Eurofins Scientific
- 12.1.2.1. Company Overview
- 12.1.2.2. Products
- 12.1.2.3. Company Financials
- 12.1.2.4. SWOT Analysis
- 12.1.3 Merck KGaA
- 12.1.3.1. Company Overview
- 12.1.3.2. Products
- 12.1.3.3. Company Financials
- 12.1.3.4. SWOT Analysis
- 12.1.4 Genscript Biotech Corp
- 12.1.4.1. Company Overview
- 12.1.4.2. Products
- 12.1.4.3. Company Financials
- 12.1.4.4. SWOT Analysis
- 12.1.5 Synbio Technologies
- 12.1.5.1. Company Overview
- 12.1.5.2. Products
- 12.1.5.3. Company Financials
- 12.1.5.4. SWOT Analysis
- 12.1.6 Bio Basic
- 12.1.6.1. Company Overview
- 12.1.6.2. Products
- 12.1.6.3. Company Financials
- 12.1.6.4. SWOT Analysis
- 12.1.7 Bioneer Corporation
- 12.1.7.1. Company Overview
- 12.1.7.2. Products
- 12.1.7.3. Company Financials
- 12.1.7.4. SWOT Analysis
- 12.1.8 Applied Biological Materials
- 12.1.8.1. Company Overview
- 12.1.8.2. Products
- 12.1.8.3. Company Financials
- 12.1.8.4. SWOT Analysis
- 12.1.9 Takara Bio
- 12.1.9.1. Company Overview
- 12.1.9.2. Products
- 12.1.9.3. Company Financials
- 12.1.9.4. SWOT Analysis
- 12.1.10 Canvax Biotech
- 12.1.10.1. Company Overview
- 12.1.10.2. Products
- 12.1.10.3. Company Financials
- 12.1.10.4. SWOT Analysis
- 12.1.11 Codex DNA
- 12.1.11.1. Company Overview
- 12.1.11.2. Products
- 12.1.11.3. Company Financials
- 12.1.11.4. SWOT Analysis
- 12.1.12 Azenta US
- 12.1.12.1. Company Overview
- 12.1.12.2. Products
- 12.1.12.3. Company Financials
- 12.1.12.4. SWOT Analysis
- 12.1.13 Macrogen
- 12.1.13.1. Company Overview
- 12.1.13.2. Products
- 12.1.13.3. Company Financials
- 12.1.13.4. SWOT Analysis
- 12.1.14 InvivoGen
- 12.1.14.1. Company Overview
- 12.1.14.2. Products
- 12.1.14.3. Company Financials
- 12.1.14.4. SWOT Analysis
- 12.1.15 BioCat GmbH
- 12.1.15.1. Company Overview
- 12.1.15.2. Products
- 12.1.15.3. Company Financials
- 12.1.15.4. SWOT Analysis
- 12.1.16 BEX Co.
- 12.1.16.1. Company Overview
- 12.1.16.2. Products
- 12.1.16.3. Company Financials
- 12.1.16.4. SWOT Analysis
- 12.1.17 Ltd
- 12.1.17.1. Company Overview
- 12.1.17.2. Products
- 12.1.17.3. Company Financials
- 12.1.17.4. SWOT Analysis
- 12.1.18 Lonza Group
- 12.1.18.1. Company Overview
- 12.1.18.2. Products
- 12.1.18.3. Company Financials
- 12.1.18.4. SWOT Analysis
- 12.1.1 Thermo Fisher Scientific
- 12.2. Market Entropy
- 12.2.1 Company's Key Areas Served
- 12.2.2 Recent Developments
- 12.3. Company Market Share Analysis 2025
- 12.3.1 Top 5 Companies Market Share Analysis
- 12.3.2 Top 3 Companies Market Share Analysis
- 12.4. List of Potential Customers
- 13. Research Methodology
List of Figures
- Figure 1: Global Gene Synthesis Subcloning Service Revenue Breakdown (undefined, %) by Region 2025 & 2033
- Figure 2: North America Gene Synthesis Subcloning Service Revenue (undefined), by Application 2025 & 2033
- Figure 3: North America Gene Synthesis Subcloning Service Revenue Share (%), by Application 2025 & 2033
- Figure 4: North America Gene Synthesis Subcloning Service Revenue (undefined), by Types 2025 & 2033
- Figure 5: North America Gene Synthesis Subcloning Service Revenue Share (%), by Types 2025 & 2033
- Figure 6: North America Gene Synthesis Subcloning Service Revenue (undefined), by Country 2025 & 2033
- Figure 7: North America Gene Synthesis Subcloning Service Revenue Share (%), by Country 2025 & 2033
- Figure 8: South America Gene Synthesis Subcloning Service Revenue (undefined), by Application 2025 & 2033
- Figure 9: South America Gene Synthesis Subcloning Service Revenue Share (%), by Application 2025 & 2033
- Figure 10: South America Gene Synthesis Subcloning Service Revenue (undefined), by Types 2025 & 2033
- Figure 11: South America Gene Synthesis Subcloning Service Revenue Share (%), by Types 2025 & 2033
- Figure 12: South America Gene Synthesis Subcloning Service Revenue (undefined), by Country 2025 & 2033
- Figure 13: South America Gene Synthesis Subcloning Service Revenue Share (%), by Country 2025 & 2033
- Figure 14: Europe Gene Synthesis Subcloning Service Revenue (undefined), by Application 2025 & 2033
- Figure 15: Europe Gene Synthesis Subcloning Service Revenue Share (%), by Application 2025 & 2033
- Figure 16: Europe Gene Synthesis Subcloning Service Revenue (undefined), by Types 2025 & 2033
- Figure 17: Europe Gene Synthesis Subcloning Service Revenue Share (%), by Types 2025 & 2033
- Figure 18: Europe Gene Synthesis Subcloning Service Revenue (undefined), by Country 2025 & 2033
- Figure 19: Europe Gene Synthesis Subcloning Service Revenue Share (%), by Country 2025 & 2033
- Figure 20: Middle East & Africa Gene Synthesis Subcloning Service Revenue (undefined), by Application 2025 & 2033
- Figure 21: Middle East & Africa Gene Synthesis Subcloning Service Revenue Share (%), by Application 2025 & 2033
- Figure 22: Middle East & Africa Gene Synthesis Subcloning Service Revenue (undefined), by Types 2025 & 2033
- Figure 23: Middle East & Africa Gene Synthesis Subcloning Service Revenue Share (%), by Types 2025 & 2033
- Figure 24: Middle East & Africa Gene Synthesis Subcloning Service Revenue (undefined), by Country 2025 & 2033
- Figure 25: Middle East & Africa Gene Synthesis Subcloning Service Revenue Share (%), by Country 2025 & 2033
- Figure 26: Asia Pacific Gene Synthesis Subcloning Service Revenue (undefined), by Application 2025 & 2033
- Figure 27: Asia Pacific Gene Synthesis Subcloning Service Revenue Share (%), by Application 2025 & 2033
- Figure 28: Asia Pacific Gene Synthesis Subcloning Service Revenue (undefined), by Types 2025 & 2033
- Figure 29: Asia Pacific Gene Synthesis Subcloning Service Revenue Share (%), by Types 2025 & 2033
- Figure 30: Asia Pacific Gene Synthesis Subcloning Service Revenue (undefined), by Country 2025 & 2033
- Figure 31: Asia Pacific Gene Synthesis Subcloning Service Revenue Share (%), by Country 2025 & 2033
List of Tables
- Table 1: Global Gene Synthesis Subcloning Service Revenue undefined Forecast, by Application 2020 & 2033
- Table 2: Global Gene Synthesis Subcloning Service Revenue undefined Forecast, by Types 2020 & 2033
- Table 3: Global Gene Synthesis Subcloning Service Revenue undefined Forecast, by Region 2020 & 2033
- Table 4: Global Gene Synthesis Subcloning Service Revenue undefined Forecast, by Application 2020 & 2033
- Table 5: Global Gene Synthesis Subcloning Service Revenue undefined Forecast, by Types 2020 & 2033
- Table 6: Global Gene Synthesis Subcloning Service Revenue undefined Forecast, by Country 2020 & 2033
- Table 7: United States Gene Synthesis Subcloning Service Revenue (undefined) Forecast, by Application 2020 & 2033
- Table 8: Canada Gene Synthesis Subcloning Service Revenue (undefined) Forecast, by Application 2020 & 2033
- Table 9: Mexico Gene Synthesis Subcloning Service Revenue (undefined) Forecast, by Application 2020 & 2033
- Table 10: Global Gene Synthesis Subcloning Service Revenue undefined Forecast, by Application 2020 & 2033
- Table 11: Global Gene Synthesis Subcloning Service Revenue undefined Forecast, by Types 2020 & 2033
- Table 12: Global Gene Synthesis Subcloning Service Revenue undefined Forecast, by Country 2020 & 2033
- Table 13: Brazil Gene Synthesis Subcloning Service Revenue (undefined) Forecast, by Application 2020 & 2033
- Table 14: Argentina Gene Synthesis Subcloning Service Revenue (undefined) Forecast, by Application 2020 & 2033
- Table 15: Rest of South America Gene Synthesis Subcloning Service Revenue (undefined) Forecast, by Application 2020 & 2033
- Table 16: Global Gene Synthesis Subcloning Service Revenue undefined Forecast, by Application 2020 & 2033
- Table 17: Global Gene Synthesis Subcloning Service Revenue undefined Forecast, by Types 2020 & 2033
- Table 18: Global Gene Synthesis Subcloning Service Revenue undefined Forecast, by Country 2020 & 2033
- Table 19: United Kingdom Gene Synthesis Subcloning Service Revenue (undefined) Forecast, by Application 2020 & 2033
- Table 20: Germany Gene Synthesis Subcloning Service Revenue (undefined) Forecast, by Application 2020 & 2033
- Table 21: France Gene Synthesis Subcloning Service Revenue (undefined) Forecast, by Application 2020 & 2033
- Table 22: Italy Gene Synthesis Subcloning Service Revenue (undefined) Forecast, by Application 2020 & 2033
- Table 23: Spain Gene Synthesis Subcloning Service Revenue (undefined) Forecast, by Application 2020 & 2033
- Table 24: Russia Gene Synthesis Subcloning Service Revenue (undefined) Forecast, by Application 2020 & 2033
- Table 25: Benelux Gene Synthesis Subcloning Service Revenue (undefined) Forecast, by Application 2020 & 2033
- Table 26: Nordics Gene Synthesis Subcloning Service Revenue (undefined) Forecast, by Application 2020 & 2033
- Table 27: Rest of Europe Gene Synthesis Subcloning Service Revenue (undefined) Forecast, by Application 2020 & 2033
- Table 28: Global Gene Synthesis Subcloning Service Revenue undefined Forecast, by Application 2020 & 2033
- Table 29: Global Gene Synthesis Subcloning Service Revenue undefined Forecast, by Types 2020 & 2033
- Table 30: Global Gene Synthesis Subcloning Service Revenue undefined Forecast, by Country 2020 & 2033
- Table 31: Turkey Gene Synthesis Subcloning Service Revenue (undefined) Forecast, by Application 2020 & 2033
- Table 32: Israel Gene Synthesis Subcloning Service Revenue (undefined) Forecast, by Application 2020 & 2033
- Table 33: GCC Gene Synthesis Subcloning Service Revenue (undefined) Forecast, by Application 2020 & 2033
- Table 34: North Africa Gene Synthesis Subcloning Service Revenue (undefined) Forecast, by Application 2020 & 2033
- Table 35: South Africa Gene Synthesis Subcloning Service Revenue (undefined) Forecast, by Application 2020 & 2033
- Table 36: Rest of Middle East & Africa Gene Synthesis Subcloning Service Revenue (undefined) Forecast, by Application 2020 & 2033
- Table 37: Global Gene Synthesis Subcloning Service Revenue undefined Forecast, by Application 2020 & 2033
- Table 38: Global Gene Synthesis Subcloning Service Revenue undefined Forecast, by Types 2020 & 2033
- Table 39: Global Gene Synthesis Subcloning Service Revenue undefined Forecast, by Country 2020 & 2033
- Table 40: China Gene Synthesis Subcloning Service Revenue (undefined) Forecast, by Application 2020 & 2033
- Table 41: India Gene Synthesis Subcloning Service Revenue (undefined) Forecast, by Application 2020 & 2033
- Table 42: Japan Gene Synthesis Subcloning Service Revenue (undefined) Forecast, by Application 2020 & 2033
- Table 43: South Korea Gene Synthesis Subcloning Service Revenue (undefined) Forecast, by Application 2020 & 2033
- Table 44: ASEAN Gene Synthesis Subcloning Service Revenue (undefined) Forecast, by Application 2020 & 2033
- Table 45: Oceania Gene Synthesis Subcloning Service Revenue (undefined) Forecast, by Application 2020 & 2033
- Table 46: Rest of Asia Pacific Gene Synthesis Subcloning Service Revenue (undefined) Forecast, by Application 2020 & 2033
Frequently Asked Questions
1. What is the projected Compound Annual Growth Rate (CAGR) of the Gene Synthesis Subcloning Service?
The projected CAGR is approximately 14.2%.
2. Which companies are prominent players in the Gene Synthesis Subcloning Service?
Key companies in the market include Thermo Fisher Scientific, Eurofins Scientific, Merck KGaA, Genscript Biotech Corp, Synbio Technologies, Bio Basic, Bioneer Corporation, Applied Biological Materials, Takara Bio, Canvax Biotech, Codex DNA, Azenta US, Macrogen, InvivoGen, BioCat GmbH, BEX Co., Ltd, Lonza Group.
3. What are the main segments of the Gene Synthesis Subcloning Service?
The market segments include Application, Types.
4. Can you provide details about the market size?
The market size is estimated to be USD XXX N/A as of 2022.
5. What are some drivers contributing to market growth?
N/A
6. What are the notable trends driving market growth?
N/A
7. Are there any restraints impacting market growth?
N/A
8. Can you provide examples of recent developments in the market?
N/A
9. What pricing options are available for accessing the report?
Pricing options include single-user, multi-user, and enterprise licenses priced at USD 4350.00, USD 6525.00, and USD 8700.00 respectively.
10. Is the market size provided in terms of value or volume?
The market size is provided in terms of value, measured in N/A.
11. Are there any specific market keywords associated with the report?
Yes, the market keyword associated with the report is "Gene Synthesis Subcloning Service," which aids in identifying and referencing the specific market segment covered.
12. How do I determine which pricing option suits my needs best?
The pricing options vary based on user requirements and access needs. Individual users may opt for single-user licenses, while businesses requiring broader access may choose multi-user or enterprise licenses for cost-effective access to the report.
13. Are there any additional resources or data provided in the Gene Synthesis Subcloning Service report?
While the report offers comprehensive insights, it's advisable to review the specific contents or supplementary materials provided to ascertain if additional resources or data are available.
14. How can I stay updated on further developments or reports in the Gene Synthesis Subcloning Service?
To stay informed about further developments, trends, and reports in the Gene Synthesis Subcloning Service, consider subscribing to industry newsletters, following relevant companies and organizations, or regularly checking reputable industry news sources and publications.
Methodology
Step 1 - Identification of Relevant Samples Size from Population Database


Step 2 - Approaches for Defining Global Market Size (Value, Volume* & Price*)

Note*: In applicable scenarios
Step 3 - Data Sources
Primary Research
- Web Analytics
- Survey Reports
- Research Institute
- Latest Research Reports
- Opinion Leaders
Secondary Research
- Annual Reports
- White Paper
- Latest Press Release
- Industry Association
- Paid Database
- Investor Presentations

Step 4 - Data Triangulation
Involves using different sources of information in order to increase the validity of a study
These sources are likely to be stakeholders in a program - participants, other researchers, program staff, other community members, and so on.
Then we put all data in single framework & apply various statistical tools to find out the dynamic on the market.
During the analysis stage, feedback from the stakeholder groups would be compared to determine areas of agreement as well as areas of divergence