
Key Insights
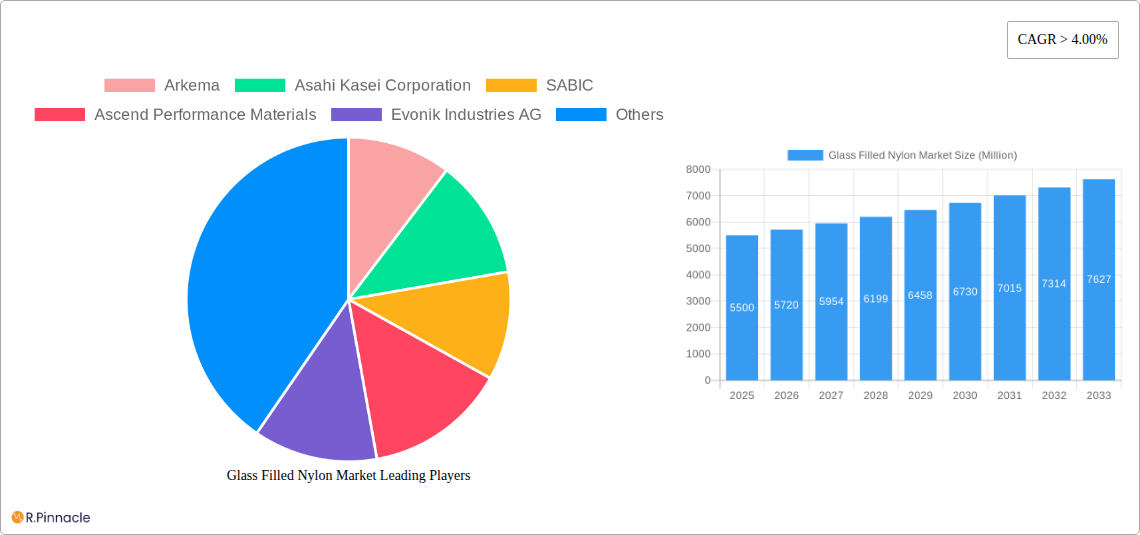
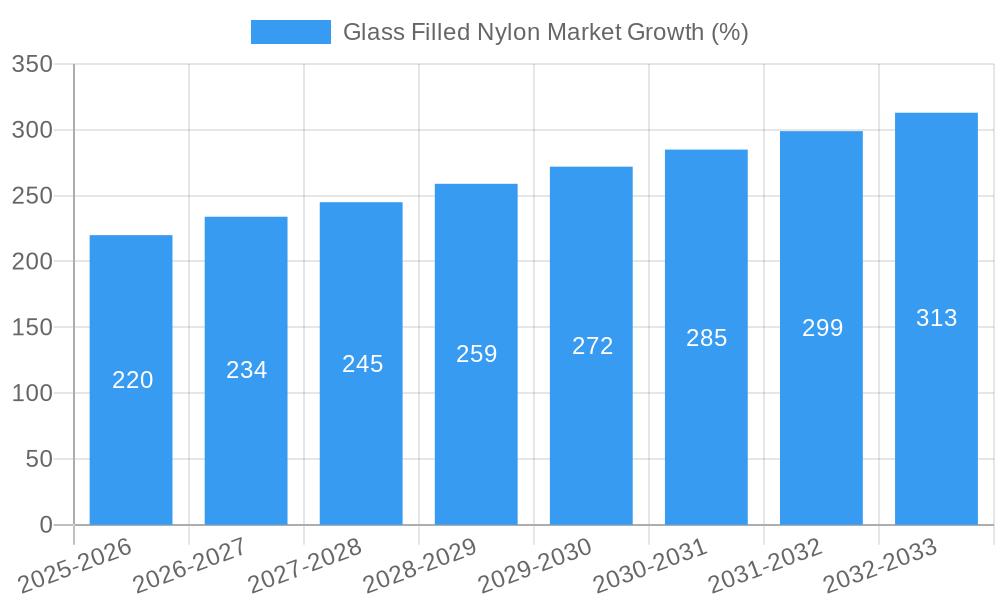
The global glass-filled nylon market is experiencing robust growth, driven by its exceptional mechanical properties, cost-effectiveness, and diverse applications across various industries. The market's Compound Annual Growth Rate (CAGR) exceeding 4% indicates a consistent expansion, projected to continue throughout the forecast period (2025-2033). Key drivers include the increasing demand for lightweight yet durable materials in the automotive sector (particularly for components requiring high strength-to-weight ratios), the expansion of the electrical and electronics industry (utilizing glass-filled nylon for insulation and structural components), and the growing adoption of advanced manufacturing techniques like injection molding and extrusion molding that enhance efficiency and precision in production. Different glass fiber content (10%, 20%, 30%) caters to varied application needs, contributing to market segmentation. Polyamide 6 and Polyamide 66 are the dominant types, reflecting their superior performance characteristics. While the market faces challenges such as price fluctuations in raw materials and competition from alternative materials, these are largely offset by ongoing innovation and the development of specialized glass-filled nylon compounds tailored for specific applications, further fueling market expansion.
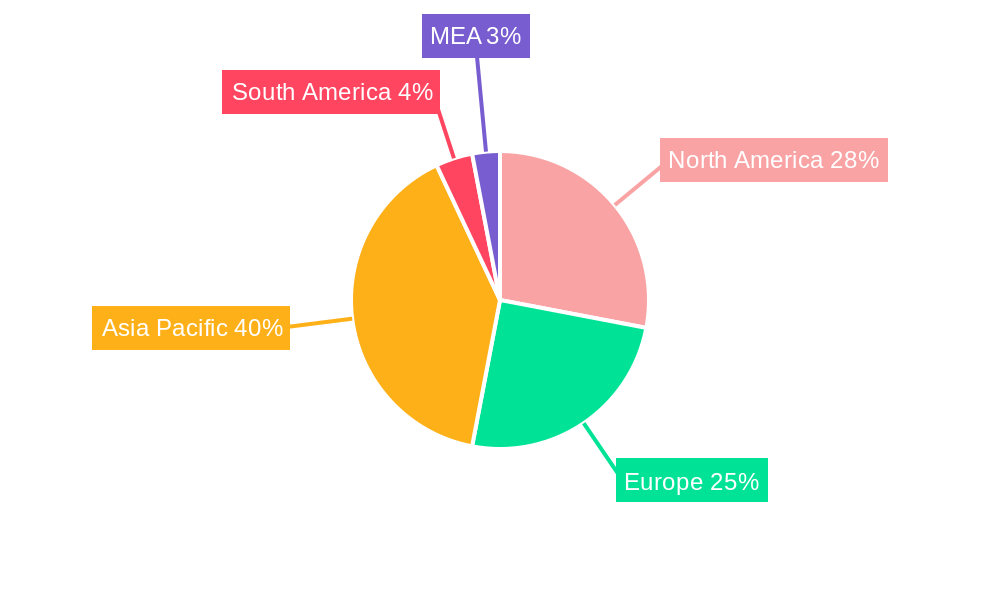
The market is geographically diverse, with North America, Europe, and Asia Pacific representing major regions. While precise regional market shares require further data, a reasonable estimation based on industry trends suggests that Asia Pacific, driven by strong manufacturing growth in China and India, may hold the largest share, followed by North America and Europe. The presence of prominent market players like Arkema, Asahi Kasei Corporation, SABIC, and BASF SE signifies a competitive landscape, encouraging innovation and product diversification. The ongoing development of sustainable and high-performance glass-filled nylon compounds further enhances market potential, catering to the rising demands for environmentally responsible solutions and high-performance materials in various industries. This sustained growth trajectory indicates a promising future for the glass-filled nylon market, with continued expansion anticipated throughout the forecast period.
This in-depth report provides a comprehensive analysis of the Glass Filled Nylon market, offering invaluable insights for industry professionals, investors, and strategic decision-makers. Covering the period from 2019 to 2033, with 2025 as the base year, this report meticulously examines market dynamics, segmentation, key players, and future growth prospects. The study utilizes a robust methodology to forecast market trends and provides actionable intelligence to navigate the complexities of this dynamic market.
Glass Filled Nylon Market Structure & Innovation Trends
This section analyzes the competitive landscape of the Glass Filled Nylon market, focusing on market concentration, innovation drivers, regulatory impacts, and key industry activities. The report examines the market share held by leading players including Arkema, Asahi Kasei Corporation, SABIC, Ascend Performance Materials, Evonik Industries AG, LANXESS, BASF SE, NYLATECH, Radici Partecipazioni SpA, and Ensinger. The analysis includes an assessment of the market concentration ratio (CRx), revealing the degree of market dominance. Furthermore, the report explores the role of innovation in driving market growth, highlighting key technological advancements and their impact on product development. This includes an evaluation of regulatory frameworks and their influence on market expansion, as well as an analysis of product substitutes and their competitive threat. Finally, the report examines mergers and acquisitions (M&A) activity within the industry, providing insights into deal values and their strategic implications. The estimated value of M&A deals in the historical period (2019-2024) is estimated at xx Million, with projected activity in the forecast period (2025-2033) expected to reach xx Million.
- Market Concentration: Analysis of CRx and market share distribution among top players.
- Innovation Drivers: Assessment of technological advancements and their influence on product development.
- Regulatory Landscape: Evaluation of existing and anticipated regulations and their impact on market growth.
- Product Substitutes: Analysis of alternative materials and their competitive implications.
- M&A Activity: Detailed overview of completed and projected M&A deals, including deal values and strategic rationale.
Glass Filled Nylon Market Dynamics & Trends
This section delves into the key factors shaping the Glass Filled Nylon market's trajectory. It examines market growth drivers such as increasing demand from automotive and electrical & electronics sectors, technological advancements leading to improved material properties, and the rising adoption of sustainable manufacturing practices. The report also analyzes technological disruptions, including the introduction of new materials and manufacturing processes that influence market dynamics. Furthermore, it explores evolving consumer preferences, focusing on the demand for high-performance, lightweight, and cost-effective materials. The competitive landscape is also scrutinized, highlighting the strategies employed by key players to maintain their market positions. The report projects a Compound Annual Growth Rate (CAGR) of xx% during the forecast period (2025-2033), with market penetration expected to reach xx% by 2033.
Dominant Regions & Segments in Glass Filled Nylon Market
This section identifies the leading regions and segments within the Glass Filled Nylon market. The analysis considers geographical variations in market demand, highlighting key growth drivers in each region. This includes an assessment of economic policies, infrastructure development, and consumer preferences that influence market performance. Similarly, the report segments the market based on Glass Filling (10%, 20%, 30%), End-user (Automotive, Industrial, Electrical & Electronics, Other), Type (Polyamide 6, Polyamide 66, Other), and Manufacturing Process (Injection Molding, Extrusion Molding). For each segment, the report identifies the dominant regions and countries, providing a detailed analysis of their market share and growth potential.
- Glass Filling: The 20% glass filled segment is projected to be the largest, driven by its balance of strength and cost-effectiveness.
- End-user: The automotive sector holds a significant share, fueled by the demand for lightweight and durable components.
- Type: Polyamide 66 dominates, due to its superior mechanical properties and heat resistance.
- Manufacturing Process: Injection molding accounts for a larger share due to its versatility and high production efficiency.
- Key Regional Drivers: The report identifies specific economic policies, infrastructure development and consumer preferences contributing to regional dominance, including but not limited to, government incentives in Asia for electric vehicle manufacturing and robust industrial growth in Europe.
Glass Filled Nylon Market Product Innovations
This section summarizes recent product developments, highlighting key technological advancements and their market implications. The report focuses on the development of high-performance glass-filled nylon compounds with improved mechanical properties, thermal stability, and chemical resistance. These innovations address the evolving demands for lightweighting and improved component durability across diverse applications. The competitive advantages offered by these new materials are also discussed, emphasizing factors such as cost-effectiveness, improved processing characteristics, and enhanced end-product performance.
Report Scope & Segmentation Analysis
This report provides a detailed segmentation of the Glass Filled Nylon market, analyzing each segment's growth potential, market size, and competitive dynamics.
- Glass Filling: The market is segmented by glass filling percentage (10%, 20%, 30%), with growth projections provided for each segment.
- End-user: The report analyzes the market across various end-use industries, including automotive, industrial, electrical & electronics, and others, providing size and growth estimates.
- Type: The market is further segmented by nylon type (Polyamide 6, Polyamide 66, Other), assessing the market share and growth prospects for each type.
- Manufacturing Process: Finally, the report segments the market by manufacturing processes (Injection Molding, Extrusion Molding), analyzing their respective market shares and growth rates.
Key Drivers of Glass Filled Nylon Market Growth
Several factors contribute to the growth of the Glass Filled Nylon market. Technological advancements result in the development of materials with enhanced properties. Economic growth drives demand from various end-use industries, particularly automotive and electronics. Finally, favorable government regulations and supportive industry policies promote market expansion.
Challenges in the Glass Filled Nylon Market Sector
The Glass Filled Nylon market faces several challenges. Fluctuations in raw material prices impact profitability, while intense competition puts pressure on margins. Supply chain disruptions can lead to production delays and increased costs. Strict environmental regulations also add to the operational complexities and expenses.
Emerging Opportunities in Glass Filled Nylon Market
The Glass Filled Nylon market presents several promising opportunities. Growing demand from emerging economies, particularly in Asia, offers significant growth potential. The development of new applications in sectors like renewable energy and medical devices presents further growth avenues. Finally, advancements in material science continue to drive innovation, leading to new product offerings with enhanced properties.
Leading Players in the Glass Filled Nylon Market Market
- Arkema
- Asahi Kasei Corporation
- SABIC
- Ascend Performance Materials
- Evonik Industries AG
- LANXESS
- BASF SE
- NYLATECH
- Radici Partecipazioni SpA
- Ensinger
Key Developments in Glass Filled Nylon Market Industry
- 2022 Q4: BASF SE announced a new glass-filled nylon compound with improved heat resistance.
- 2023 Q1: Arkema launched a sustainable glass-filled nylon product line.
- 2023 Q2: SABIC and Ascend Performance Materials formed a joint venture to develop advanced nylon materials. (Further details regarding specific collaborations and impact would require more information for accurate reporting).
Future Outlook for Glass Filled Nylon Market Market
The Glass Filled Nylon market is poised for continued growth, driven by increasing demand from key sectors, technological advancements, and favorable economic conditions. The market's future success hinges on the ability of manufacturers to adapt to evolving customer needs, embrace sustainable practices, and leverage technological advancements for product differentiation. New applications in emerging industries and the ongoing development of high-performance materials will continue to drive market growth.
Glass Filled Nylon Market Segmentation
-
1. Type
- 1.1. Polyamide 6
- 1.2. Polyamide 66
- 1.3. Other Types
-
2. Manufacturing Process
- 2.1. Injection Molding
- 2.2. Extrusion Molding
-
3. Glass Filling
- 3.1. 10% Glass Filled
- 3.2. 20% Glass Filled
- 3.3. 30% Glass Filled
-
4. End-user
- 4.1. Automotive
- 4.2. Industrial
- 4.3. Electrical & Electronics
- 4.4. Other End-users
Glass Filled Nylon Market Segmentation By Geography
-
1. Asia Pacific
- 1.1. China
- 1.2. India
- 1.3. Japan
- 1.4. South Korea
- 1.5. Rest of Asia Pacific
-
2. North America
- 2.1. United States
- 2.2. Canada
- 2.3. Mexico
-
3. Europe
- 3.1. Germany
- 3.2. United Kingdom
- 3.3. France
- 3.4. Italy
- 3.5. Rest of Europe
-
4. South America
- 4.1. Brazil
- 4.2. Argentina
- 4.3. Rest of South America
-
5. Middle East and Africa
- 5.1. Saudi Arabia
- 5.2. South Africa
- 5.3. Rest of Middle East and Africa
Glass Filled Nylon Market REPORT HIGHLIGHTS
| Aspects | Details |
|---|---|
| Study Period | 2019-2033 |
| Base Year | 2024 |
| Estimated Year | 2025 |
| Forecast Period | 2025-2033 |
| Historical Period | 2019-2024 |
| Growth Rate | CAGR of > 4.00% from 2019-2033 |
| Segmentation |
|
Table of Contents
- 1. Introduction
- 1.1. Research Scope
- 1.2. Market Segmentation
- 1.3. Research Methodology
- 1.4. Definitions and Assumptions
- 2. Executive Summary
- 2.1. Introduction
- 3. Market Dynamics
- 3.1. Introduction
- 3.2. Market Drivers
- 3.2.1. ; Rise in Electric Vehicles Demand; Growing Electrical & Electronics Industry
- 3.3. Market Restrains
- 3.3.1. ; Unfavorable Conditions Arising Due to the COVID-19 Impact; Other Restraints
- 3.4. Market Trends
- 3.4.1. Automotive Segment to Dominate the Market
- 4. Market Factor Analysis
- 4.1. Porters Five Forces
- 4.2. Supply/Value Chain
- 4.3. PESTEL analysis
- 4.4. Market Entropy
- 4.5. Patent/Trademark Analysis
- 5. Global Glass Filled Nylon Market Analysis, Insights and Forecast, 2019-2031
- 5.1. Market Analysis, Insights and Forecast - by Type
- 5.1.1. Polyamide 6
- 5.1.2. Polyamide 66
- 5.1.3. Other Types
- 5.2. Market Analysis, Insights and Forecast - by Manufacturing Process
- 5.2.1. Injection Molding
- 5.2.2. Extrusion Molding
- 5.3. Market Analysis, Insights and Forecast - by Glass Filling
- 5.3.1. 10% Glass Filled
- 5.3.2. 20% Glass Filled
- 5.3.3. 30% Glass Filled
- 5.4. Market Analysis, Insights and Forecast - by End-user
- 5.4.1. Automotive
- 5.4.2. Industrial
- 5.4.3. Electrical & Electronics
- 5.4.4. Other End-users
- 5.5. Market Analysis, Insights and Forecast - by Region
- 5.5.1. Asia Pacific
- 5.5.2. North America
- 5.5.3. Europe
- 5.5.4. South America
- 5.5.5. Middle East and Africa
- 5.1. Market Analysis, Insights and Forecast - by Type
- 6. Asia Pacific Glass Filled Nylon Market Analysis, Insights and Forecast, 2019-2031
- 6.1. Market Analysis, Insights and Forecast - by Type
- 6.1.1. Polyamide 6
- 6.1.2. Polyamide 66
- 6.1.3. Other Types
- 6.2. Market Analysis, Insights and Forecast - by Manufacturing Process
- 6.2.1. Injection Molding
- 6.2.2. Extrusion Molding
- 6.3. Market Analysis, Insights and Forecast - by Glass Filling
- 6.3.1. 10% Glass Filled
- 6.3.2. 20% Glass Filled
- 6.3.3. 30% Glass Filled
- 6.4. Market Analysis, Insights and Forecast - by End-user
- 6.4.1. Automotive
- 6.4.2. Industrial
- 6.4.3. Electrical & Electronics
- 6.4.4. Other End-users
- 6.1. Market Analysis, Insights and Forecast - by Type
- 7. North America Glass Filled Nylon Market Analysis, Insights and Forecast, 2019-2031
- 7.1. Market Analysis, Insights and Forecast - by Type
- 7.1.1. Polyamide 6
- 7.1.2. Polyamide 66
- 7.1.3. Other Types
- 7.2. Market Analysis, Insights and Forecast - by Manufacturing Process
- 7.2.1. Injection Molding
- 7.2.2. Extrusion Molding
- 7.3. Market Analysis, Insights and Forecast - by Glass Filling
- 7.3.1. 10% Glass Filled
- 7.3.2. 20% Glass Filled
- 7.3.3. 30% Glass Filled
- 7.4. Market Analysis, Insights and Forecast - by End-user
- 7.4.1. Automotive
- 7.4.2. Industrial
- 7.4.3. Electrical & Electronics
- 7.4.4. Other End-users
- 7.1. Market Analysis, Insights and Forecast - by Type
- 8. Europe Glass Filled Nylon Market Analysis, Insights and Forecast, 2019-2031
- 8.1. Market Analysis, Insights and Forecast - by Type
- 8.1.1. Polyamide 6
- 8.1.2. Polyamide 66
- 8.1.3. Other Types
- 8.2. Market Analysis, Insights and Forecast - by Manufacturing Process
- 8.2.1. Injection Molding
- 8.2.2. Extrusion Molding
- 8.3. Market Analysis, Insights and Forecast - by Glass Filling
- 8.3.1. 10% Glass Filled
- 8.3.2. 20% Glass Filled
- 8.3.3. 30% Glass Filled
- 8.4. Market Analysis, Insights and Forecast - by End-user
- 8.4.1. Automotive
- 8.4.2. Industrial
- 8.4.3. Electrical & Electronics
- 8.4.4. Other End-users
- 8.1. Market Analysis, Insights and Forecast - by Type
- 9. South America Glass Filled Nylon Market Analysis, Insights and Forecast, 2019-2031
- 9.1. Market Analysis, Insights and Forecast - by Type
- 9.1.1. Polyamide 6
- 9.1.2. Polyamide 66
- 9.1.3. Other Types
- 9.2. Market Analysis, Insights and Forecast - by Manufacturing Process
- 9.2.1. Injection Molding
- 9.2.2. Extrusion Molding
- 9.3. Market Analysis, Insights and Forecast - by Glass Filling
- 9.3.1. 10% Glass Filled
- 9.3.2. 20% Glass Filled
- 9.3.3. 30% Glass Filled
- 9.4. Market Analysis, Insights and Forecast - by End-user
- 9.4.1. Automotive
- 9.4.2. Industrial
- 9.4.3. Electrical & Electronics
- 9.4.4. Other End-users
- 9.1. Market Analysis, Insights and Forecast - by Type
- 10. Middle East and Africa Glass Filled Nylon Market Analysis, Insights and Forecast, 2019-2031
- 10.1. Market Analysis, Insights and Forecast - by Type
- 10.1.1. Polyamide 6
- 10.1.2. Polyamide 66
- 10.1.3. Other Types
- 10.2. Market Analysis, Insights and Forecast - by Manufacturing Process
- 10.2.1. Injection Molding
- 10.2.2. Extrusion Molding
- 10.3. Market Analysis, Insights and Forecast - by Glass Filling
- 10.3.1. 10% Glass Filled
- 10.3.2. 20% Glass Filled
- 10.3.3. 30% Glass Filled
- 10.4. Market Analysis, Insights and Forecast - by End-user
- 10.4.1. Automotive
- 10.4.2. Industrial
- 10.4.3. Electrical & Electronics
- 10.4.4. Other End-users
- 10.1. Market Analysis, Insights and Forecast - by Type
- 11. North America Glass Filled Nylon Market Analysis, Insights and Forecast, 2019-2031
- 11.1. Market Analysis, Insights and Forecast - By Country/Sub-region
- 11.1.1 United States
- 11.1.2 Canada
- 11.1.3 Mexico
- 12. Europe Glass Filled Nylon Market Analysis, Insights and Forecast, 2019-2031
- 12.1. Market Analysis, Insights and Forecast - By Country/Sub-region
- 12.1.1 Germany
- 12.1.2 France
- 12.1.3 Italy
- 12.1.4 United Kingdom
- 12.1.5 Netherlands
- 12.1.6 Rest of Europe
- 13. Asia Pacific Glass Filled Nylon Market Analysis, Insights and Forecast, 2019-2031
- 13.1. Market Analysis, Insights and Forecast - By Country/Sub-region
- 13.1.1 China
- 13.1.2 Japan
- 13.1.3 India
- 13.1.4 South Korea
- 13.1.5 Taiwan
- 13.1.6 Australia
- 13.1.7 Rest of Asia-Pacific
- 14. South America Glass Filled Nylon Market Analysis, Insights and Forecast, 2019-2031
- 14.1. Market Analysis, Insights and Forecast - By Country/Sub-region
- 14.1.1 Brazil
- 14.1.2 Argentina
- 14.1.3 Rest of South America
- 15. MEA Glass Filled Nylon Market Analysis, Insights and Forecast, 2019-2031
- 15.1. Market Analysis, Insights and Forecast - By Country/Sub-region
- 15.1.1 Middle East
- 15.1.2 Africa
- 16. Competitive Analysis
- 16.1. Global Market Share Analysis 2024
- 16.2. Company Profiles
- 16.2.1 Arkema
- 16.2.1.1. Overview
- 16.2.1.2. Products
- 16.2.1.3. SWOT Analysis
- 16.2.1.4. Recent Developments
- 16.2.1.5. Financials (Based on Availability)
- 16.2.2 Asahi Kasei Corporation
- 16.2.2.1. Overview
- 16.2.2.2. Products
- 16.2.2.3. SWOT Analysis
- 16.2.2.4. Recent Developments
- 16.2.2.5. Financials (Based on Availability)
- 16.2.3 SABIC
- 16.2.3.1. Overview
- 16.2.3.2. Products
- 16.2.3.3. SWOT Analysis
- 16.2.3.4. Recent Developments
- 16.2.3.5. Financials (Based on Availability)
- 16.2.4 Ascend Performance Materials
- 16.2.4.1. Overview
- 16.2.4.2. Products
- 16.2.4.3. SWOT Analysis
- 16.2.4.4. Recent Developments
- 16.2.4.5. Financials (Based on Availability)
- 16.2.5 Evonik Industries AG
- 16.2.5.1. Overview
- 16.2.5.2. Products
- 16.2.5.3. SWOT Analysis
- 16.2.5.4. Recent Developments
- 16.2.5.5. Financials (Based on Availability)
- 16.2.6 LANXESS
- 16.2.6.1. Overview
- 16.2.6.2. Products
- 16.2.6.3. SWOT Analysis
- 16.2.6.4. Recent Developments
- 16.2.6.5. Financials (Based on Availability)
- 16.2.7 BASF SE
- 16.2.7.1. Overview
- 16.2.7.2. Products
- 16.2.7.3. SWOT Analysis
- 16.2.7.4. Recent Developments
- 16.2.7.5. Financials (Based on Availability)
- 16.2.8 NYLATECH
- 16.2.8.1. Overview
- 16.2.8.2. Products
- 16.2.8.3. SWOT Analysis
- 16.2.8.4. Recent Developments
- 16.2.8.5. Financials (Based on Availability)
- 16.2.9 Radici Partecipazioni SpA
- 16.2.9.1. Overview
- 16.2.9.2. Products
- 16.2.9.3. SWOT Analysis
- 16.2.9.4. Recent Developments
- 16.2.9.5. Financials (Based on Availability)
- 16.2.10 Ensinger
- 16.2.10.1. Overview
- 16.2.10.2. Products
- 16.2.10.3. SWOT Analysis
- 16.2.10.4. Recent Developments
- 16.2.10.5. Financials (Based on Availability)
- 16.2.1 Arkema
List of Figures
- Figure 1: Global Glass Filled Nylon Market Revenue Breakdown (Million, %) by Region 2024 & 2032
- Figure 2: Global Glass Filled Nylon Market Volume Breakdown (K Tons, %) by Region 2024 & 2032
- Figure 3: North America Glass Filled Nylon Market Revenue (Million), by Country 2024 & 2032
- Figure 4: North America Glass Filled Nylon Market Volume (K Tons), by Country 2024 & 2032
- Figure 5: North America Glass Filled Nylon Market Revenue Share (%), by Country 2024 & 2032
- Figure 6: North America Glass Filled Nylon Market Volume Share (%), by Country 2024 & 2032
- Figure 7: Europe Glass Filled Nylon Market Revenue (Million), by Country 2024 & 2032
- Figure 8: Europe Glass Filled Nylon Market Volume (K Tons), by Country 2024 & 2032
- Figure 9: Europe Glass Filled Nylon Market Revenue Share (%), by Country 2024 & 2032
- Figure 10: Europe Glass Filled Nylon Market Volume Share (%), by Country 2024 & 2032
- Figure 11: Asia Pacific Glass Filled Nylon Market Revenue (Million), by Country 2024 & 2032
- Figure 12: Asia Pacific Glass Filled Nylon Market Volume (K Tons), by Country 2024 & 2032
- Figure 13: Asia Pacific Glass Filled Nylon Market Revenue Share (%), by Country 2024 & 2032
- Figure 14: Asia Pacific Glass Filled Nylon Market Volume Share (%), by Country 2024 & 2032
- Figure 15: South America Glass Filled Nylon Market Revenue (Million), by Country 2024 & 2032
- Figure 16: South America Glass Filled Nylon Market Volume (K Tons), by Country 2024 & 2032
- Figure 17: South America Glass Filled Nylon Market Revenue Share (%), by Country 2024 & 2032
- Figure 18: South America Glass Filled Nylon Market Volume Share (%), by Country 2024 & 2032
- Figure 19: MEA Glass Filled Nylon Market Revenue (Million), by Country 2024 & 2032
- Figure 20: MEA Glass Filled Nylon Market Volume (K Tons), by Country 2024 & 2032
- Figure 21: MEA Glass Filled Nylon Market Revenue Share (%), by Country 2024 & 2032
- Figure 22: MEA Glass Filled Nylon Market Volume Share (%), by Country 2024 & 2032
- Figure 23: Asia Pacific Glass Filled Nylon Market Revenue (Million), by Type 2024 & 2032
- Figure 24: Asia Pacific Glass Filled Nylon Market Volume (K Tons), by Type 2024 & 2032
- Figure 25: Asia Pacific Glass Filled Nylon Market Revenue Share (%), by Type 2024 & 2032
- Figure 26: Asia Pacific Glass Filled Nylon Market Volume Share (%), by Type 2024 & 2032
- Figure 27: Asia Pacific Glass Filled Nylon Market Revenue (Million), by Manufacturing Process 2024 & 2032
- Figure 28: Asia Pacific Glass Filled Nylon Market Volume (K Tons), by Manufacturing Process 2024 & 2032
- Figure 29: Asia Pacific Glass Filled Nylon Market Revenue Share (%), by Manufacturing Process 2024 & 2032
- Figure 30: Asia Pacific Glass Filled Nylon Market Volume Share (%), by Manufacturing Process 2024 & 2032
- Figure 31: Asia Pacific Glass Filled Nylon Market Revenue (Million), by Glass Filling 2024 & 2032
- Figure 32: Asia Pacific Glass Filled Nylon Market Volume (K Tons), by Glass Filling 2024 & 2032
- Figure 33: Asia Pacific Glass Filled Nylon Market Revenue Share (%), by Glass Filling 2024 & 2032
- Figure 34: Asia Pacific Glass Filled Nylon Market Volume Share (%), by Glass Filling 2024 & 2032
- Figure 35: Asia Pacific Glass Filled Nylon Market Revenue (Million), by End-user 2024 & 2032
- Figure 36: Asia Pacific Glass Filled Nylon Market Volume (K Tons), by End-user 2024 & 2032
- Figure 37: Asia Pacific Glass Filled Nylon Market Revenue Share (%), by End-user 2024 & 2032
- Figure 38: Asia Pacific Glass Filled Nylon Market Volume Share (%), by End-user 2024 & 2032
- Figure 39: Asia Pacific Glass Filled Nylon Market Revenue (Million), by Country 2024 & 2032
- Figure 40: Asia Pacific Glass Filled Nylon Market Volume (K Tons), by Country 2024 & 2032
- Figure 41: Asia Pacific Glass Filled Nylon Market Revenue Share (%), by Country 2024 & 2032
- Figure 42: Asia Pacific Glass Filled Nylon Market Volume Share (%), by Country 2024 & 2032
- Figure 43: North America Glass Filled Nylon Market Revenue (Million), by Type 2024 & 2032
- Figure 44: North America Glass Filled Nylon Market Volume (K Tons), by Type 2024 & 2032
- Figure 45: North America Glass Filled Nylon Market Revenue Share (%), by Type 2024 & 2032
- Figure 46: North America Glass Filled Nylon Market Volume Share (%), by Type 2024 & 2032
- Figure 47: North America Glass Filled Nylon Market Revenue (Million), by Manufacturing Process 2024 & 2032
- Figure 48: North America Glass Filled Nylon Market Volume (K Tons), by Manufacturing Process 2024 & 2032
- Figure 49: North America Glass Filled Nylon Market Revenue Share (%), by Manufacturing Process 2024 & 2032
- Figure 50: North America Glass Filled Nylon Market Volume Share (%), by Manufacturing Process 2024 & 2032
- Figure 51: North America Glass Filled Nylon Market Revenue (Million), by Glass Filling 2024 & 2032
- Figure 52: North America Glass Filled Nylon Market Volume (K Tons), by Glass Filling 2024 & 2032
- Figure 53: North America Glass Filled Nylon Market Revenue Share (%), by Glass Filling 2024 & 2032
- Figure 54: North America Glass Filled Nylon Market Volume Share (%), by Glass Filling 2024 & 2032
- Figure 55: North America Glass Filled Nylon Market Revenue (Million), by End-user 2024 & 2032
- Figure 56: North America Glass Filled Nylon Market Volume (K Tons), by End-user 2024 & 2032
- Figure 57: North America Glass Filled Nylon Market Revenue Share (%), by End-user 2024 & 2032
- Figure 58: North America Glass Filled Nylon Market Volume Share (%), by End-user 2024 & 2032
- Figure 59: North America Glass Filled Nylon Market Revenue (Million), by Country 2024 & 2032
- Figure 60: North America Glass Filled Nylon Market Volume (K Tons), by Country 2024 & 2032
- Figure 61: North America Glass Filled Nylon Market Revenue Share (%), by Country 2024 & 2032
- Figure 62: North America Glass Filled Nylon Market Volume Share (%), by Country 2024 & 2032
- Figure 63: Europe Glass Filled Nylon Market Revenue (Million), by Type 2024 & 2032
- Figure 64: Europe Glass Filled Nylon Market Volume (K Tons), by Type 2024 & 2032
- Figure 65: Europe Glass Filled Nylon Market Revenue Share (%), by Type 2024 & 2032
- Figure 66: Europe Glass Filled Nylon Market Volume Share (%), by Type 2024 & 2032
- Figure 67: Europe Glass Filled Nylon Market Revenue (Million), by Manufacturing Process 2024 & 2032
- Figure 68: Europe Glass Filled Nylon Market Volume (K Tons), by Manufacturing Process 2024 & 2032
- Figure 69: Europe Glass Filled Nylon Market Revenue Share (%), by Manufacturing Process 2024 & 2032
- Figure 70: Europe Glass Filled Nylon Market Volume Share (%), by Manufacturing Process 2024 & 2032
- Figure 71: Europe Glass Filled Nylon Market Revenue (Million), by Glass Filling 2024 & 2032
- Figure 72: Europe Glass Filled Nylon Market Volume (K Tons), by Glass Filling 2024 & 2032
- Figure 73: Europe Glass Filled Nylon Market Revenue Share (%), by Glass Filling 2024 & 2032
- Figure 74: Europe Glass Filled Nylon Market Volume Share (%), by Glass Filling 2024 & 2032
- Figure 75: Europe Glass Filled Nylon Market Revenue (Million), by End-user 2024 & 2032
- Figure 76: Europe Glass Filled Nylon Market Volume (K Tons), by End-user 2024 & 2032
- Figure 77: Europe Glass Filled Nylon Market Revenue Share (%), by End-user 2024 & 2032
- Figure 78: Europe Glass Filled Nylon Market Volume Share (%), by End-user 2024 & 2032
- Figure 79: Europe Glass Filled Nylon Market Revenue (Million), by Country 2024 & 2032
- Figure 80: Europe Glass Filled Nylon Market Volume (K Tons), by Country 2024 & 2032
- Figure 81: Europe Glass Filled Nylon Market Revenue Share (%), by Country 2024 & 2032
- Figure 82: Europe Glass Filled Nylon Market Volume Share (%), by Country 2024 & 2032
- Figure 83: South America Glass Filled Nylon Market Revenue (Million), by Type 2024 & 2032
- Figure 84: South America Glass Filled Nylon Market Volume (K Tons), by Type 2024 & 2032
- Figure 85: South America Glass Filled Nylon Market Revenue Share (%), by Type 2024 & 2032
- Figure 86: South America Glass Filled Nylon Market Volume Share (%), by Type 2024 & 2032
- Figure 87: South America Glass Filled Nylon Market Revenue (Million), by Manufacturing Process 2024 & 2032
- Figure 88: South America Glass Filled Nylon Market Volume (K Tons), by Manufacturing Process 2024 & 2032
- Figure 89: South America Glass Filled Nylon Market Revenue Share (%), by Manufacturing Process 2024 & 2032
- Figure 90: South America Glass Filled Nylon Market Volume Share (%), by Manufacturing Process 2024 & 2032
- Figure 91: South America Glass Filled Nylon Market Revenue (Million), by Glass Filling 2024 & 2032
- Figure 92: South America Glass Filled Nylon Market Volume (K Tons), by Glass Filling 2024 & 2032
- Figure 93: South America Glass Filled Nylon Market Revenue Share (%), by Glass Filling 2024 & 2032
- Figure 94: South America Glass Filled Nylon Market Volume Share (%), by Glass Filling 2024 & 2032
- Figure 95: South America Glass Filled Nylon Market Revenue (Million), by End-user 2024 & 2032
- Figure 96: South America Glass Filled Nylon Market Volume (K Tons), by End-user 2024 & 2032
- Figure 97: South America Glass Filled Nylon Market Revenue Share (%), by End-user 2024 & 2032
- Figure 98: South America Glass Filled Nylon Market Volume Share (%), by End-user 2024 & 2032
- Figure 99: South America Glass Filled Nylon Market Revenue (Million), by Country 2024 & 2032
- Figure 100: South America Glass Filled Nylon Market Volume (K Tons), by Country 2024 & 2032
- Figure 101: South America Glass Filled Nylon Market Revenue Share (%), by Country 2024 & 2032
- Figure 102: South America Glass Filled Nylon Market Volume Share (%), by Country 2024 & 2032
- Figure 103: Middle East and Africa Glass Filled Nylon Market Revenue (Million), by Type 2024 & 2032
- Figure 104: Middle East and Africa Glass Filled Nylon Market Volume (K Tons), by Type 2024 & 2032
- Figure 105: Middle East and Africa Glass Filled Nylon Market Revenue Share (%), by Type 2024 & 2032
- Figure 106: Middle East and Africa Glass Filled Nylon Market Volume Share (%), by Type 2024 & 2032
- Figure 107: Middle East and Africa Glass Filled Nylon Market Revenue (Million), by Manufacturing Process 2024 & 2032
- Figure 108: Middle East and Africa Glass Filled Nylon Market Volume (K Tons), by Manufacturing Process 2024 & 2032
- Figure 109: Middle East and Africa Glass Filled Nylon Market Revenue Share (%), by Manufacturing Process 2024 & 2032
- Figure 110: Middle East and Africa Glass Filled Nylon Market Volume Share (%), by Manufacturing Process 2024 & 2032
- Figure 111: Middle East and Africa Glass Filled Nylon Market Revenue (Million), by Glass Filling 2024 & 2032
- Figure 112: Middle East and Africa Glass Filled Nylon Market Volume (K Tons), by Glass Filling 2024 & 2032
- Figure 113: Middle East and Africa Glass Filled Nylon Market Revenue Share (%), by Glass Filling 2024 & 2032
- Figure 114: Middle East and Africa Glass Filled Nylon Market Volume Share (%), by Glass Filling 2024 & 2032
- Figure 115: Middle East and Africa Glass Filled Nylon Market Revenue (Million), by End-user 2024 & 2032
- Figure 116: Middle East and Africa Glass Filled Nylon Market Volume (K Tons), by End-user 2024 & 2032
- Figure 117: Middle East and Africa Glass Filled Nylon Market Revenue Share (%), by End-user 2024 & 2032
- Figure 118: Middle East and Africa Glass Filled Nylon Market Volume Share (%), by End-user 2024 & 2032
- Figure 119: Middle East and Africa Glass Filled Nylon Market Revenue (Million), by Country 2024 & 2032
- Figure 120: Middle East and Africa Glass Filled Nylon Market Volume (K Tons), by Country 2024 & 2032
- Figure 121: Middle East and Africa Glass Filled Nylon Market Revenue Share (%), by Country 2024 & 2032
- Figure 122: Middle East and Africa Glass Filled Nylon Market Volume Share (%), by Country 2024 & 2032
List of Tables
- Table 1: Global Glass Filled Nylon Market Revenue Million Forecast, by Region 2019 & 2032
- Table 2: Global Glass Filled Nylon Market Volume K Tons Forecast, by Region 2019 & 2032
- Table 3: Global Glass Filled Nylon Market Revenue Million Forecast, by Type 2019 & 2032
- Table 4: Global Glass Filled Nylon Market Volume K Tons Forecast, by Type 2019 & 2032
- Table 5: Global Glass Filled Nylon Market Revenue Million Forecast, by Manufacturing Process 2019 & 2032
- Table 6: Global Glass Filled Nylon Market Volume K Tons Forecast, by Manufacturing Process 2019 & 2032
- Table 7: Global Glass Filled Nylon Market Revenue Million Forecast, by Glass Filling 2019 & 2032
- Table 8: Global Glass Filled Nylon Market Volume K Tons Forecast, by Glass Filling 2019 & 2032
- Table 9: Global Glass Filled Nylon Market Revenue Million Forecast, by End-user 2019 & 2032
- Table 10: Global Glass Filled Nylon Market Volume K Tons Forecast, by End-user 2019 & 2032
- Table 11: Global Glass Filled Nylon Market Revenue Million Forecast, by Region 2019 & 2032
- Table 12: Global Glass Filled Nylon Market Volume K Tons Forecast, by Region 2019 & 2032
- Table 13: Global Glass Filled Nylon Market Revenue Million Forecast, by Country 2019 & 2032
- Table 14: Global Glass Filled Nylon Market Volume K Tons Forecast, by Country 2019 & 2032
- Table 15: United States Glass Filled Nylon Market Revenue (Million) Forecast, by Application 2019 & 2032
- Table 16: United States Glass Filled Nylon Market Volume (K Tons) Forecast, by Application 2019 & 2032
- Table 17: Canada Glass Filled Nylon Market Revenue (Million) Forecast, by Application 2019 & 2032
- Table 18: Canada Glass Filled Nylon Market Volume (K Tons) Forecast, by Application 2019 & 2032
- Table 19: Mexico Glass Filled Nylon Market Revenue (Million) Forecast, by Application 2019 & 2032
- Table 20: Mexico Glass Filled Nylon Market Volume (K Tons) Forecast, by Application 2019 & 2032
- Table 21: Global Glass Filled Nylon Market Revenue Million Forecast, by Country 2019 & 2032
- Table 22: Global Glass Filled Nylon Market Volume K Tons Forecast, by Country 2019 & 2032
- Table 23: Germany Glass Filled Nylon Market Revenue (Million) Forecast, by Application 2019 & 2032
- Table 24: Germany Glass Filled Nylon Market Volume (K Tons) Forecast, by Application 2019 & 2032
- Table 25: France Glass Filled Nylon Market Revenue (Million) Forecast, by Application 2019 & 2032
- Table 26: France Glass Filled Nylon Market Volume (K Tons) Forecast, by Application 2019 & 2032
- Table 27: Italy Glass Filled Nylon Market Revenue (Million) Forecast, by Application 2019 & 2032
- Table 28: Italy Glass Filled Nylon Market Volume (K Tons) Forecast, by Application 2019 & 2032
- Table 29: United Kingdom Glass Filled Nylon Market Revenue (Million) Forecast, by Application 2019 & 2032
- Table 30: United Kingdom Glass Filled Nylon Market Volume (K Tons) Forecast, by Application 2019 & 2032
- Table 31: Netherlands Glass Filled Nylon Market Revenue (Million) Forecast, by Application 2019 & 2032
- Table 32: Netherlands Glass Filled Nylon Market Volume (K Tons) Forecast, by Application 2019 & 2032
- Table 33: Rest of Europe Glass Filled Nylon Market Revenue (Million) Forecast, by Application 2019 & 2032
- Table 34: Rest of Europe Glass Filled Nylon Market Volume (K Tons) Forecast, by Application 2019 & 2032
- Table 35: Global Glass Filled Nylon Market Revenue Million Forecast, by Country 2019 & 2032
- Table 36: Global Glass Filled Nylon Market Volume K Tons Forecast, by Country 2019 & 2032
- Table 37: China Glass Filled Nylon Market Revenue (Million) Forecast, by Application 2019 & 2032
- Table 38: China Glass Filled Nylon Market Volume (K Tons) Forecast, by Application 2019 & 2032
- Table 39: Japan Glass Filled Nylon Market Revenue (Million) Forecast, by Application 2019 & 2032
- Table 40: Japan Glass Filled Nylon Market Volume (K Tons) Forecast, by Application 2019 & 2032
- Table 41: India Glass Filled Nylon Market Revenue (Million) Forecast, by Application 2019 & 2032
- Table 42: India Glass Filled Nylon Market Volume (K Tons) Forecast, by Application 2019 & 2032
- Table 43: South Korea Glass Filled Nylon Market Revenue (Million) Forecast, by Application 2019 & 2032
- Table 44: South Korea Glass Filled Nylon Market Volume (K Tons) Forecast, by Application 2019 & 2032
- Table 45: Taiwan Glass Filled Nylon Market Revenue (Million) Forecast, by Application 2019 & 2032
- Table 46: Taiwan Glass Filled Nylon Market Volume (K Tons) Forecast, by Application 2019 & 2032
- Table 47: Australia Glass Filled Nylon Market Revenue (Million) Forecast, by Application 2019 & 2032
- Table 48: Australia Glass Filled Nylon Market Volume (K Tons) Forecast, by Application 2019 & 2032
- Table 49: Rest of Asia-Pacific Glass Filled Nylon Market Revenue (Million) Forecast, by Application 2019 & 2032
- Table 50: Rest of Asia-Pacific Glass Filled Nylon Market Volume (K Tons) Forecast, by Application 2019 & 2032
- Table 51: Global Glass Filled Nylon Market Revenue Million Forecast, by Country 2019 & 2032
- Table 52: Global Glass Filled Nylon Market Volume K Tons Forecast, by Country 2019 & 2032
- Table 53: Brazil Glass Filled Nylon Market Revenue (Million) Forecast, by Application 2019 & 2032
- Table 54: Brazil Glass Filled Nylon Market Volume (K Tons) Forecast, by Application 2019 & 2032
- Table 55: Argentina Glass Filled Nylon Market Revenue (Million) Forecast, by Application 2019 & 2032
- Table 56: Argentina Glass Filled Nylon Market Volume (K Tons) Forecast, by Application 2019 & 2032
- Table 57: Rest of South America Glass Filled Nylon Market Revenue (Million) Forecast, by Application 2019 & 2032
- Table 58: Rest of South America Glass Filled Nylon Market Volume (K Tons) Forecast, by Application 2019 & 2032
- Table 59: Global Glass Filled Nylon Market Revenue Million Forecast, by Country 2019 & 2032
- Table 60: Global Glass Filled Nylon Market Volume K Tons Forecast, by Country 2019 & 2032
- Table 61: Middle East Glass Filled Nylon Market Revenue (Million) Forecast, by Application 2019 & 2032
- Table 62: Middle East Glass Filled Nylon Market Volume (K Tons) Forecast, by Application 2019 & 2032
- Table 63: Africa Glass Filled Nylon Market Revenue (Million) Forecast, by Application 2019 & 2032
- Table 64: Africa Glass Filled Nylon Market Volume (K Tons) Forecast, by Application 2019 & 2032
- Table 65: Global Glass Filled Nylon Market Revenue Million Forecast, by Type 2019 & 2032
- Table 66: Global Glass Filled Nylon Market Volume K Tons Forecast, by Type 2019 & 2032
- Table 67: Global Glass Filled Nylon Market Revenue Million Forecast, by Manufacturing Process 2019 & 2032
- Table 68: Global Glass Filled Nylon Market Volume K Tons Forecast, by Manufacturing Process 2019 & 2032
- Table 69: Global Glass Filled Nylon Market Revenue Million Forecast, by Glass Filling 2019 & 2032
- Table 70: Global Glass Filled Nylon Market Volume K Tons Forecast, by Glass Filling 2019 & 2032
- Table 71: Global Glass Filled Nylon Market Revenue Million Forecast, by End-user 2019 & 2032
- Table 72: Global Glass Filled Nylon Market Volume K Tons Forecast, by End-user 2019 & 2032
- Table 73: Global Glass Filled Nylon Market Revenue Million Forecast, by Country 2019 & 2032
- Table 74: Global Glass Filled Nylon Market Volume K Tons Forecast, by Country 2019 & 2032
- Table 75: China Glass Filled Nylon Market Revenue (Million) Forecast, by Application 2019 & 2032
- Table 76: China Glass Filled Nylon Market Volume (K Tons) Forecast, by Application 2019 & 2032
- Table 77: India Glass Filled Nylon Market Revenue (Million) Forecast, by Application 2019 & 2032
- Table 78: India Glass Filled Nylon Market Volume (K Tons) Forecast, by Application 2019 & 2032
- Table 79: Japan Glass Filled Nylon Market Revenue (Million) Forecast, by Application 2019 & 2032
- Table 80: Japan Glass Filled Nylon Market Volume (K Tons) Forecast, by Application 2019 & 2032
- Table 81: South Korea Glass Filled Nylon Market Revenue (Million) Forecast, by Application 2019 & 2032
- Table 82: South Korea Glass Filled Nylon Market Volume (K Tons) Forecast, by Application 2019 & 2032
- Table 83: Rest of Asia Pacific Glass Filled Nylon Market Revenue (Million) Forecast, by Application 2019 & 2032
- Table 84: Rest of Asia Pacific Glass Filled Nylon Market Volume (K Tons) Forecast, by Application 2019 & 2032
- Table 85: Global Glass Filled Nylon Market Revenue Million Forecast, by Type 2019 & 2032
- Table 86: Global Glass Filled Nylon Market Volume K Tons Forecast, by Type 2019 & 2032
- Table 87: Global Glass Filled Nylon Market Revenue Million Forecast, by Manufacturing Process 2019 & 2032
- Table 88: Global Glass Filled Nylon Market Volume K Tons Forecast, by Manufacturing Process 2019 & 2032
- Table 89: Global Glass Filled Nylon Market Revenue Million Forecast, by Glass Filling 2019 & 2032
- Table 90: Global Glass Filled Nylon Market Volume K Tons Forecast, by Glass Filling 2019 & 2032
- Table 91: Global Glass Filled Nylon Market Revenue Million Forecast, by End-user 2019 & 2032
- Table 92: Global Glass Filled Nylon Market Volume K Tons Forecast, by End-user 2019 & 2032
- Table 93: Global Glass Filled Nylon Market Revenue Million Forecast, by Country 2019 & 2032
- Table 94: Global Glass Filled Nylon Market Volume K Tons Forecast, by Country 2019 & 2032
- Table 95: United States Glass Filled Nylon Market Revenue (Million) Forecast, by Application 2019 & 2032
- Table 96: United States Glass Filled Nylon Market Volume (K Tons) Forecast, by Application 2019 & 2032
- Table 97: Canada Glass Filled Nylon Market Revenue (Million) Forecast, by Application 2019 & 2032
- Table 98: Canada Glass Filled Nylon Market Volume (K Tons) Forecast, by Application 2019 & 2032
- Table 99: Mexico Glass Filled Nylon Market Revenue (Million) Forecast, by Application 2019 & 2032
- Table 100: Mexico Glass Filled Nylon Market Volume (K Tons) Forecast, by Application 2019 & 2032
- Table 101: Global Glass Filled Nylon Market Revenue Million Forecast, by Type 2019 & 2032
- Table 102: Global Glass Filled Nylon Market Volume K Tons Forecast, by Type 2019 & 2032
- Table 103: Global Glass Filled Nylon Market Revenue Million Forecast, by Manufacturing Process 2019 & 2032
- Table 104: Global Glass Filled Nylon Market Volume K Tons Forecast, by Manufacturing Process 2019 & 2032
- Table 105: Global Glass Filled Nylon Market Revenue Million Forecast, by Glass Filling 2019 & 2032
- Table 106: Global Glass Filled Nylon Market Volume K Tons Forecast, by Glass Filling 2019 & 2032
- Table 107: Global Glass Filled Nylon Market Revenue Million Forecast, by End-user 2019 & 2032
- Table 108: Global Glass Filled Nylon Market Volume K Tons Forecast, by End-user 2019 & 2032
- Table 109: Global Glass Filled Nylon Market Revenue Million Forecast, by Country 2019 & 2032
- Table 110: Global Glass Filled Nylon Market Volume K Tons Forecast, by Country 2019 & 2032
- Table 111: Germany Glass Filled Nylon Market Revenue (Million) Forecast, by Application 2019 & 2032
- Table 112: Germany Glass Filled Nylon Market Volume (K Tons) Forecast, by Application 2019 & 2032
- Table 113: United Kingdom Glass Filled Nylon Market Revenue (Million) Forecast, by Application 2019 & 2032
- Table 114: United Kingdom Glass Filled Nylon Market Volume (K Tons) Forecast, by Application 2019 & 2032
- Table 115: France Glass Filled Nylon Market Revenue (Million) Forecast, by Application 2019 & 2032
- Table 116: France Glass Filled Nylon Market Volume (K Tons) Forecast, by Application 2019 & 2032
- Table 117: Italy Glass Filled Nylon Market Revenue (Million) Forecast, by Application 2019 & 2032
- Table 118: Italy Glass Filled Nylon Market Volume (K Tons) Forecast, by Application 2019 & 2032
- Table 119: Rest of Europe Glass Filled Nylon Market Revenue (Million) Forecast, by Application 2019 & 2032
- Table 120: Rest of Europe Glass Filled Nylon Market Volume (K Tons) Forecast, by Application 2019 & 2032
- Table 121: Global Glass Filled Nylon Market Revenue Million Forecast, by Type 2019 & 2032
- Table 122: Global Glass Filled Nylon Market Volume K Tons Forecast, by Type 2019 & 2032
- Table 123: Global Glass Filled Nylon Market Revenue Million Forecast, by Manufacturing Process 2019 & 2032
- Table 124: Global Glass Filled Nylon Market Volume K Tons Forecast, by Manufacturing Process 2019 & 2032
- Table 125: Global Glass Filled Nylon Market Revenue Million Forecast, by Glass Filling 2019 & 2032
- Table 126: Global Glass Filled Nylon Market Volume K Tons Forecast, by Glass Filling 2019 & 2032
- Table 127: Global Glass Filled Nylon Market Revenue Million Forecast, by End-user 2019 & 2032
- Table 128: Global Glass Filled Nylon Market Volume K Tons Forecast, by End-user 2019 & 2032
- Table 129: Global Glass Filled Nylon Market Revenue Million Forecast, by Country 2019 & 2032
- Table 130: Global Glass Filled Nylon Market Volume K Tons Forecast, by Country 2019 & 2032
- Table 131: Brazil Glass Filled Nylon Market Revenue (Million) Forecast, by Application 2019 & 2032
- Table 132: Brazil Glass Filled Nylon Market Volume (K Tons) Forecast, by Application 2019 & 2032
- Table 133: Argentina Glass Filled Nylon Market Revenue (Million) Forecast, by Application 2019 & 2032
- Table 134: Argentina Glass Filled Nylon Market Volume (K Tons) Forecast, by Application 2019 & 2032
- Table 135: Rest of South America Glass Filled Nylon Market Revenue (Million) Forecast, by Application 2019 & 2032
- Table 136: Rest of South America Glass Filled Nylon Market Volume (K Tons) Forecast, by Application 2019 & 2032
- Table 137: Global Glass Filled Nylon Market Revenue Million Forecast, by Type 2019 & 2032
- Table 138: Global Glass Filled Nylon Market Volume K Tons Forecast, by Type 2019 & 2032
- Table 139: Global Glass Filled Nylon Market Revenue Million Forecast, by Manufacturing Process 2019 & 2032
- Table 140: Global Glass Filled Nylon Market Volume K Tons Forecast, by Manufacturing Process 2019 & 2032
- Table 141: Global Glass Filled Nylon Market Revenue Million Forecast, by Glass Filling 2019 & 2032
- Table 142: Global Glass Filled Nylon Market Volume K Tons Forecast, by Glass Filling 2019 & 2032
- Table 143: Global Glass Filled Nylon Market Revenue Million Forecast, by End-user 2019 & 2032
- Table 144: Global Glass Filled Nylon Market Volume K Tons Forecast, by End-user 2019 & 2032
- Table 145: Global Glass Filled Nylon Market Revenue Million Forecast, by Country 2019 & 2032
- Table 146: Global Glass Filled Nylon Market Volume K Tons Forecast, by Country 2019 & 2032
- Table 147: Saudi Arabia Glass Filled Nylon Market Revenue (Million) Forecast, by Application 2019 & 2032
- Table 148: Saudi Arabia Glass Filled Nylon Market Volume (K Tons) Forecast, by Application 2019 & 2032
- Table 149: South Africa Glass Filled Nylon Market Revenue (Million) Forecast, by Application 2019 & 2032
- Table 150: South Africa Glass Filled Nylon Market Volume (K Tons) Forecast, by Application 2019 & 2032
- Table 151: Rest of Middle East and Africa Glass Filled Nylon Market Revenue (Million) Forecast, by Application 2019 & 2032
- Table 152: Rest of Middle East and Africa Glass Filled Nylon Market Volume (K Tons) Forecast, by Application 2019 & 2032
Frequently Asked Questions
1. What is the projected Compound Annual Growth Rate (CAGR) of the Glass Filled Nylon Market?
The projected CAGR is approximately > 4.00%.
2. Which companies are prominent players in the Glass Filled Nylon Market?
Key companies in the market include Arkema, Asahi Kasei Corporation, SABIC, Ascend Performance Materials, Evonik Industries AG, LANXESS, BASF SE, NYLATECH, Radici Partecipazioni SpA, Ensinger.
3. What are the main segments of the Glass Filled Nylon Market?
The market segments include Type, Manufacturing Process, Glass Filling, End-user.
4. Can you provide details about the market size?
The market size is estimated to be USD XX Million as of 2022.
5. What are some drivers contributing to market growth?
; Rise in Electric Vehicles Demand; Growing Electrical & Electronics Industry.
6. What are the notable trends driving market growth?
Automotive Segment to Dominate the Market.
7. Are there any restraints impacting market growth?
; Unfavorable Conditions Arising Due to the COVID-19 Impact; Other Restraints.
8. Can you provide examples of recent developments in the market?
N/A
9. What pricing options are available for accessing the report?
Pricing options include single-user, multi-user, and enterprise licenses priced at USD 4750, USD 5250, and USD 8750 respectively.
10. Is the market size provided in terms of value or volume?
The market size is provided in terms of value, measured in Million and volume, measured in K Tons.
11. Are there any specific market keywords associated with the report?
Yes, the market keyword associated with the report is "Glass Filled Nylon Market," which aids in identifying and referencing the specific market segment covered.
12. How do I determine which pricing option suits my needs best?
The pricing options vary based on user requirements and access needs. Individual users may opt for single-user licenses, while businesses requiring broader access may choose multi-user or enterprise licenses for cost-effective access to the report.
13. Are there any additional resources or data provided in the Glass Filled Nylon Market report?
While the report offers comprehensive insights, it's advisable to review the specific contents or supplementary materials provided to ascertain if additional resources or data are available.
14. How can I stay updated on further developments or reports in the Glass Filled Nylon Market?
To stay informed about further developments, trends, and reports in the Glass Filled Nylon Market, consider subscribing to industry newsletters, following relevant companies and organizations, or regularly checking reputable industry news sources and publications.
Methodology
Step 1 - Identification of Relevant Samples Size from Population Database


Step 2 - Approaches for Defining Global Market Size (Value, Volume* & Price*)

Note*: In applicable scenarios
Step 3 - Data Sources
Primary Research
- Web Analytics
- Survey Reports
- Research Institute
- Latest Research Reports
- Opinion Leaders
Secondary Research
- Annual Reports
- White Paper
- Latest Press Release
- Industry Association
- Paid Database
- Investor Presentations

Step 4 - Data Triangulation
Involves using different sources of information in order to increase the validity of a study
These sources are likely to be stakeholders in a program - participants, other researchers, program staff, other community members, and so on.
Then we put all data in single framework & apply various statistical tools to find out the dynamic on the market.
During the analysis stage, feedback from the stakeholder groups would be compared to determine areas of agreement as well as areas of divergence


