

Key Insights
The global Glycated Albumin Assay Kit market is projected for significant expansion, expected to reach an estimated $242.7 million by 2025, with a Compound Annual Growth Rate (CAGR) of 8.4% from 2025 to 2033. This growth is driven by the rising prevalence of chronic conditions like diabetes and kidney disease, which require consistent glycated albumin monitoring. Increased awareness among healthcare providers and patients concerning early diagnosis and effective management of these diseases further boosts demand. Technological advancements in diagnostics, leading to more sensitive, accurate, and user-friendly assay kits, also contribute substantially to this trend. The market is characterized by a strong focus on product innovation and strategic partnerships among key manufacturers aimed at portfolio expansion and wider geographic reach, addressing the evolving healthcare landscape.
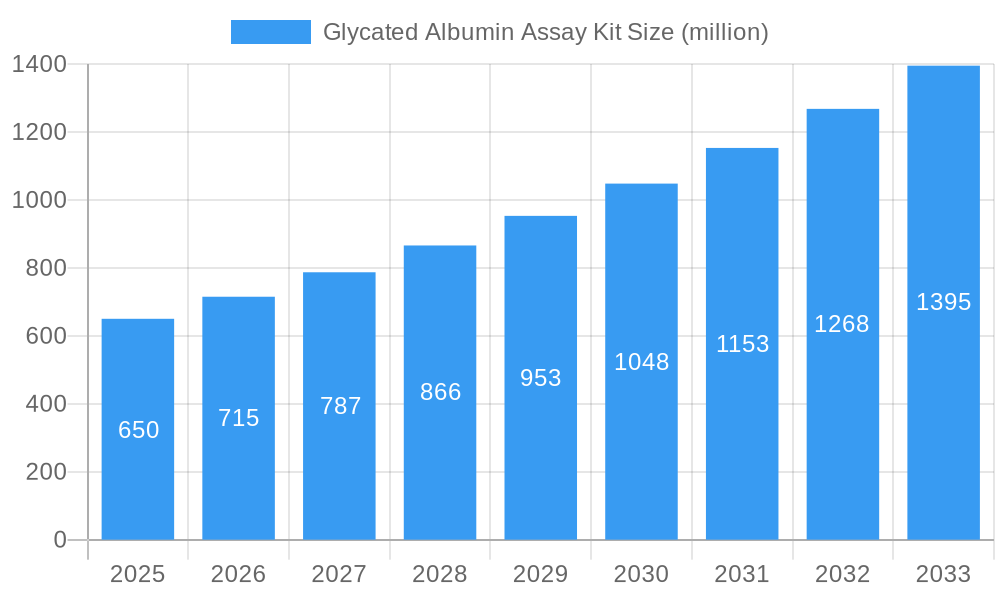
Glycated Albumin Assay Kit Market Size (In Million)
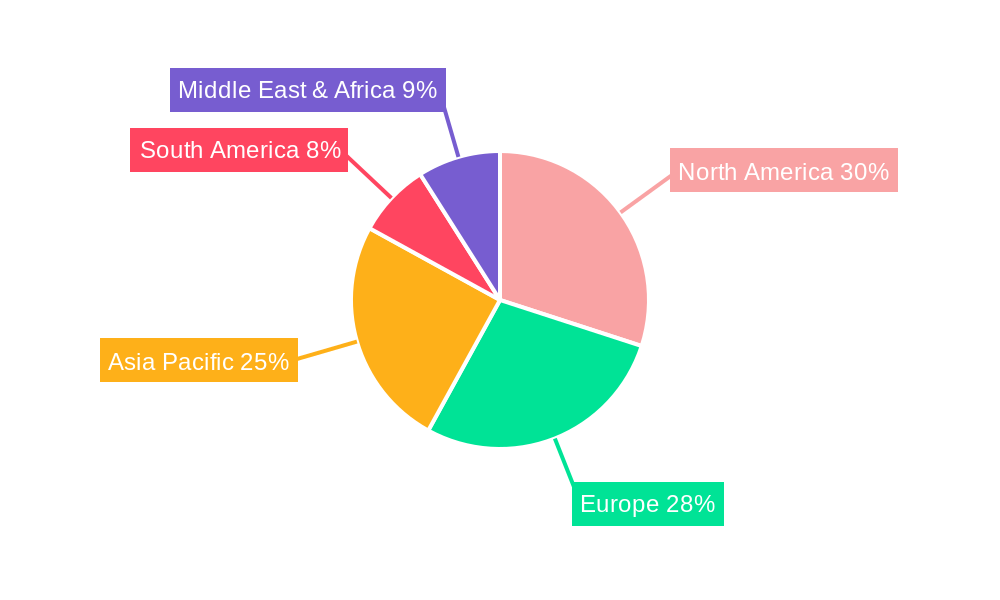
Key market growth factors include escalating global healthcare spending, the increasing incidence of lifestyle-related diseases, and the wider adoption of point-of-care testing. Potential market restraints include the high cost of advanced assay kits in emerging economies and the rigorous regulatory approval processes for new products. However, diverse application segments, such as diabetes, kidney failure, and liver cirrhosis, along with assay kit types including Bromcresol Green (BCG) and Bromcresol Purple (BCP), present extensive opportunities. The Asia Pacific region is anticipated to lead growth due to its large population, rising disposable income, and developing healthcare infrastructure, complementing established markets in North America and Europe.
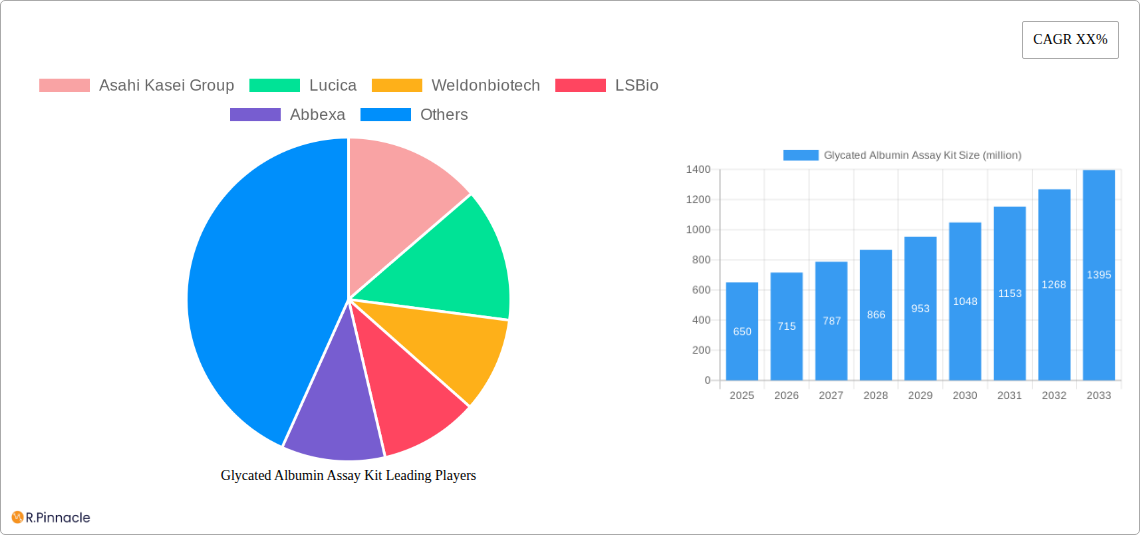
Glycated Albumin Assay Kit Company Market Share
This comprehensive report offers a detailed analysis of the global Glycated Albumin (GA) Assay Kit market, providing essential insights for stakeholders. Covering the historical period of 2019–2024, with a base year of 2025 and a forecast extending to 2033, the analysis explores market structure, dynamics, regional trends, product innovation, key drivers, challenges, and emerging opportunities. Utilizing a robust research methodology, this report delivers actionable intelligence for informed strategic decision-making.
Glycated Albumin Assay Kit Market Structure & Innovation Trends
The Glycated Albumin (GA) Assay Kit market exhibits a moderately consolidated structure, with leading players like Asahi Kasei Group and Lucica holding significant market share, estimated at over 40 million dollars each. Innovation is primarily driven by the pursuit of enhanced assay sensitivity, specificity, and faster turnaround times, crucial for accurate diabetes and kidney disease management. Regulatory frameworks, particularly those governing in-vitro diagnostics (IVDs), play a pivotal role in market entry and product approval, with stringent guidelines from bodies like the FDA and EMA shaping development pathways. Product substitutes, such as HbA1c testing, exist but GA assays offer unique advantages in monitoring short-term glycemic control. End-user demographics are predominantly healthcare professionals, including endocrinologists, nephrologists, and clinical laboratory technicians. Mergers and acquisitions (M&A) are emerging as strategic tools for market expansion and technology acquisition, with recent deals valued in the tens of millions of dollars, further consolidating the competitive landscape.
- Market Concentration: Moderate to High, with key players dominating.
- Innovation Drivers: Assay sensitivity, speed, accuracy, cost-effectiveness.
- Regulatory Frameworks: FDA, EMA, and other regional IVD regulations.
- Product Substitutes: HbA1c testing (glycemic control over 2-3 months).
- End-User Demographics: Healthcare professionals, diagnostic laboratories.
- M&A Activities: Strategic acquisitions for market share and technology enhancement.
Glycated Albumin Assay Kit Market Dynamics & Trends
The Glycated Albumin (GA) Assay Kit market is poised for robust growth, projected to witness a Compound Annual Growth Rate (CAGR) of approximately 6.5% over the forecast period (2025–2033). This expansion is fueled by a confluence of factors, primarily the escalating global prevalence of diabetes and chronic kidney diseases, which necessitates accurate and timely monitoring of glycemic control. The increasing awareness among patients and healthcare providers regarding the clinical significance of GA as a marker for short-term glycemic fluctuations, complementing HbA1c, is a significant market driver. Technological advancements in immunoassay and enzymatic methods have led to the development of more sensitive, specific, and user-friendly GA assay kits, contributing to market penetration. Consumer preferences are leaning towards point-of-care testing solutions and kits that offer rapid results, enabling quicker clinical decisions.
The competitive landscape is characterized by intense innovation and strategic collaborations. Companies are investing heavily in research and development to offer kits with improved diagnostic accuracy and reduced interference from other biological factors. The growing adoption of GA testing in routine clinical practice for managing gestational diabetes and monitoring patients with kidney failure is further propelling market growth. Furthermore, the increasing demand for personalized medicine approaches in diabetes management is creating opportunities for GA assays that can provide granular insights into glycemic trends. The market penetration of these kits is steadily increasing as healthcare systems recognize their value in optimizing treatment strategies and preventing long-term complications.
Dominant Regions & Segments in Glycated Albumin Assay Kit
North America currently leads the Glycated Albumin (GA) Assay Kit market, driven by a well-established healthcare infrastructure, high prevalence of diabetes and kidney diseases, and a strong emphasis on advanced diagnostic technologies. The United States, in particular, accounts for a substantial portion of the regional market share, owing to proactive government initiatives promoting early disease detection and management, coupled with significant R&D investments by leading diagnostic companies. The rising incidence of obesity and type 2 diabetes in this region further amplifies the demand for reliable glycemic monitoring tools.
Within the Application segment, Diabetes remains the dominant application area, accounting for an estimated 70% of the market. This is directly attributed to the global epidemic of diabetes, requiring continuous monitoring of glycemic control to prevent severe complications. Kidney Failure emerges as the second-largest application, with GA levels often elevated in patients with renal insufficiency, making GA assay kits crucial for monitoring disease progression and treatment efficacy. The Types segment is broadly categorized into Bromcresol Green (BCG) and Bromcresol Purple (BCP) methods. While both are widely used, the BCG method generally exhibits higher sensitivity and is prevalent in many automated immunoassay platforms, contributing significantly to its market dominance. The BCP method, though also effective, is often employed in manual assay formats or specific laboratory settings. The burgeoning demand for accurate diabetes management tools, coupled with an aging global population and increasing awareness of chronic disease complications, is expected to sustain the growth trajectory of these dominant segments and regions.
- Leading Region: North America, specifically the United States.
- Key Drivers: Advanced healthcare infrastructure, high diabetes/kidney disease prevalence, robust R&D investment.
- Dominant Application Segment: Diabetes.
- Key Drivers: Global diabetes epidemic, need for short-term glycemic control monitoring.
- Second Largest Application Segment: Kidney Failure.
- Key Drivers: GA as a marker for renal insufficiency, disease progression monitoring.
- Dominant Type Segment: Bromcresol Green (BCG) methods.
- Key Drivers: Higher sensitivity, widespread use in automated immunoassay platforms.
Glycated Albumin Assay Kit Product Innovations
Recent product innovations in the Glycated Albumin (GA) Assay Kit market are focused on enhancing assay precision, reducing assay times, and improving compatibility with automated laboratory systems. Manufacturers are developing kits that offer superior specificity to minimize cross-reactivity and provide more accurate GA measurements. These advancements are crucial for distinguishing GA levels in patients with varying glycemic control patterns and comorbidities. The competitive advantage lies in kits that demonstrate improved linearity across a wide range of GA concentrations and offer simplified workflows, thereby reducing laboratory labor costs and increasing throughput. The market is witnessing a trend towards the development of reagent kits designed for high-throughput diagnostic platforms, catering to the increasing demand for rapid and efficient disease screening and monitoring.
Report Scope & Segmentation Analysis
This report meticulously analyzes the Glycated Albumin (GA) Assay Kit market across key segmentation dimensions.
Application: The market is segmented by application into Diabetes, Kidney Failure, Poor Blood, Liver Cirrhosis, and Others. The Diabetes segment is anticipated to lead the market with a projected growth rate of approximately 7% over the forecast period, driven by the escalating global diabetes burden. Kidney Failure, another significant segment, is expected to grow at a CAGR of around 6%, fueled by the increasing incidence of chronic kidney disease.
Types: The market is also segmented by type into Bromcresol Green (BCG) and Bromcresol Purple (BCP). The BCG segment is expected to dominate, with a projected market share exceeding 55% by 2033, due to its widespread adoption in automated immunoassay systems and its inherent sensitivity. The BCP segment, while smaller, is projected to experience steady growth at a CAGR of approximately 5.8%.
Key Drivers of Glycated Albumin Assay Kit Growth
The Glycated Albumin (GA) Assay Kit market's growth is propelled by a multifaceted set of drivers. The relentless surge in the global incidence of diabetes mellitus, both type 1 and type 2, directly translates into a higher demand for accurate and timely glycemic monitoring tools. Furthermore, the rising prevalence of chronic kidney disease (CKD), a common complication of diabetes, significantly boosts the need for GA assays as they offer valuable insights into short-term glycemic control in renally impaired patients. Technological advancements in diagnostic assay methodologies, leading to improved sensitivity, specificity, and faster turnaround times, are making GA testing more accessible and reliable for clinical use. Increased healthcare expenditure and expanding healthcare access in emerging economies are also contributing to market expansion, as more individuals gain access to advanced diagnostic services.
Challenges in the Glycated Albumin Assay Kit Sector
Despite the promising growth trajectory, the Glycated Albumin (GA) Assay Kit sector faces several challenges that can impede its full potential. The relatively higher cost of GA testing compared to traditional glucose monitoring methods can be a significant barrier to widespread adoption, particularly in resource-limited settings. Regulatory hurdles and the stringent approval processes for in-vitro diagnostic devices in various regions can lead to extended product launch timelines and increased development costs. Intense competition among established players and the emergence of new market entrants can also exert downward pressure on pricing and profit margins. Moreover, the lack of standardized diagnostic guidelines for GA testing in certain clinical scenarios can create confusion and limit its consistent integration into routine patient care.
Emerging Opportunities in Glycated Albumin Assay Kit
The Glycated Albumin (GA) Assay Kit market is ripe with emerging opportunities. The growing emphasis on personalized medicine and proactive disease management is creating a demand for granular glycemic monitoring, where GA assays excel in reflecting recent glycemic control. The expansion of point-of-care testing (POCT) capabilities presents a significant opportunity for developing rapid, portable GA assay kits that can be used in diverse clinical settings, including primary care physician offices and remote areas. The increasing focus on gestational diabetes screening and management offers a substantial growth avenue, as GA testing is a valuable tool for monitoring glucose control during pregnancy. Furthermore, exploring new clinical applications for GA monitoring beyond diabetes and kidney disease, such as in the management of liver cirrhosis or other metabolic disorders, could unlock novel market segments.
Leading Players in the Glycated Albumin Assay Kit Market
- Asahi Kasei Group
- Lucica
- Weldonbiotech
- LSBio
- Abbexa
- FineTest
- ZellBio GmbH
- EKF Diagnostics
- DxGen
- JINDE BIOTECH
- Beijing Tsingke Biotech
- Zhejiang Aikang Biotechnology
- NanJing SenBeiJia Biotechnology
- Tellgen
- Zhejiang Kangte Biotechnology
Key Developments in Glycated Albumin Assay Kit Industry
- 2023 (Ongoing): Increased focus on developing highly sensitive and specific GA assay kits for improved diagnostic accuracy.
- 2022/2023: Expansion of product portfolios by key players to cater to a wider range of automated immunoassay platforms.
- 2021: Significant investments in R&D for novel GA detection technologies, aiming to reduce assay times and improve cost-effectiveness.
- 2020: Emerging collaborations between assay kit manufacturers and diagnostic instrument providers to enhance integrated testing solutions.
- 2019: Growing awareness and adoption of GA testing for gestational diabetes management across various regions.
Future Outlook for Glycated Albumin Assay Kit Market
The future outlook for the Glycated Albumin (GA) Assay Kit market is exceptionally positive, driven by the persistent and growing global burden of diabetes and kidney diseases. Advancements in diagnostic technologies, including the development of more sensitive, faster, and cost-effective assay kits, will continue to fuel market expansion. The increasing integration of GA testing into routine clinical practice, particularly for short-term glycemic control monitoring and in the management of comorbidities, will solidify its market position. Furthermore, the untapped potential in emerging economies and the growing trend towards personalized healthcare approaches represent significant growth accelerators. Strategic partnerships, product innovations, and the exploration of new applications will be key to capitalizing on the vast opportunities within this evolving market.
Glycated Albumin Assay Kit Segmentation
-
1. Application
- 1.1. Diabetes
- 1.2. Kidney Failure
- 1.3. Poor Blood
- 1.4. Liver Cirrhosis
- 1.5. Others
-
2. Types
- 2.1. Bromcresol Green (BCG)
- 2.2. Bromcresol Purple (BCP)
Glycated Albumin Assay Kit Segmentation By Geography
-
1. North America
- 1.1. United States
- 1.2. Canada
- 1.3. Mexico
-
2. South America
- 2.1. Brazil
- 2.2. Argentina
- 2.3. Rest of South America
-
3. Europe
- 3.1. United Kingdom
- 3.2. Germany
- 3.3. France
- 3.4. Italy
- 3.5. Spain
- 3.6. Russia
- 3.7. Benelux
- 3.8. Nordics
- 3.9. Rest of Europe
-
4. Middle East & Africa
- 4.1. Turkey
- 4.2. Israel
- 4.3. GCC
- 4.4. North Africa
- 4.5. South Africa
- 4.6. Rest of Middle East & Africa
-
5. Asia Pacific
- 5.1. China
- 5.2. India
- 5.3. Japan
- 5.4. South Korea
- 5.5. ASEAN
- 5.6. Oceania
- 5.7. Rest of Asia Pacific
Glycated Albumin Assay Kit Regional Market Share
Geographic Coverage of Glycated Albumin Assay Kit
Glycated Albumin Assay Kit REPORT HIGHLIGHTS
| Aspects | Details |
|---|---|
| Study Period | 2020-2034 |
| Base Year | 2025 |
| Estimated Year | 2026 |
| Forecast Period | 2026-2034 |
| Historical Period | 2020-2025 |
| Growth Rate | CAGR of 8.4% from 2020-2034 |
| Segmentation |
|
Table of Contents
- 1. Introduction
- 1.1. Research Scope
- 1.2. Market Segmentation
- 1.3. Research Objective
- 1.4. Definitions and Assumptions
- 2. Executive Summary
- 2.1. Market Snapshot
- 3. Market Dynamics
- 3.1. Market Drivers
- 3.2. Market Restrains
- 3.3. Market Trends
- 3.4. Market Opportunities
- 4. Market Factor Analysis
- 4.1. Porters Five Forces
- 4.1.1. Bargaining Power of Suppliers
- 4.1.2. Bargaining Power of Buyers
- 4.1.3. Threat of New Entrants
- 4.1.4. Threat of Substitutes
- 4.1.5. Competitive Rivalry
- 4.2. PESTEL analysis
- 4.3. BCG Analysis
- 4.3.1. Stars (High Growth, High Market Share)
- 4.3.2. Cash Cows (Low Growth, High Market Share)
- 4.3.3. Question Mark (High Growth, Low Market Share)
- 4.3.4. Dogs (Low Growth, Low Market Share)
- 4.4. Ansoff Matrix Analysis
- 4.5. Supply Chain Analysis
- 4.6. Regulatory Landscape
- 4.7. Current Market Potential and Opportunity Assessment (TAM–SAM–SOM Framework)
- 4.8. PRI Analyst Note
- 4.1. Porters Five Forces
- 5. Market Analysis, Insights and Forecast 2021-2033
- 5.1. Market Analysis, Insights and Forecast - by Application
- 5.1.1. Diabetes
- 5.1.2. Kidney Failure
- 5.1.3. Poor Blood
- 5.1.4. Liver Cirrhosis
- 5.1.5. Others
- 5.2. Market Analysis, Insights and Forecast - by Types
- 5.2.1. Bromcresol Green (BCG)
- 5.2.2. Bromcresol Purple (BCP)
- 5.3. Market Analysis, Insights and Forecast - by Region
- 5.3.1. North America
- 5.3.2. South America
- 5.3.3. Europe
- 5.3.4. Middle East & Africa
- 5.3.5. Asia Pacific
- 5.1. Market Analysis, Insights and Forecast - by Application
- 6. Global Glycated Albumin Assay Kit Analysis, Insights and Forecast, 2021-2033
- 6.1. Market Analysis, Insights and Forecast - by Application
- 6.1.1. Diabetes
- 6.1.2. Kidney Failure
- 6.1.3. Poor Blood
- 6.1.4. Liver Cirrhosis
- 6.1.5. Others
- 6.2. Market Analysis, Insights and Forecast - by Types
- 6.2.1. Bromcresol Green (BCG)
- 6.2.2. Bromcresol Purple (BCP)
- 6.1. Market Analysis, Insights and Forecast - by Application
- 7. North America Glycated Albumin Assay Kit Analysis, Insights and Forecast, 2020-2032
- 7.1. Market Analysis, Insights and Forecast - by Application
- 7.1.1. Diabetes
- 7.1.2. Kidney Failure
- 7.1.3. Poor Blood
- 7.1.4. Liver Cirrhosis
- 7.1.5. Others
- 7.2. Market Analysis, Insights and Forecast - by Types
- 7.2.1. Bromcresol Green (BCG)
- 7.2.2. Bromcresol Purple (BCP)
- 7.1. Market Analysis, Insights and Forecast - by Application
- 8. South America Glycated Albumin Assay Kit Analysis, Insights and Forecast, 2020-2032
- 8.1. Market Analysis, Insights and Forecast - by Application
- 8.1.1. Diabetes
- 8.1.2. Kidney Failure
- 8.1.3. Poor Blood
- 8.1.4. Liver Cirrhosis
- 8.1.5. Others
- 8.2. Market Analysis, Insights and Forecast - by Types
- 8.2.1. Bromcresol Green (BCG)
- 8.2.2. Bromcresol Purple (BCP)
- 8.1. Market Analysis, Insights and Forecast - by Application
- 9. Europe Glycated Albumin Assay Kit Analysis, Insights and Forecast, 2020-2032
- 9.1. Market Analysis, Insights and Forecast - by Application
- 9.1.1. Diabetes
- 9.1.2. Kidney Failure
- 9.1.3. Poor Blood
- 9.1.4. Liver Cirrhosis
- 9.1.5. Others
- 9.2. Market Analysis, Insights and Forecast - by Types
- 9.2.1. Bromcresol Green (BCG)
- 9.2.2. Bromcresol Purple (BCP)
- 9.1. Market Analysis, Insights and Forecast - by Application
- 10. Middle East & Africa Glycated Albumin Assay Kit Analysis, Insights and Forecast, 2020-2032
- 10.1. Market Analysis, Insights and Forecast - by Application
- 10.1.1. Diabetes
- 10.1.2. Kidney Failure
- 10.1.3. Poor Blood
- 10.1.4. Liver Cirrhosis
- 10.1.5. Others
- 10.2. Market Analysis, Insights and Forecast - by Types
- 10.2.1. Bromcresol Green (BCG)
- 10.2.2. Bromcresol Purple (BCP)
- 10.1. Market Analysis, Insights and Forecast - by Application
- 11. Asia Pacific Glycated Albumin Assay Kit Analysis, Insights and Forecast, 2020-2032
- 11.1. Market Analysis, Insights and Forecast - by Application
- 11.1.1. Diabetes
- 11.1.2. Kidney Failure
- 11.1.3. Poor Blood
- 11.1.4. Liver Cirrhosis
- 11.1.5. Others
- 11.2. Market Analysis, Insights and Forecast - by Types
- 11.2.1. Bromcresol Green (BCG)
- 11.2.2. Bromcresol Purple (BCP)
- 11.1. Market Analysis, Insights and Forecast - by Application
- 12. Competitive Analysis
- 12.1. Company Profiles
- 12.1.1 Asahi Kasei Group
- 12.1.1.1. Company Overview
- 12.1.1.2. Products
- 12.1.1.3. Company Financials
- 12.1.1.4. SWOT Analysis
- 12.1.2 Lucica
- 12.1.2.1. Company Overview
- 12.1.2.2. Products
- 12.1.2.3. Company Financials
- 12.1.2.4. SWOT Analysis
- 12.1.3 Weldonbiotech
- 12.1.3.1. Company Overview
- 12.1.3.2. Products
- 12.1.3.3. Company Financials
- 12.1.3.4. SWOT Analysis
- 12.1.4 LSBio
- 12.1.4.1. Company Overview
- 12.1.4.2. Products
- 12.1.4.3. Company Financials
- 12.1.4.4. SWOT Analysis
- 12.1.5 Abbexa
- 12.1.5.1. Company Overview
- 12.1.5.2. Products
- 12.1.5.3. Company Financials
- 12.1.5.4. SWOT Analysis
- 12.1.6 FineTest
- 12.1.6.1. Company Overview
- 12.1.6.2. Products
- 12.1.6.3. Company Financials
- 12.1.6.4. SWOT Analysis
- 12.1.7 ZellBio GmbH
- 12.1.7.1. Company Overview
- 12.1.7.2. Products
- 12.1.7.3. Company Financials
- 12.1.7.4. SWOT Analysis
- 12.1.8 EKF Diagnostics
- 12.1.8.1. Company Overview
- 12.1.8.2. Products
- 12.1.8.3. Company Financials
- 12.1.8.4. SWOT Analysis
- 12.1.9 DxGen
- 12.1.9.1. Company Overview
- 12.1.9.2. Products
- 12.1.9.3. Company Financials
- 12.1.9.4. SWOT Analysis
- 12.1.10 JINDE BIOTECH
- 12.1.10.1. Company Overview
- 12.1.10.2. Products
- 12.1.10.3. Company Financials
- 12.1.10.4. SWOT Analysis
- 12.1.11 Beijing Tsingke Biotech
- 12.1.11.1. Company Overview
- 12.1.11.2. Products
- 12.1.11.3. Company Financials
- 12.1.11.4. SWOT Analysis
- 12.1.12 Zhejiang Aikang Biotechnology
- 12.1.12.1. Company Overview
- 12.1.12.2. Products
- 12.1.12.3. Company Financials
- 12.1.12.4. SWOT Analysis
- 12.1.13 NanJing SenBeiJia Biotechnology
- 12.1.13.1. Company Overview
- 12.1.13.2. Products
- 12.1.13.3. Company Financials
- 12.1.13.4. SWOT Analysis
- 12.1.14 Tellgen
- 12.1.14.1. Company Overview
- 12.1.14.2. Products
- 12.1.14.3. Company Financials
- 12.1.14.4. SWOT Analysis
- 12.1.15 Zhejiang Kangte Biotechnology
- 12.1.15.1. Company Overview
- 12.1.15.2. Products
- 12.1.15.3. Company Financials
- 12.1.15.4. SWOT Analysis
- 12.1.1 Asahi Kasei Group
- 12.2. Market Entropy
- 12.2.1 Company's Key Areas Served
- 12.2.2 Recent Developments
- 12.3. Company Market Share Analysis 2025
- 12.3.1 Top 5 Companies Market Share Analysis
- 12.3.2 Top 3 Companies Market Share Analysis
- 12.4. List of Potential Customers
- 13. Research Methodology
List of Figures
- Figure 1: Global Glycated Albumin Assay Kit Revenue Breakdown (million, %) by Region 2025 & 2033
- Figure 2: Global Glycated Albumin Assay Kit Volume Breakdown (K, %) by Region 2025 & 2033
- Figure 3: North America Glycated Albumin Assay Kit Revenue (million), by Application 2025 & 2033
- Figure 4: North America Glycated Albumin Assay Kit Volume (K), by Application 2025 & 2033
- Figure 5: North America Glycated Albumin Assay Kit Revenue Share (%), by Application 2025 & 2033
- Figure 6: North America Glycated Albumin Assay Kit Volume Share (%), by Application 2025 & 2033
- Figure 7: North America Glycated Albumin Assay Kit Revenue (million), by Types 2025 & 2033
- Figure 8: North America Glycated Albumin Assay Kit Volume (K), by Types 2025 & 2033
- Figure 9: North America Glycated Albumin Assay Kit Revenue Share (%), by Types 2025 & 2033
- Figure 10: North America Glycated Albumin Assay Kit Volume Share (%), by Types 2025 & 2033
- Figure 11: North America Glycated Albumin Assay Kit Revenue (million), by Country 2025 & 2033
- Figure 12: North America Glycated Albumin Assay Kit Volume (K), by Country 2025 & 2033
- Figure 13: North America Glycated Albumin Assay Kit Revenue Share (%), by Country 2025 & 2033
- Figure 14: North America Glycated Albumin Assay Kit Volume Share (%), by Country 2025 & 2033
- Figure 15: South America Glycated Albumin Assay Kit Revenue (million), by Application 2025 & 2033
- Figure 16: South America Glycated Albumin Assay Kit Volume (K), by Application 2025 & 2033
- Figure 17: South America Glycated Albumin Assay Kit Revenue Share (%), by Application 2025 & 2033
- Figure 18: South America Glycated Albumin Assay Kit Volume Share (%), by Application 2025 & 2033
- Figure 19: South America Glycated Albumin Assay Kit Revenue (million), by Types 2025 & 2033
- Figure 20: South America Glycated Albumin Assay Kit Volume (K), by Types 2025 & 2033
- Figure 21: South America Glycated Albumin Assay Kit Revenue Share (%), by Types 2025 & 2033
- Figure 22: South America Glycated Albumin Assay Kit Volume Share (%), by Types 2025 & 2033
- Figure 23: South America Glycated Albumin Assay Kit Revenue (million), by Country 2025 & 2033
- Figure 24: South America Glycated Albumin Assay Kit Volume (K), by Country 2025 & 2033
- Figure 25: South America Glycated Albumin Assay Kit Revenue Share (%), by Country 2025 & 2033
- Figure 26: South America Glycated Albumin Assay Kit Volume Share (%), by Country 2025 & 2033
- Figure 27: Europe Glycated Albumin Assay Kit Revenue (million), by Application 2025 & 2033
- Figure 28: Europe Glycated Albumin Assay Kit Volume (K), by Application 2025 & 2033
- Figure 29: Europe Glycated Albumin Assay Kit Revenue Share (%), by Application 2025 & 2033
- Figure 30: Europe Glycated Albumin Assay Kit Volume Share (%), by Application 2025 & 2033
- Figure 31: Europe Glycated Albumin Assay Kit Revenue (million), by Types 2025 & 2033
- Figure 32: Europe Glycated Albumin Assay Kit Volume (K), by Types 2025 & 2033
- Figure 33: Europe Glycated Albumin Assay Kit Revenue Share (%), by Types 2025 & 2033
- Figure 34: Europe Glycated Albumin Assay Kit Volume Share (%), by Types 2025 & 2033
- Figure 35: Europe Glycated Albumin Assay Kit Revenue (million), by Country 2025 & 2033
- Figure 36: Europe Glycated Albumin Assay Kit Volume (K), by Country 2025 & 2033
- Figure 37: Europe Glycated Albumin Assay Kit Revenue Share (%), by Country 2025 & 2033
- Figure 38: Europe Glycated Albumin Assay Kit Volume Share (%), by Country 2025 & 2033
- Figure 39: Middle East & Africa Glycated Albumin Assay Kit Revenue (million), by Application 2025 & 2033
- Figure 40: Middle East & Africa Glycated Albumin Assay Kit Volume (K), by Application 2025 & 2033
- Figure 41: Middle East & Africa Glycated Albumin Assay Kit Revenue Share (%), by Application 2025 & 2033
- Figure 42: Middle East & Africa Glycated Albumin Assay Kit Volume Share (%), by Application 2025 & 2033
- Figure 43: Middle East & Africa Glycated Albumin Assay Kit Revenue (million), by Types 2025 & 2033
- Figure 44: Middle East & Africa Glycated Albumin Assay Kit Volume (K), by Types 2025 & 2033
- Figure 45: Middle East & Africa Glycated Albumin Assay Kit Revenue Share (%), by Types 2025 & 2033
- Figure 46: Middle East & Africa Glycated Albumin Assay Kit Volume Share (%), by Types 2025 & 2033
- Figure 47: Middle East & Africa Glycated Albumin Assay Kit Revenue (million), by Country 2025 & 2033
- Figure 48: Middle East & Africa Glycated Albumin Assay Kit Volume (K), by Country 2025 & 2033
- Figure 49: Middle East & Africa Glycated Albumin Assay Kit Revenue Share (%), by Country 2025 & 2033
- Figure 50: Middle East & Africa Glycated Albumin Assay Kit Volume Share (%), by Country 2025 & 2033
- Figure 51: Asia Pacific Glycated Albumin Assay Kit Revenue (million), by Application 2025 & 2033
- Figure 52: Asia Pacific Glycated Albumin Assay Kit Volume (K), by Application 2025 & 2033
- Figure 53: Asia Pacific Glycated Albumin Assay Kit Revenue Share (%), by Application 2025 & 2033
- Figure 54: Asia Pacific Glycated Albumin Assay Kit Volume Share (%), by Application 2025 & 2033
- Figure 55: Asia Pacific Glycated Albumin Assay Kit Revenue (million), by Types 2025 & 2033
- Figure 56: Asia Pacific Glycated Albumin Assay Kit Volume (K), by Types 2025 & 2033
- Figure 57: Asia Pacific Glycated Albumin Assay Kit Revenue Share (%), by Types 2025 & 2033
- Figure 58: Asia Pacific Glycated Albumin Assay Kit Volume Share (%), by Types 2025 & 2033
- Figure 59: Asia Pacific Glycated Albumin Assay Kit Revenue (million), by Country 2025 & 2033
- Figure 60: Asia Pacific Glycated Albumin Assay Kit Volume (K), by Country 2025 & 2033
- Figure 61: Asia Pacific Glycated Albumin Assay Kit Revenue Share (%), by Country 2025 & 2033
- Figure 62: Asia Pacific Glycated Albumin Assay Kit Volume Share (%), by Country 2025 & 2033
List of Tables
- Table 1: Global Glycated Albumin Assay Kit Revenue million Forecast, by Application 2020 & 2033
- Table 2: Global Glycated Albumin Assay Kit Volume K Forecast, by Application 2020 & 2033
- Table 3: Global Glycated Albumin Assay Kit Revenue million Forecast, by Types 2020 & 2033
- Table 4: Global Glycated Albumin Assay Kit Volume K Forecast, by Types 2020 & 2033
- Table 5: Global Glycated Albumin Assay Kit Revenue million Forecast, by Region 2020 & 2033
- Table 6: Global Glycated Albumin Assay Kit Volume K Forecast, by Region 2020 & 2033
- Table 7: Global Glycated Albumin Assay Kit Revenue million Forecast, by Application 2020 & 2033
- Table 8: Global Glycated Albumin Assay Kit Volume K Forecast, by Application 2020 & 2033
- Table 9: Global Glycated Albumin Assay Kit Revenue million Forecast, by Types 2020 & 2033
- Table 10: Global Glycated Albumin Assay Kit Volume K Forecast, by Types 2020 & 2033
- Table 11: Global Glycated Albumin Assay Kit Revenue million Forecast, by Country 2020 & 2033
- Table 12: Global Glycated Albumin Assay Kit Volume K Forecast, by Country 2020 & 2033
- Table 13: United States Glycated Albumin Assay Kit Revenue (million) Forecast, by Application 2020 & 2033
- Table 14: United States Glycated Albumin Assay Kit Volume (K) Forecast, by Application 2020 & 2033
- Table 15: Canada Glycated Albumin Assay Kit Revenue (million) Forecast, by Application 2020 & 2033
- Table 16: Canada Glycated Albumin Assay Kit Volume (K) Forecast, by Application 2020 & 2033
- Table 17: Mexico Glycated Albumin Assay Kit Revenue (million) Forecast, by Application 2020 & 2033
- Table 18: Mexico Glycated Albumin Assay Kit Volume (K) Forecast, by Application 2020 & 2033
- Table 19: Global Glycated Albumin Assay Kit Revenue million Forecast, by Application 2020 & 2033
- Table 20: Global Glycated Albumin Assay Kit Volume K Forecast, by Application 2020 & 2033
- Table 21: Global Glycated Albumin Assay Kit Revenue million Forecast, by Types 2020 & 2033
- Table 22: Global Glycated Albumin Assay Kit Volume K Forecast, by Types 2020 & 2033
- Table 23: Global Glycated Albumin Assay Kit Revenue million Forecast, by Country 2020 & 2033
- Table 24: Global Glycated Albumin Assay Kit Volume K Forecast, by Country 2020 & 2033
- Table 25: Brazil Glycated Albumin Assay Kit Revenue (million) Forecast, by Application 2020 & 2033
- Table 26: Brazil Glycated Albumin Assay Kit Volume (K) Forecast, by Application 2020 & 2033
- Table 27: Argentina Glycated Albumin Assay Kit Revenue (million) Forecast, by Application 2020 & 2033
- Table 28: Argentina Glycated Albumin Assay Kit Volume (K) Forecast, by Application 2020 & 2033
- Table 29: Rest of South America Glycated Albumin Assay Kit Revenue (million) Forecast, by Application 2020 & 2033
- Table 30: Rest of South America Glycated Albumin Assay Kit Volume (K) Forecast, by Application 2020 & 2033
- Table 31: Global Glycated Albumin Assay Kit Revenue million Forecast, by Application 2020 & 2033
- Table 32: Global Glycated Albumin Assay Kit Volume K Forecast, by Application 2020 & 2033
- Table 33: Global Glycated Albumin Assay Kit Revenue million Forecast, by Types 2020 & 2033
- Table 34: Global Glycated Albumin Assay Kit Volume K Forecast, by Types 2020 & 2033
- Table 35: Global Glycated Albumin Assay Kit Revenue million Forecast, by Country 2020 & 2033
- Table 36: Global Glycated Albumin Assay Kit Volume K Forecast, by Country 2020 & 2033
- Table 37: United Kingdom Glycated Albumin Assay Kit Revenue (million) Forecast, by Application 2020 & 2033
- Table 38: United Kingdom Glycated Albumin Assay Kit Volume (K) Forecast, by Application 2020 & 2033
- Table 39: Germany Glycated Albumin Assay Kit Revenue (million) Forecast, by Application 2020 & 2033
- Table 40: Germany Glycated Albumin Assay Kit Volume (K) Forecast, by Application 2020 & 2033
- Table 41: France Glycated Albumin Assay Kit Revenue (million) Forecast, by Application 2020 & 2033
- Table 42: France Glycated Albumin Assay Kit Volume (K) Forecast, by Application 2020 & 2033
- Table 43: Italy Glycated Albumin Assay Kit Revenue (million) Forecast, by Application 2020 & 2033
- Table 44: Italy Glycated Albumin Assay Kit Volume (K) Forecast, by Application 2020 & 2033
- Table 45: Spain Glycated Albumin Assay Kit Revenue (million) Forecast, by Application 2020 & 2033
- Table 46: Spain Glycated Albumin Assay Kit Volume (K) Forecast, by Application 2020 & 2033
- Table 47: Russia Glycated Albumin Assay Kit Revenue (million) Forecast, by Application 2020 & 2033
- Table 48: Russia Glycated Albumin Assay Kit Volume (K) Forecast, by Application 2020 & 2033
- Table 49: Benelux Glycated Albumin Assay Kit Revenue (million) Forecast, by Application 2020 & 2033
- Table 50: Benelux Glycated Albumin Assay Kit Volume (K) Forecast, by Application 2020 & 2033
- Table 51: Nordics Glycated Albumin Assay Kit Revenue (million) Forecast, by Application 2020 & 2033
- Table 52: Nordics Glycated Albumin Assay Kit Volume (K) Forecast, by Application 2020 & 2033
- Table 53: Rest of Europe Glycated Albumin Assay Kit Revenue (million) Forecast, by Application 2020 & 2033
- Table 54: Rest of Europe Glycated Albumin Assay Kit Volume (K) Forecast, by Application 2020 & 2033
- Table 55: Global Glycated Albumin Assay Kit Revenue million Forecast, by Application 2020 & 2033
- Table 56: Global Glycated Albumin Assay Kit Volume K Forecast, by Application 2020 & 2033
- Table 57: Global Glycated Albumin Assay Kit Revenue million Forecast, by Types 2020 & 2033
- Table 58: Global Glycated Albumin Assay Kit Volume K Forecast, by Types 2020 & 2033
- Table 59: Global Glycated Albumin Assay Kit Revenue million Forecast, by Country 2020 & 2033
- Table 60: Global Glycated Albumin Assay Kit Volume K Forecast, by Country 2020 & 2033
- Table 61: Turkey Glycated Albumin Assay Kit Revenue (million) Forecast, by Application 2020 & 2033
- Table 62: Turkey Glycated Albumin Assay Kit Volume (K) Forecast, by Application 2020 & 2033
- Table 63: Israel Glycated Albumin Assay Kit Revenue (million) Forecast, by Application 2020 & 2033
- Table 64: Israel Glycated Albumin Assay Kit Volume (K) Forecast, by Application 2020 & 2033
- Table 65: GCC Glycated Albumin Assay Kit Revenue (million) Forecast, by Application 2020 & 2033
- Table 66: GCC Glycated Albumin Assay Kit Volume (K) Forecast, by Application 2020 & 2033
- Table 67: North Africa Glycated Albumin Assay Kit Revenue (million) Forecast, by Application 2020 & 2033
- Table 68: North Africa Glycated Albumin Assay Kit Volume (K) Forecast, by Application 2020 & 2033
- Table 69: South Africa Glycated Albumin Assay Kit Revenue (million) Forecast, by Application 2020 & 2033
- Table 70: South Africa Glycated Albumin Assay Kit Volume (K) Forecast, by Application 2020 & 2033
- Table 71: Rest of Middle East & Africa Glycated Albumin Assay Kit Revenue (million) Forecast, by Application 2020 & 2033
- Table 72: Rest of Middle East & Africa Glycated Albumin Assay Kit Volume (K) Forecast, by Application 2020 & 2033
- Table 73: Global Glycated Albumin Assay Kit Revenue million Forecast, by Application 2020 & 2033
- Table 74: Global Glycated Albumin Assay Kit Volume K Forecast, by Application 2020 & 2033
- Table 75: Global Glycated Albumin Assay Kit Revenue million Forecast, by Types 2020 & 2033
- Table 76: Global Glycated Albumin Assay Kit Volume K Forecast, by Types 2020 & 2033
- Table 77: Global Glycated Albumin Assay Kit Revenue million Forecast, by Country 2020 & 2033
- Table 78: Global Glycated Albumin Assay Kit Volume K Forecast, by Country 2020 & 2033
- Table 79: China Glycated Albumin Assay Kit Revenue (million) Forecast, by Application 2020 & 2033
- Table 80: China Glycated Albumin Assay Kit Volume (K) Forecast, by Application 2020 & 2033
- Table 81: India Glycated Albumin Assay Kit Revenue (million) Forecast, by Application 2020 & 2033
- Table 82: India Glycated Albumin Assay Kit Volume (K) Forecast, by Application 2020 & 2033
- Table 83: Japan Glycated Albumin Assay Kit Revenue (million) Forecast, by Application 2020 & 2033
- Table 84: Japan Glycated Albumin Assay Kit Volume (K) Forecast, by Application 2020 & 2033
- Table 85: South Korea Glycated Albumin Assay Kit Revenue (million) Forecast, by Application 2020 & 2033
- Table 86: South Korea Glycated Albumin Assay Kit Volume (K) Forecast, by Application 2020 & 2033
- Table 87: ASEAN Glycated Albumin Assay Kit Revenue (million) Forecast, by Application 2020 & 2033
- Table 88: ASEAN Glycated Albumin Assay Kit Volume (K) Forecast, by Application 2020 & 2033
- Table 89: Oceania Glycated Albumin Assay Kit Revenue (million) Forecast, by Application 2020 & 2033
- Table 90: Oceania Glycated Albumin Assay Kit Volume (K) Forecast, by Application 2020 & 2033
- Table 91: Rest of Asia Pacific Glycated Albumin Assay Kit Revenue (million) Forecast, by Application 2020 & 2033
- Table 92: Rest of Asia Pacific Glycated Albumin Assay Kit Volume (K) Forecast, by Application 2020 & 2033
Frequently Asked Questions
1. What is the projected Compound Annual Growth Rate (CAGR) of the Glycated Albumin Assay Kit?
The projected CAGR is approximately 8.4%.
2. Which companies are prominent players in the Glycated Albumin Assay Kit?
Key companies in the market include Asahi Kasei Group, Lucica, Weldonbiotech, LSBio, Abbexa, FineTest, ZellBio GmbH, EKF Diagnostics, DxGen, JINDE BIOTECH, Beijing Tsingke Biotech, Zhejiang Aikang Biotechnology, NanJing SenBeiJia Biotechnology, Tellgen, Zhejiang Kangte Biotechnology.
3. What are the main segments of the Glycated Albumin Assay Kit?
The market segments include Application, Types.
4. Can you provide details about the market size?
The market size is estimated to be USD 242.7 million as of 2022.
5. What are some drivers contributing to market growth?
N/A
6. What are the notable trends driving market growth?
N/A
7. Are there any restraints impacting market growth?
N/A
8. Can you provide examples of recent developments in the market?
N/A
9. What pricing options are available for accessing the report?
Pricing options include single-user, multi-user, and enterprise licenses priced at USD 3950.00, USD 5925.00, and USD 7900.00 respectively.
10. Is the market size provided in terms of value or volume?
The market size is provided in terms of value, measured in million and volume, measured in K.
11. Are there any specific market keywords associated with the report?
Yes, the market keyword associated with the report is "Glycated Albumin Assay Kit," which aids in identifying and referencing the specific market segment covered.
12. How do I determine which pricing option suits my needs best?
The pricing options vary based on user requirements and access needs. Individual users may opt for single-user licenses, while businesses requiring broader access may choose multi-user or enterprise licenses for cost-effective access to the report.
13. Are there any additional resources or data provided in the Glycated Albumin Assay Kit report?
While the report offers comprehensive insights, it's advisable to review the specific contents or supplementary materials provided to ascertain if additional resources or data are available.
14. How can I stay updated on further developments or reports in the Glycated Albumin Assay Kit?
To stay informed about further developments, trends, and reports in the Glycated Albumin Assay Kit, consider subscribing to industry newsletters, following relevant companies and organizations, or regularly checking reputable industry news sources and publications.
Methodology
Step 1 - Identification of Relevant Samples Size from Population Database


Step 2 - Approaches for Defining Global Market Size (Value, Volume* & Price*)

Note*: In applicable scenarios
Step 3 - Data Sources
Primary Research
- Web Analytics
- Survey Reports
- Research Institute
- Latest Research Reports
- Opinion Leaders
Secondary Research
- Annual Reports
- White Paper
- Latest Press Release
- Industry Association
- Paid Database
- Investor Presentations

Step 4 - Data Triangulation
Involves using different sources of information in order to increase the validity of a study
These sources are likely to be stakeholders in a program - participants, other researchers, program staff, other community members, and so on.
Then we put all data in single framework & apply various statistical tools to find out the dynamic on the market.
During the analysis stage, feedback from the stakeholder groups would be compared to determine areas of agreement as well as areas of divergence