
Key Insights
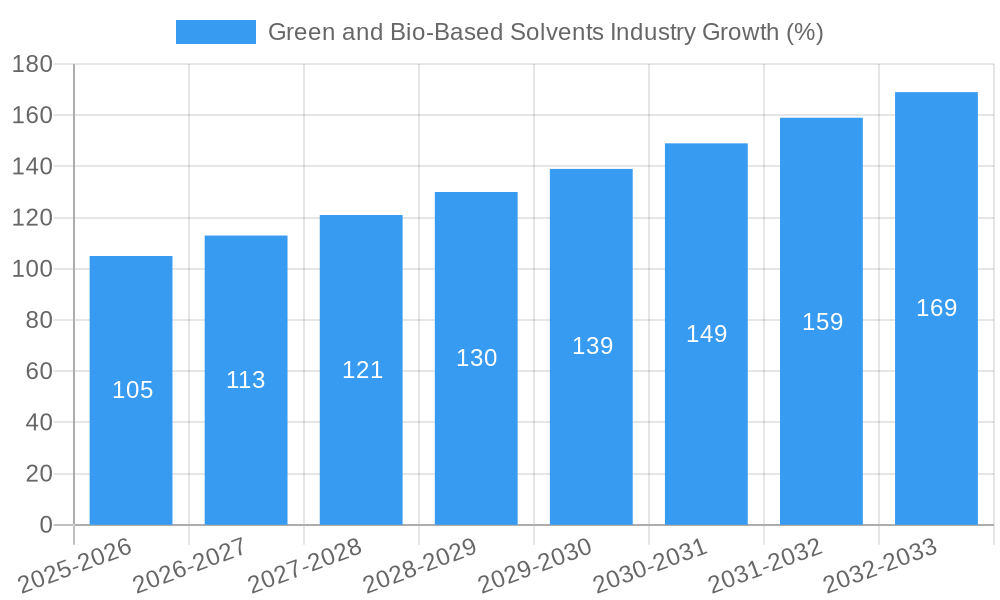
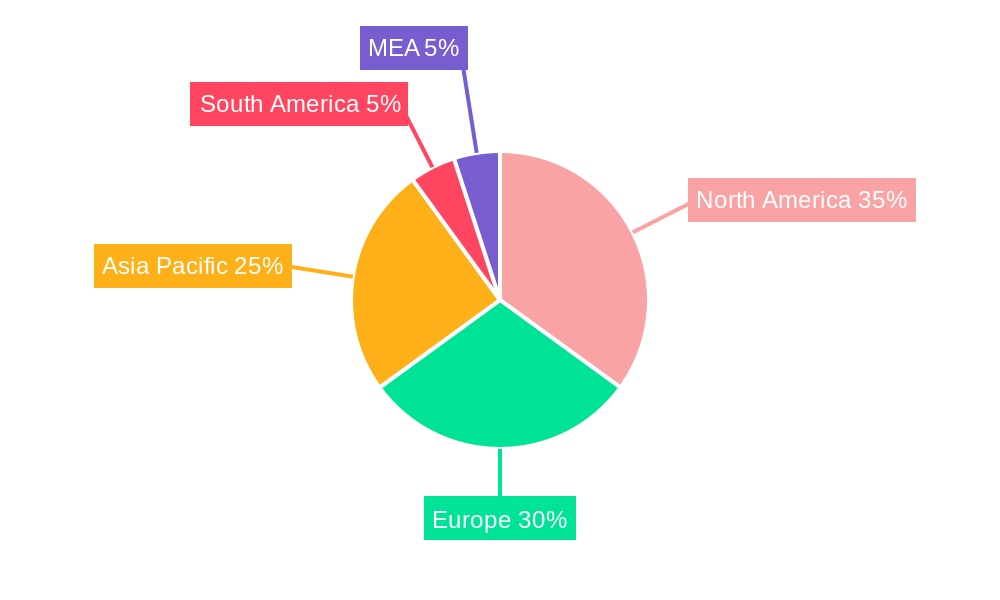
The Green and Bio-Based Solvents market is experiencing robust growth, projected to maintain a CAGR exceeding 7% from 2025 to 2033. This expansion is driven by increasing environmental concerns, stringent regulations on volatile organic compounds (VOCs) in traditional solvents, and growing demand for sustainable alternatives across various industries. Key application segments, such as paints and coatings, industrial and domestic cleaning, and personal care products, are significant contributors to market growth. The bio-alcohols segment, encompassing bio-ethanol and bio-butanol, currently holds a substantial market share, owing to their established production processes and wide applicability. However, segments like bio-glycols and bio-based ethylene glycol are witnessing rapid growth fueled by innovation and increasing applications in specialized industries. The market's geographical landscape reveals strong performance in North America and Europe, driven by established regulatory frameworks and consumer awareness. Asia-Pacific, however, is anticipated to demonstrate significant growth potential over the forecast period due to rising industrialization and increasing adoption of sustainable practices.
Leading market players, including Cargill, Dow, and Elevance Renewable Sciences, are actively investing in research and development, expanding production capacities, and forging strategic partnerships to capitalize on this expanding market. Despite the positive outlook, challenges remain, including the relatively higher cost of production compared to conventional solvents and the need for further technological advancements to enhance the efficiency and scalability of bio-based solvent production. Overcoming these hurdles will be crucial for the continued sustainable growth of the green and bio-based solvents market. Future growth hinges on technological breakthroughs that reduce production costs, expand the range of applications, and enhance the performance characteristics of bio-based solvents to compete effectively with their traditional counterparts. The increasing availability of feedstocks and government initiatives promoting sustainable chemistry will further propel market expansion.
Green and Bio-Based Solvents Industry: Market Analysis Report (2019-2033)
This comprehensive report provides an in-depth analysis of the Green and Bio-Based Solvents industry, offering crucial insights for industry professionals, investors, and strategic decision-makers. We examine market dynamics, leading players, emerging trends, and future growth projections from 2019 to 2033, with a focus on the estimated year 2025. The report leverages extensive market research and data analysis to deliver actionable intelligence on this rapidly evolving sector.
Green and Bio-Based Solvents Industry Market Structure & Innovation Trends
This section analyzes the competitive landscape, innovation drivers, and regulatory factors shaping the Green and Bio-Based Solvents market. The study period covers 2019-2033, with 2025 as the base and estimated year.
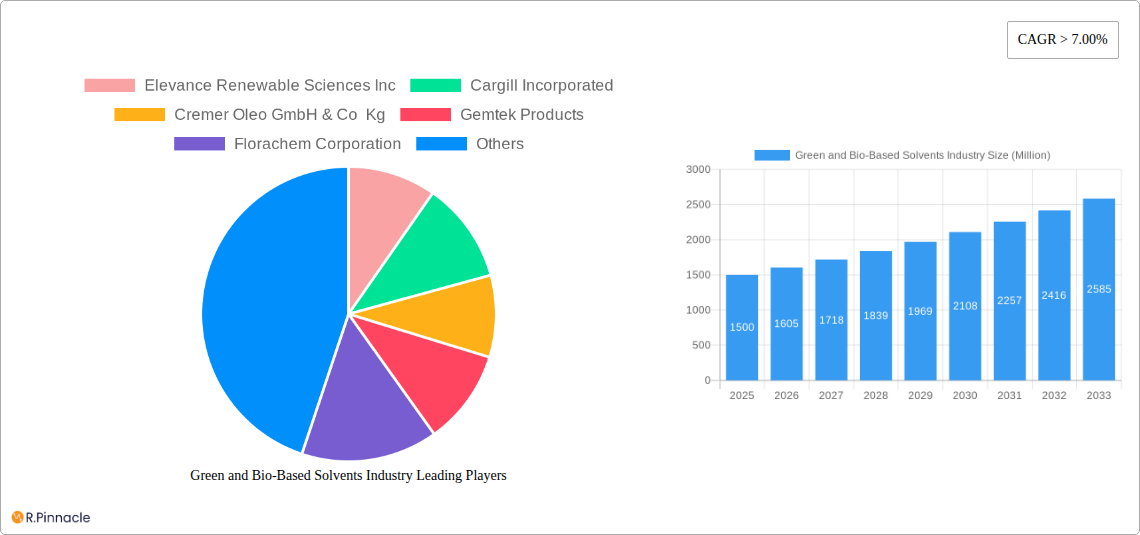
The market exhibits moderate concentration, with key players like Cargill Incorporated, Dow, and Elevance Renewable Sciences Inc. holding significant market share (estimated at xx% combined in 2025). However, the emergence of smaller, specialized companies is increasing competition.
- Market Concentration: xx% controlled by top 5 players in 2025.
- Innovation Drivers: Growing demand for sustainable alternatives, stringent environmental regulations, and advancements in bio-based chemistry are driving innovation.
- Regulatory Frameworks: Government policies promoting bio-based products and reducing reliance on petrochemical solvents are significantly influencing market growth.
- Product Substitutes: Competition from traditional petroleum-based solvents remains a challenge, although bio-based alternatives offer superior environmental profiles and are increasingly cost-competitive.
- End-User Demographics: The major end-use sectors are paints & coatings, industrial cleaning, and personal care, driving demand for specific solvent types.
- M&A Activities: The industry has witnessed several mergers and acquisitions (M&A) valued at approximately $xx Million in the past five years, mainly focused on expanding product portfolios and gaining market access. Examples include (but are not limited to) potential acquisitions by larger chemical companies of smaller, specialized bio-solvent producers.
Green and Bio-Based Solvents Industry Market Dynamics & Trends
This section delves into the key market dynamics, including growth drivers and challenges. The forecast period is 2025-2033.
The Green and Bio-Based Solvents market is experiencing robust growth, driven by the increasing consumer preference for eco-friendly products and stricter environmental regulations. The market is expected to achieve a CAGR of xx% during the forecast period (2025-2033), reaching a market size of $xx Million by 2033. This growth is fueled by several factors:
- Technological Disruptions: Advances in biotechnology and fermentation processes are enabling the cost-effective production of a wider range of bio-based solvents.
- Consumer Preferences: Growing environmental awareness among consumers is driving demand for sustainable products, including those using bio-based solvents.
- Competitive Dynamics: Intense competition among established chemical companies and emerging bio-based solvent producers is leading to price reductions and product innovation.
- Market Penetration: Bio-based solvents are gradually penetrating various application segments, with higher penetration rates observed in the paints and coatings industry. However, other sectors lag behind.
- Government Initiatives: Numerous government initiatives supporting sustainable chemistry and green technologies are further stimulating market expansion.
Dominant Regions & Segments in Green and Bio-Based Solvents Industry
This section identifies leading regions and segments within the Green and Bio-Based Solvents market.
Leading Region: North America currently holds the largest market share, driven by stringent environmental regulations and a robust bio-based economy. Europe and Asia-Pacific follow, with significant growth potential.
Dominant Segments:
- By Type: Bio-alcohols and Bio-glycols currently dominate the market due to their wide applicability and relatively mature production technologies. Ethyl Lactate and D-limonene are also experiencing significant growth.
- By Application: The paints and coatings segment is the largest consumer of green solvents, followed by industrial and domestic cleaning applications. The pharmaceutical and cosmetic segments are also showing substantial growth.
Key Drivers by Region:
- North America: Stringent environmental regulations, government incentives, and the presence of major players drive growth.
- Europe: Growing consumer awareness of environmental issues and supportive governmental policies contribute to the market's expansion.
- Asia-Pacific: Rapid industrialization and rising demand for sustainable products are fueling market growth in this region, though infrastructure limitations may present challenges.
Detailed analysis of market dominance within each region and segment is provided within the full report.
Green and Bio-Based Solvents Industry Product Innovations
Recent innovations focus on improving the performance characteristics of bio-based solvents, such as enhancing solvency power, reducing viscosity, and improving stability. New applications are continuously being explored, particularly in high-value sectors like pharmaceuticals and cosmetics. The industry is witnessing increased adoption of novel bio-based raw materials and advanced manufacturing processes to enhance cost-effectiveness and broaden product offerings.
Report Scope & Segmentation Analysis
This report comprehensively segments the Green and Bio-Based Solvents market by type (Bio-alcohols, Bio-butanol, Bio-glycols, Bio-based Ethylene Glycol, Bio-diols, Ethyl Lactate, D-limonene, Methyl Soyate, Other Types) and application (Paints and Coatings, Industrial and Domestic Cleaning, Printing Inks, Adhesives and Sealants, Pharmaceutical, Cosmetics, Agriculture, Other Applications). Each segment's growth trajectory, market size, and competitive landscape are analyzed to provide a holistic view of the industry. Growth projections are provided for each segment within the full report, detailing the projected market size (in Millions of dollars) and competitive dynamics for the forecast period (2025-2033).
Key Drivers of Green and Bio-Based Solvents Industry Growth
The growth of the Green and Bio-Based Solvents industry is driven by increasing environmental concerns, stringent regulations limiting volatile organic compound (VOC) emissions, and the growing demand for sustainable and biodegradable alternatives to traditional petroleum-based solvents. Government incentives and subsidies for the development and adoption of bio-based products further accelerate market expansion. Technological advancements in bio-based chemistry have also led to the development of high-performance bio-solvents that can replace petroleum-derived equivalents.
Challenges in the Green and Bio-Based Solvents Industry Sector
Despite significant growth potential, the industry faces challenges such as higher production costs compared to petroleum-based solvents, limited availability of suitable feedstock, and the need for further technological advancements to improve the performance and scalability of bio-based solvents. Furthermore, inconsistent regulatory frameworks across different regions may create hurdles for global market penetration. These challenges may impact the projected market growth, particularly in the initial years of the forecast period.
Emerging Opportunities in Green and Bio-Based Solvents Industry
Emerging opportunities lie in expanding into new applications, particularly in high-growth sectors like electronics, renewable energy, and advanced materials. The development of novel bio-based solvents with enhanced properties offers immense potential. Furthermore, collaborations between chemical companies and biotechnology firms can lead to the development of innovative and sustainable solutions, accelerating market growth.
Leading Players in the Green and Bio-Based Solvents Industry Market
- Elevance Renewable Sciences Inc
- Cargill Incorporated
- Cremer Oleo GmbH & Co Kg
- Gemtek Products
- Florachem Corporation
- Archer Daniels Midland Company (ADM)
- BioAmber Inc
- Bio Brands LLC
- Vertec BioSolvents
- Dow
- Galactic
- Florida Chemical Company
- Corbion NV
- LyondellBasell Industries Holdings BV
- Gevo
Key Developments in Green and Bio-Based Solvents Industry Industry
- 2022-Q4: Launch of a new bio-based solvent with enhanced performance by [Company Name].
- 2023-Q1: Acquisition of a smaller bio-solvent producer by a major chemical company. (Details need to be updated with actual company information).
- 2023-Q3: Introduction of new sustainability standards and certifications affecting market players. (Further details to be added once finalized).
(Further key developments with year and month to be included in the final report)
Future Outlook for Green and Bio-Based Solvents Industry Market
The future outlook for the Green and Bio-Based Solvents market is extremely positive, with projected growth driven by a confluence of technological advancements, supportive regulatory frameworks, and growing environmental consciousness among consumers. Strategic partnerships, research and development efforts, and cost reductions will be crucial factors in realizing the full potential of this dynamic market. The market is poised for significant expansion, particularly in developing economies, presenting lucrative investment opportunities.
Green and Bio-Based Solvents Industry Segmentation
-
1. Type
-
1.1. Bio-alcohols
- 1.1.1. Bio-ethanol
- 1.1.2. Bio-methanol
- 1.1.3. Bio-propanol
- 1.1.4. Bio-butanol
-
1.2. Bio-glycols
- 1.2.1. Bio-based Propylene Glycol
- 1.2.2. Bio-based Ethylene Glycol
- 1.3. Bio-diols
- 1.4. Ethyl Lactate
- 1.5. D-limonene
- 1.6. Methyl Soyate
- 1.7. Other Types
-
1.1. Bio-alcohols
-
2. Application
- 2.1. Paints and Coatings
- 2.2. Industrial and Domestic Cleaning
- 2.3. Printing Inks
- 2.4. Adhesives and Sealants
- 2.5. Pharmaceutical
- 2.6. Cosmetics
- 2.7. Agriculture
- 2.8. Other Applications
Green and Bio-Based Solvents Industry Segmentation By Geography
-
1. Asia Pacific
- 1.1. China
- 1.2. India
- 1.3. Japan
- 1.4. South Korea
- 1.5. Rest of Asia Pacific
-
2. North America
- 2.1. United States
- 2.2. Canada
- 2.3. Mexico
-
3. Europe
- 3.1. Germany
- 3.2. United Kingdom
- 3.3. Italy
- 3.4. France
- 3.5. Rest of Europe
-
4. South America
- 4.1. Brazil
- 4.2. Argentina
- 4.3. Rest of South America
-
5. Middle East and Africa
- 5.1. Saudi Arabia
- 5.2. South Africa
- 5.3. Rest of Middle East and Africa
Green and Bio-Based Solvents Industry REPORT HIGHLIGHTS
| Aspects | Details |
|---|---|
| Study Period | 2019-2033 |
| Base Year | 2024 |
| Estimated Year | 2025 |
| Forecast Period | 2025-2033 |
| Historical Period | 2019-2024 |
| Growth Rate | CAGR of > 7.00% from 2019-2033 |
| Segmentation |
|
Table of Contents
- 1. Introduction
- 1.1. Research Scope
- 1.2. Market Segmentation
- 1.3. Research Methodology
- 1.4. Definitions and Assumptions
- 2. Executive Summary
- 2.1. Introduction
- 3. Market Dynamics
- 3.1. Introduction
- 3.2. Market Drivers
- 3.2.1. ; Stringent Regulation on VOC Emissions and Other Hazardous Air Pollutants; Increasing Market Penetration of Bio-based and Green Solvents in Asia-Pacific
- 3.3. Market Restrains
- 3.3.1. ; Cost and Availability of New Technologies; High Production Cost and Uncertainty Regarding Feedstock Supplies
- 3.4. Market Trends
- 3.4.1. Paints and Coatings Segment to Dominate the Market
- 4. Market Factor Analysis
- 4.1. Porters Five Forces
- 4.2. Supply/Value Chain
- 4.3. PESTEL analysis
- 4.4. Market Entropy
- 4.5. Patent/Trademark Analysis
- 5. Global Green and Bio-Based Solvents Industry Analysis, Insights and Forecast, 2019-2031
- 5.1. Market Analysis, Insights and Forecast - by Type
- 5.1.1. Bio-alcohols
- 5.1.1.1. Bio-ethanol
- 5.1.1.2. Bio-methanol
- 5.1.1.3. Bio-propanol
- 5.1.1.4. Bio-butanol
- 5.1.2. Bio-glycols
- 5.1.2.1. Bio-based Propylene Glycol
- 5.1.2.2. Bio-based Ethylene Glycol
- 5.1.3. Bio-diols
- 5.1.4. Ethyl Lactate
- 5.1.5. D-limonene
- 5.1.6. Methyl Soyate
- 5.1.7. Other Types
- 5.1.1. Bio-alcohols
- 5.2. Market Analysis, Insights and Forecast - by Application
- 5.2.1. Paints and Coatings
- 5.2.2. Industrial and Domestic Cleaning
- 5.2.3. Printing Inks
- 5.2.4. Adhesives and Sealants
- 5.2.5. Pharmaceutical
- 5.2.6. Cosmetics
- 5.2.7. Agriculture
- 5.2.8. Other Applications
- 5.3. Market Analysis, Insights and Forecast - by Region
- 5.3.1. Asia Pacific
- 5.3.2. North America
- 5.3.3. Europe
- 5.3.4. South America
- 5.3.5. Middle East and Africa
- 5.1. Market Analysis, Insights and Forecast - by Type
- 6. Asia Pacific Green and Bio-Based Solvents Industry Analysis, Insights and Forecast, 2019-2031
- 6.1. Market Analysis, Insights and Forecast - by Type
- 6.1.1. Bio-alcohols
- 6.1.1.1. Bio-ethanol
- 6.1.1.2. Bio-methanol
- 6.1.1.3. Bio-propanol
- 6.1.1.4. Bio-butanol
- 6.1.2. Bio-glycols
- 6.1.2.1. Bio-based Propylene Glycol
- 6.1.2.2. Bio-based Ethylene Glycol
- 6.1.3. Bio-diols
- 6.1.4. Ethyl Lactate
- 6.1.5. D-limonene
- 6.1.6. Methyl Soyate
- 6.1.7. Other Types
- 6.1.1. Bio-alcohols
- 6.2. Market Analysis, Insights and Forecast - by Application
- 6.2.1. Paints and Coatings
- 6.2.2. Industrial and Domestic Cleaning
- 6.2.3. Printing Inks
- 6.2.4. Adhesives and Sealants
- 6.2.5. Pharmaceutical
- 6.2.6. Cosmetics
- 6.2.7. Agriculture
- 6.2.8. Other Applications
- 6.1. Market Analysis, Insights and Forecast - by Type
- 7. North America Green and Bio-Based Solvents Industry Analysis, Insights and Forecast, 2019-2031
- 7.1. Market Analysis, Insights and Forecast - by Type
- 7.1.1. Bio-alcohols
- 7.1.1.1. Bio-ethanol
- 7.1.1.2. Bio-methanol
- 7.1.1.3. Bio-propanol
- 7.1.1.4. Bio-butanol
- 7.1.2. Bio-glycols
- 7.1.2.1. Bio-based Propylene Glycol
- 7.1.2.2. Bio-based Ethylene Glycol
- 7.1.3. Bio-diols
- 7.1.4. Ethyl Lactate
- 7.1.5. D-limonene
- 7.1.6. Methyl Soyate
- 7.1.7. Other Types
- 7.1.1. Bio-alcohols
- 7.2. Market Analysis, Insights and Forecast - by Application
- 7.2.1. Paints and Coatings
- 7.2.2. Industrial and Domestic Cleaning
- 7.2.3. Printing Inks
- 7.2.4. Adhesives and Sealants
- 7.2.5. Pharmaceutical
- 7.2.6. Cosmetics
- 7.2.7. Agriculture
- 7.2.8. Other Applications
- 7.1. Market Analysis, Insights and Forecast - by Type
- 8. Europe Green and Bio-Based Solvents Industry Analysis, Insights and Forecast, 2019-2031
- 8.1. Market Analysis, Insights and Forecast - by Type
- 8.1.1. Bio-alcohols
- 8.1.1.1. Bio-ethanol
- 8.1.1.2. Bio-methanol
- 8.1.1.3. Bio-propanol
- 8.1.1.4. Bio-butanol
- 8.1.2. Bio-glycols
- 8.1.2.1. Bio-based Propylene Glycol
- 8.1.2.2. Bio-based Ethylene Glycol
- 8.1.3. Bio-diols
- 8.1.4. Ethyl Lactate
- 8.1.5. D-limonene
- 8.1.6. Methyl Soyate
- 8.1.7. Other Types
- 8.1.1. Bio-alcohols
- 8.2. Market Analysis, Insights and Forecast - by Application
- 8.2.1. Paints and Coatings
- 8.2.2. Industrial and Domestic Cleaning
- 8.2.3. Printing Inks
- 8.2.4. Adhesives and Sealants
- 8.2.5. Pharmaceutical
- 8.2.6. Cosmetics
- 8.2.7. Agriculture
- 8.2.8. Other Applications
- 8.1. Market Analysis, Insights and Forecast - by Type
- 9. South America Green and Bio-Based Solvents Industry Analysis, Insights and Forecast, 2019-2031
- 9.1. Market Analysis, Insights and Forecast - by Type
- 9.1.1. Bio-alcohols
- 9.1.1.1. Bio-ethanol
- 9.1.1.2. Bio-methanol
- 9.1.1.3. Bio-propanol
- 9.1.1.4. Bio-butanol
- 9.1.2. Bio-glycols
- 9.1.2.1. Bio-based Propylene Glycol
- 9.1.2.2. Bio-based Ethylene Glycol
- 9.1.3. Bio-diols
- 9.1.4. Ethyl Lactate
- 9.1.5. D-limonene
- 9.1.6. Methyl Soyate
- 9.1.7. Other Types
- 9.1.1. Bio-alcohols
- 9.2. Market Analysis, Insights and Forecast - by Application
- 9.2.1. Paints and Coatings
- 9.2.2. Industrial and Domestic Cleaning
- 9.2.3. Printing Inks
- 9.2.4. Adhesives and Sealants
- 9.2.5. Pharmaceutical
- 9.2.6. Cosmetics
- 9.2.7. Agriculture
- 9.2.8. Other Applications
- 9.1. Market Analysis, Insights and Forecast - by Type
- 10. Middle East and Africa Green and Bio-Based Solvents Industry Analysis, Insights and Forecast, 2019-2031
- 10.1. Market Analysis, Insights and Forecast - by Type
- 10.1.1. Bio-alcohols
- 10.1.1.1. Bio-ethanol
- 10.1.1.2. Bio-methanol
- 10.1.1.3. Bio-propanol
- 10.1.1.4. Bio-butanol
- 10.1.2. Bio-glycols
- 10.1.2.1. Bio-based Propylene Glycol
- 10.1.2.2. Bio-based Ethylene Glycol
- 10.1.3. Bio-diols
- 10.1.4. Ethyl Lactate
- 10.1.5. D-limonene
- 10.1.6. Methyl Soyate
- 10.1.7. Other Types
- 10.1.1. Bio-alcohols
- 10.2. Market Analysis, Insights and Forecast - by Application
- 10.2.1. Paints and Coatings
- 10.2.2. Industrial and Domestic Cleaning
- 10.2.3. Printing Inks
- 10.2.4. Adhesives and Sealants
- 10.2.5. Pharmaceutical
- 10.2.6. Cosmetics
- 10.2.7. Agriculture
- 10.2.8. Other Applications
- 10.1. Market Analysis, Insights and Forecast - by Type
- 11. North America Green and Bio-Based Solvents Industry Analysis, Insights and Forecast, 2019-2031
- 11.1. Market Analysis, Insights and Forecast - By Country/Sub-region
- 11.1.1 United States
- 11.1.2 Canada
- 11.1.3 Mexico
- 12. Europe Green and Bio-Based Solvents Industry Analysis, Insights and Forecast, 2019-2031
- 12.1. Market Analysis, Insights and Forecast - By Country/Sub-region
- 12.1.1 Germany
- 12.1.2 France
- 12.1.3 Italy
- 12.1.4 United Kingdom
- 12.1.5 Netherlands
- 12.1.6 Rest of Europe
- 13. Asia Pacific Green and Bio-Based Solvents Industry Analysis, Insights and Forecast, 2019-2031
- 13.1. Market Analysis, Insights and Forecast - By Country/Sub-region
- 13.1.1 China
- 13.1.2 Japan
- 13.1.3 India
- 13.1.4 South Korea
- 13.1.5 Taiwan
- 13.1.6 Australia
- 13.1.7 Rest of Asia-Pacific
- 14. South America Green and Bio-Based Solvents Industry Analysis, Insights and Forecast, 2019-2031
- 14.1. Market Analysis, Insights and Forecast - By Country/Sub-region
- 14.1.1 Brazil
- 14.1.2 Argentina
- 14.1.3 Rest of South America
- 15. MEA Green and Bio-Based Solvents Industry Analysis, Insights and Forecast, 2019-2031
- 15.1. Market Analysis, Insights and Forecast - By Country/Sub-region
- 15.1.1 Middle East
- 15.1.2 Africa
- 16. Competitive Analysis
- 16.1. Global Market Share Analysis 2024
- 16.2. Company Profiles
- 16.2.1 Elevance Renewable Sciences Inc
- 16.2.1.1. Overview
- 16.2.1.2. Products
- 16.2.1.3. SWOT Analysis
- 16.2.1.4. Recent Developments
- 16.2.1.5. Financials (Based on Availability)
- 16.2.2 Cargill Incorporated
- 16.2.2.1. Overview
- 16.2.2.2. Products
- 16.2.2.3. SWOT Analysis
- 16.2.2.4. Recent Developments
- 16.2.2.5. Financials (Based on Availability)
- 16.2.3 Cremer Oleo GmbH & Co Kg
- 16.2.3.1. Overview
- 16.2.3.2. Products
- 16.2.3.3. SWOT Analysis
- 16.2.3.4. Recent Developments
- 16.2.3.5. Financials (Based on Availability)
- 16.2.4 Gemtek Products
- 16.2.4.1. Overview
- 16.2.4.2. Products
- 16.2.4.3. SWOT Analysis
- 16.2.4.4. Recent Developments
- 16.2.4.5. Financials (Based on Availability)
- 16.2.5 Florachem Corporation
- 16.2.5.1. Overview
- 16.2.5.2. Products
- 16.2.5.3. SWOT Analysis
- 16.2.5.4. Recent Developments
- 16.2.5.5. Financials (Based on Availability)
- 16.2.6 Archer Daniels Midland Company (ADM)
- 16.2.6.1. Overview
- 16.2.6.2. Products
- 16.2.6.3. SWOT Analysis
- 16.2.6.4. Recent Developments
- 16.2.6.5. Financials (Based on Availability)
- 16.2.7 BioAmber Inc
- 16.2.7.1. Overview
- 16.2.7.2. Products
- 16.2.7.3. SWOT Analysis
- 16.2.7.4. Recent Developments
- 16.2.7.5. Financials (Based on Availability)
- 16.2.8 Bio Brands LLC
- 16.2.8.1. Overview
- 16.2.8.2. Products
- 16.2.8.3. SWOT Analysis
- 16.2.8.4. Recent Developments
- 16.2.8.5. Financials (Based on Availability)
- 16.2.9 Vertec BioSolvents
- 16.2.9.1. Overview
- 16.2.9.2. Products
- 16.2.9.3. SWOT Analysis
- 16.2.9.4. Recent Developments
- 16.2.9.5. Financials (Based on Availability)
- 16.2.10 Dow
- 16.2.10.1. Overview
- 16.2.10.2. Products
- 16.2.10.3. SWOT Analysis
- 16.2.10.4. Recent Developments
- 16.2.10.5. Financials (Based on Availability)
- 16.2.11 Galactic
- 16.2.11.1. Overview
- 16.2.11.2. Products
- 16.2.11.3. SWOT Analysis
- 16.2.11.4. Recent Developments
- 16.2.11.5. Financials (Based on Availability)
- 16.2.12 Florida Chemical Company
- 16.2.12.1. Overview
- 16.2.12.2. Products
- 16.2.12.3. SWOT Analysis
- 16.2.12.4. Recent Developments
- 16.2.12.5. Financials (Based on Availability)
- 16.2.13 Corbion NV
- 16.2.13.1. Overview
- 16.2.13.2. Products
- 16.2.13.3. SWOT Analysis
- 16.2.13.4. Recent Developments
- 16.2.13.5. Financials (Based on Availability)
- 16.2.14 LyondellBasell Industries Holdings BV
- 16.2.14.1. Overview
- 16.2.14.2. Products
- 16.2.14.3. SWOT Analysis
- 16.2.14.4. Recent Developments
- 16.2.14.5. Financials (Based on Availability)
- 16.2.15 Gevo
- 16.2.15.1. Overview
- 16.2.15.2. Products
- 16.2.15.3. SWOT Analysis
- 16.2.15.4. Recent Developments
- 16.2.15.5. Financials (Based on Availability)
- 16.2.1 Elevance Renewable Sciences Inc
List of Figures
- Figure 1: Global Green and Bio-Based Solvents Industry Revenue Breakdown (Million, %) by Region 2024 & 2032
- Figure 2: Global Green and Bio-Based Solvents Industry Volume Breakdown (K Tons, %) by Region 2024 & 2032
- Figure 3: North America Green and Bio-Based Solvents Industry Revenue (Million), by Country 2024 & 2032
- Figure 4: North America Green and Bio-Based Solvents Industry Volume (K Tons), by Country 2024 & 2032
- Figure 5: North America Green and Bio-Based Solvents Industry Revenue Share (%), by Country 2024 & 2032
- Figure 6: North America Green and Bio-Based Solvents Industry Volume Share (%), by Country 2024 & 2032
- Figure 7: Europe Green and Bio-Based Solvents Industry Revenue (Million), by Country 2024 & 2032
- Figure 8: Europe Green and Bio-Based Solvents Industry Volume (K Tons), by Country 2024 & 2032
- Figure 9: Europe Green and Bio-Based Solvents Industry Revenue Share (%), by Country 2024 & 2032
- Figure 10: Europe Green and Bio-Based Solvents Industry Volume Share (%), by Country 2024 & 2032
- Figure 11: Asia Pacific Green and Bio-Based Solvents Industry Revenue (Million), by Country 2024 & 2032
- Figure 12: Asia Pacific Green and Bio-Based Solvents Industry Volume (K Tons), by Country 2024 & 2032
- Figure 13: Asia Pacific Green and Bio-Based Solvents Industry Revenue Share (%), by Country 2024 & 2032
- Figure 14: Asia Pacific Green and Bio-Based Solvents Industry Volume Share (%), by Country 2024 & 2032
- Figure 15: South America Green and Bio-Based Solvents Industry Revenue (Million), by Country 2024 & 2032
- Figure 16: South America Green and Bio-Based Solvents Industry Volume (K Tons), by Country 2024 & 2032
- Figure 17: South America Green and Bio-Based Solvents Industry Revenue Share (%), by Country 2024 & 2032
- Figure 18: South America Green and Bio-Based Solvents Industry Volume Share (%), by Country 2024 & 2032
- Figure 19: MEA Green and Bio-Based Solvents Industry Revenue (Million), by Country 2024 & 2032
- Figure 20: MEA Green and Bio-Based Solvents Industry Volume (K Tons), by Country 2024 & 2032
- Figure 21: MEA Green and Bio-Based Solvents Industry Revenue Share (%), by Country 2024 & 2032
- Figure 22: MEA Green and Bio-Based Solvents Industry Volume Share (%), by Country 2024 & 2032
- Figure 23: Asia Pacific Green and Bio-Based Solvents Industry Revenue (Million), by Type 2024 & 2032
- Figure 24: Asia Pacific Green and Bio-Based Solvents Industry Volume (K Tons), by Type 2024 & 2032
- Figure 25: Asia Pacific Green and Bio-Based Solvents Industry Revenue Share (%), by Type 2024 & 2032
- Figure 26: Asia Pacific Green and Bio-Based Solvents Industry Volume Share (%), by Type 2024 & 2032
- Figure 27: Asia Pacific Green and Bio-Based Solvents Industry Revenue (Million), by Application 2024 & 2032
- Figure 28: Asia Pacific Green and Bio-Based Solvents Industry Volume (K Tons), by Application 2024 & 2032
- Figure 29: Asia Pacific Green and Bio-Based Solvents Industry Revenue Share (%), by Application 2024 & 2032
- Figure 30: Asia Pacific Green and Bio-Based Solvents Industry Volume Share (%), by Application 2024 & 2032
- Figure 31: Asia Pacific Green and Bio-Based Solvents Industry Revenue (Million), by Country 2024 & 2032
- Figure 32: Asia Pacific Green and Bio-Based Solvents Industry Volume (K Tons), by Country 2024 & 2032
- Figure 33: Asia Pacific Green and Bio-Based Solvents Industry Revenue Share (%), by Country 2024 & 2032
- Figure 34: Asia Pacific Green and Bio-Based Solvents Industry Volume Share (%), by Country 2024 & 2032
- Figure 35: North America Green and Bio-Based Solvents Industry Revenue (Million), by Type 2024 & 2032
- Figure 36: North America Green and Bio-Based Solvents Industry Volume (K Tons), by Type 2024 & 2032
- Figure 37: North America Green and Bio-Based Solvents Industry Revenue Share (%), by Type 2024 & 2032
- Figure 38: North America Green and Bio-Based Solvents Industry Volume Share (%), by Type 2024 & 2032
- Figure 39: North America Green and Bio-Based Solvents Industry Revenue (Million), by Application 2024 & 2032
- Figure 40: North America Green and Bio-Based Solvents Industry Volume (K Tons), by Application 2024 & 2032
- Figure 41: North America Green and Bio-Based Solvents Industry Revenue Share (%), by Application 2024 & 2032
- Figure 42: North America Green and Bio-Based Solvents Industry Volume Share (%), by Application 2024 & 2032
- Figure 43: North America Green and Bio-Based Solvents Industry Revenue (Million), by Country 2024 & 2032
- Figure 44: North America Green and Bio-Based Solvents Industry Volume (K Tons), by Country 2024 & 2032
- Figure 45: North America Green and Bio-Based Solvents Industry Revenue Share (%), by Country 2024 & 2032
- Figure 46: North America Green and Bio-Based Solvents Industry Volume Share (%), by Country 2024 & 2032
- Figure 47: Europe Green and Bio-Based Solvents Industry Revenue (Million), by Type 2024 & 2032
- Figure 48: Europe Green and Bio-Based Solvents Industry Volume (K Tons), by Type 2024 & 2032
- Figure 49: Europe Green and Bio-Based Solvents Industry Revenue Share (%), by Type 2024 & 2032
- Figure 50: Europe Green and Bio-Based Solvents Industry Volume Share (%), by Type 2024 & 2032
- Figure 51: Europe Green and Bio-Based Solvents Industry Revenue (Million), by Application 2024 & 2032
- Figure 52: Europe Green and Bio-Based Solvents Industry Volume (K Tons), by Application 2024 & 2032
- Figure 53: Europe Green and Bio-Based Solvents Industry Revenue Share (%), by Application 2024 & 2032
- Figure 54: Europe Green and Bio-Based Solvents Industry Volume Share (%), by Application 2024 & 2032
- Figure 55: Europe Green and Bio-Based Solvents Industry Revenue (Million), by Country 2024 & 2032
- Figure 56: Europe Green and Bio-Based Solvents Industry Volume (K Tons), by Country 2024 & 2032
- Figure 57: Europe Green and Bio-Based Solvents Industry Revenue Share (%), by Country 2024 & 2032
- Figure 58: Europe Green and Bio-Based Solvents Industry Volume Share (%), by Country 2024 & 2032
- Figure 59: South America Green and Bio-Based Solvents Industry Revenue (Million), by Type 2024 & 2032
- Figure 60: South America Green and Bio-Based Solvents Industry Volume (K Tons), by Type 2024 & 2032
- Figure 61: South America Green and Bio-Based Solvents Industry Revenue Share (%), by Type 2024 & 2032
- Figure 62: South America Green and Bio-Based Solvents Industry Volume Share (%), by Type 2024 & 2032
- Figure 63: South America Green and Bio-Based Solvents Industry Revenue (Million), by Application 2024 & 2032
- Figure 64: South America Green and Bio-Based Solvents Industry Volume (K Tons), by Application 2024 & 2032
- Figure 65: South America Green and Bio-Based Solvents Industry Revenue Share (%), by Application 2024 & 2032
- Figure 66: South America Green and Bio-Based Solvents Industry Volume Share (%), by Application 2024 & 2032
- Figure 67: South America Green and Bio-Based Solvents Industry Revenue (Million), by Country 2024 & 2032
- Figure 68: South America Green and Bio-Based Solvents Industry Volume (K Tons), by Country 2024 & 2032
- Figure 69: South America Green and Bio-Based Solvents Industry Revenue Share (%), by Country 2024 & 2032
- Figure 70: South America Green and Bio-Based Solvents Industry Volume Share (%), by Country 2024 & 2032
- Figure 71: Middle East and Africa Green and Bio-Based Solvents Industry Revenue (Million), by Type 2024 & 2032
- Figure 72: Middle East and Africa Green and Bio-Based Solvents Industry Volume (K Tons), by Type 2024 & 2032
- Figure 73: Middle East and Africa Green and Bio-Based Solvents Industry Revenue Share (%), by Type 2024 & 2032
- Figure 74: Middle East and Africa Green and Bio-Based Solvents Industry Volume Share (%), by Type 2024 & 2032
- Figure 75: Middle East and Africa Green and Bio-Based Solvents Industry Revenue (Million), by Application 2024 & 2032
- Figure 76: Middle East and Africa Green and Bio-Based Solvents Industry Volume (K Tons), by Application 2024 & 2032
- Figure 77: Middle East and Africa Green and Bio-Based Solvents Industry Revenue Share (%), by Application 2024 & 2032
- Figure 78: Middle East and Africa Green and Bio-Based Solvents Industry Volume Share (%), by Application 2024 & 2032
- Figure 79: Middle East and Africa Green and Bio-Based Solvents Industry Revenue (Million), by Country 2024 & 2032
- Figure 80: Middle East and Africa Green and Bio-Based Solvents Industry Volume (K Tons), by Country 2024 & 2032
- Figure 81: Middle East and Africa Green and Bio-Based Solvents Industry Revenue Share (%), by Country 2024 & 2032
- Figure 82: Middle East and Africa Green and Bio-Based Solvents Industry Volume Share (%), by Country 2024 & 2032
List of Tables
- Table 1: Global Green and Bio-Based Solvents Industry Revenue Million Forecast, by Region 2019 & 2032
- Table 2: Global Green and Bio-Based Solvents Industry Volume K Tons Forecast, by Region 2019 & 2032
- Table 3: Global Green and Bio-Based Solvents Industry Revenue Million Forecast, by Type 2019 & 2032
- Table 4: Global Green and Bio-Based Solvents Industry Volume K Tons Forecast, by Type 2019 & 2032
- Table 5: Global Green and Bio-Based Solvents Industry Revenue Million Forecast, by Application 2019 & 2032
- Table 6: Global Green and Bio-Based Solvents Industry Volume K Tons Forecast, by Application 2019 & 2032
- Table 7: Global Green and Bio-Based Solvents Industry Revenue Million Forecast, by Region 2019 & 2032
- Table 8: Global Green and Bio-Based Solvents Industry Volume K Tons Forecast, by Region 2019 & 2032
- Table 9: Global Green and Bio-Based Solvents Industry Revenue Million Forecast, by Country 2019 & 2032
- Table 10: Global Green and Bio-Based Solvents Industry Volume K Tons Forecast, by Country 2019 & 2032
- Table 11: United States Green and Bio-Based Solvents Industry Revenue (Million) Forecast, by Application 2019 & 2032
- Table 12: United States Green and Bio-Based Solvents Industry Volume (K Tons) Forecast, by Application 2019 & 2032
- Table 13: Canada Green and Bio-Based Solvents Industry Revenue (Million) Forecast, by Application 2019 & 2032
- Table 14: Canada Green and Bio-Based Solvents Industry Volume (K Tons) Forecast, by Application 2019 & 2032
- Table 15: Mexico Green and Bio-Based Solvents Industry Revenue (Million) Forecast, by Application 2019 & 2032
- Table 16: Mexico Green and Bio-Based Solvents Industry Volume (K Tons) Forecast, by Application 2019 & 2032
- Table 17: Global Green and Bio-Based Solvents Industry Revenue Million Forecast, by Country 2019 & 2032
- Table 18: Global Green and Bio-Based Solvents Industry Volume K Tons Forecast, by Country 2019 & 2032
- Table 19: Germany Green and Bio-Based Solvents Industry Revenue (Million) Forecast, by Application 2019 & 2032
- Table 20: Germany Green and Bio-Based Solvents Industry Volume (K Tons) Forecast, by Application 2019 & 2032
- Table 21: France Green and Bio-Based Solvents Industry Revenue (Million) Forecast, by Application 2019 & 2032
- Table 22: France Green and Bio-Based Solvents Industry Volume (K Tons) Forecast, by Application 2019 & 2032
- Table 23: Italy Green and Bio-Based Solvents Industry Revenue (Million) Forecast, by Application 2019 & 2032
- Table 24: Italy Green and Bio-Based Solvents Industry Volume (K Tons) Forecast, by Application 2019 & 2032
- Table 25: United Kingdom Green and Bio-Based Solvents Industry Revenue (Million) Forecast, by Application 2019 & 2032
- Table 26: United Kingdom Green and Bio-Based Solvents Industry Volume (K Tons) Forecast, by Application 2019 & 2032
- Table 27: Netherlands Green and Bio-Based Solvents Industry Revenue (Million) Forecast, by Application 2019 & 2032
- Table 28: Netherlands Green and Bio-Based Solvents Industry Volume (K Tons) Forecast, by Application 2019 & 2032
- Table 29: Rest of Europe Green and Bio-Based Solvents Industry Revenue (Million) Forecast, by Application 2019 & 2032
- Table 30: Rest of Europe Green and Bio-Based Solvents Industry Volume (K Tons) Forecast, by Application 2019 & 2032
- Table 31: Global Green and Bio-Based Solvents Industry Revenue Million Forecast, by Country 2019 & 2032
- Table 32: Global Green and Bio-Based Solvents Industry Volume K Tons Forecast, by Country 2019 & 2032
- Table 33: China Green and Bio-Based Solvents Industry Revenue (Million) Forecast, by Application 2019 & 2032
- Table 34: China Green and Bio-Based Solvents Industry Volume (K Tons) Forecast, by Application 2019 & 2032
- Table 35: Japan Green and Bio-Based Solvents Industry Revenue (Million) Forecast, by Application 2019 & 2032
- Table 36: Japan Green and Bio-Based Solvents Industry Volume (K Tons) Forecast, by Application 2019 & 2032
- Table 37: India Green and Bio-Based Solvents Industry Revenue (Million) Forecast, by Application 2019 & 2032
- Table 38: India Green and Bio-Based Solvents Industry Volume (K Tons) Forecast, by Application 2019 & 2032
- Table 39: South Korea Green and Bio-Based Solvents Industry Revenue (Million) Forecast, by Application 2019 & 2032
- Table 40: South Korea Green and Bio-Based Solvents Industry Volume (K Tons) Forecast, by Application 2019 & 2032
- Table 41: Taiwan Green and Bio-Based Solvents Industry Revenue (Million) Forecast, by Application 2019 & 2032
- Table 42: Taiwan Green and Bio-Based Solvents Industry Volume (K Tons) Forecast, by Application 2019 & 2032
- Table 43: Australia Green and Bio-Based Solvents Industry Revenue (Million) Forecast, by Application 2019 & 2032
- Table 44: Australia Green and Bio-Based Solvents Industry Volume (K Tons) Forecast, by Application 2019 & 2032
- Table 45: Rest of Asia-Pacific Green and Bio-Based Solvents Industry Revenue (Million) Forecast, by Application 2019 & 2032
- Table 46: Rest of Asia-Pacific Green and Bio-Based Solvents Industry Volume (K Tons) Forecast, by Application 2019 & 2032
- Table 47: Global Green and Bio-Based Solvents Industry Revenue Million Forecast, by Country 2019 & 2032
- Table 48: Global Green and Bio-Based Solvents Industry Volume K Tons Forecast, by Country 2019 & 2032
- Table 49: Brazil Green and Bio-Based Solvents Industry Revenue (Million) Forecast, by Application 2019 & 2032
- Table 50: Brazil Green and Bio-Based Solvents Industry Volume (K Tons) Forecast, by Application 2019 & 2032
- Table 51: Argentina Green and Bio-Based Solvents Industry Revenue (Million) Forecast, by Application 2019 & 2032
- Table 52: Argentina Green and Bio-Based Solvents Industry Volume (K Tons) Forecast, by Application 2019 & 2032
- Table 53: Rest of South America Green and Bio-Based Solvents Industry Revenue (Million) Forecast, by Application 2019 & 2032
- Table 54: Rest of South America Green and Bio-Based Solvents Industry Volume (K Tons) Forecast, by Application 2019 & 2032
- Table 55: Global Green and Bio-Based Solvents Industry Revenue Million Forecast, by Country 2019 & 2032
- Table 56: Global Green and Bio-Based Solvents Industry Volume K Tons Forecast, by Country 2019 & 2032
- Table 57: Middle East Green and Bio-Based Solvents Industry Revenue (Million) Forecast, by Application 2019 & 2032
- Table 58: Middle East Green and Bio-Based Solvents Industry Volume (K Tons) Forecast, by Application 2019 & 2032
- Table 59: Africa Green and Bio-Based Solvents Industry Revenue (Million) Forecast, by Application 2019 & 2032
- Table 60: Africa Green and Bio-Based Solvents Industry Volume (K Tons) Forecast, by Application 2019 & 2032
- Table 61: Global Green and Bio-Based Solvents Industry Revenue Million Forecast, by Type 2019 & 2032
- Table 62: Global Green and Bio-Based Solvents Industry Volume K Tons Forecast, by Type 2019 & 2032
- Table 63: Global Green and Bio-Based Solvents Industry Revenue Million Forecast, by Application 2019 & 2032
- Table 64: Global Green and Bio-Based Solvents Industry Volume K Tons Forecast, by Application 2019 & 2032
- Table 65: Global Green and Bio-Based Solvents Industry Revenue Million Forecast, by Country 2019 & 2032
- Table 66: Global Green and Bio-Based Solvents Industry Volume K Tons Forecast, by Country 2019 & 2032
- Table 67: China Green and Bio-Based Solvents Industry Revenue (Million) Forecast, by Application 2019 & 2032
- Table 68: China Green and Bio-Based Solvents Industry Volume (K Tons) Forecast, by Application 2019 & 2032
- Table 69: India Green and Bio-Based Solvents Industry Revenue (Million) Forecast, by Application 2019 & 2032
- Table 70: India Green and Bio-Based Solvents Industry Volume (K Tons) Forecast, by Application 2019 & 2032
- Table 71: Japan Green and Bio-Based Solvents Industry Revenue (Million) Forecast, by Application 2019 & 2032
- Table 72: Japan Green and Bio-Based Solvents Industry Volume (K Tons) Forecast, by Application 2019 & 2032
- Table 73: South Korea Green and Bio-Based Solvents Industry Revenue (Million) Forecast, by Application 2019 & 2032
- Table 74: South Korea Green and Bio-Based Solvents Industry Volume (K Tons) Forecast, by Application 2019 & 2032
- Table 75: Rest of Asia Pacific Green and Bio-Based Solvents Industry Revenue (Million) Forecast, by Application 2019 & 2032
- Table 76: Rest of Asia Pacific Green and Bio-Based Solvents Industry Volume (K Tons) Forecast, by Application 2019 & 2032
- Table 77: Global Green and Bio-Based Solvents Industry Revenue Million Forecast, by Type 2019 & 2032
- Table 78: Global Green and Bio-Based Solvents Industry Volume K Tons Forecast, by Type 2019 & 2032
- Table 79: Global Green and Bio-Based Solvents Industry Revenue Million Forecast, by Application 2019 & 2032
- Table 80: Global Green and Bio-Based Solvents Industry Volume K Tons Forecast, by Application 2019 & 2032
- Table 81: Global Green and Bio-Based Solvents Industry Revenue Million Forecast, by Country 2019 & 2032
- Table 82: Global Green and Bio-Based Solvents Industry Volume K Tons Forecast, by Country 2019 & 2032
- Table 83: United States Green and Bio-Based Solvents Industry Revenue (Million) Forecast, by Application 2019 & 2032
- Table 84: United States Green and Bio-Based Solvents Industry Volume (K Tons) Forecast, by Application 2019 & 2032
- Table 85: Canada Green and Bio-Based Solvents Industry Revenue (Million) Forecast, by Application 2019 & 2032
- Table 86: Canada Green and Bio-Based Solvents Industry Volume (K Tons) Forecast, by Application 2019 & 2032
- Table 87: Mexico Green and Bio-Based Solvents Industry Revenue (Million) Forecast, by Application 2019 & 2032
- Table 88: Mexico Green and Bio-Based Solvents Industry Volume (K Tons) Forecast, by Application 2019 & 2032
- Table 89: Global Green and Bio-Based Solvents Industry Revenue Million Forecast, by Type 2019 & 2032
- Table 90: Global Green and Bio-Based Solvents Industry Volume K Tons Forecast, by Type 2019 & 2032
- Table 91: Global Green and Bio-Based Solvents Industry Revenue Million Forecast, by Application 2019 & 2032
- Table 92: Global Green and Bio-Based Solvents Industry Volume K Tons Forecast, by Application 2019 & 2032
- Table 93: Global Green and Bio-Based Solvents Industry Revenue Million Forecast, by Country 2019 & 2032
- Table 94: Global Green and Bio-Based Solvents Industry Volume K Tons Forecast, by Country 2019 & 2032
- Table 95: Germany Green and Bio-Based Solvents Industry Revenue (Million) Forecast, by Application 2019 & 2032
- Table 96: Germany Green and Bio-Based Solvents Industry Volume (K Tons) Forecast, by Application 2019 & 2032
- Table 97: United Kingdom Green and Bio-Based Solvents Industry Revenue (Million) Forecast, by Application 2019 & 2032
- Table 98: United Kingdom Green and Bio-Based Solvents Industry Volume (K Tons) Forecast, by Application 2019 & 2032
- Table 99: Italy Green and Bio-Based Solvents Industry Revenue (Million) Forecast, by Application 2019 & 2032
- Table 100: Italy Green and Bio-Based Solvents Industry Volume (K Tons) Forecast, by Application 2019 & 2032
- Table 101: France Green and Bio-Based Solvents Industry Revenue (Million) Forecast, by Application 2019 & 2032
- Table 102: France Green and Bio-Based Solvents Industry Volume (K Tons) Forecast, by Application 2019 & 2032
- Table 103: Rest of Europe Green and Bio-Based Solvents Industry Revenue (Million) Forecast, by Application 2019 & 2032
- Table 104: Rest of Europe Green and Bio-Based Solvents Industry Volume (K Tons) Forecast, by Application 2019 & 2032
- Table 105: Global Green and Bio-Based Solvents Industry Revenue Million Forecast, by Type 2019 & 2032
- Table 106: Global Green and Bio-Based Solvents Industry Volume K Tons Forecast, by Type 2019 & 2032
- Table 107: Global Green and Bio-Based Solvents Industry Revenue Million Forecast, by Application 2019 & 2032
- Table 108: Global Green and Bio-Based Solvents Industry Volume K Tons Forecast, by Application 2019 & 2032
- Table 109: Global Green and Bio-Based Solvents Industry Revenue Million Forecast, by Country 2019 & 2032
- Table 110: Global Green and Bio-Based Solvents Industry Volume K Tons Forecast, by Country 2019 & 2032
- Table 111: Brazil Green and Bio-Based Solvents Industry Revenue (Million) Forecast, by Application 2019 & 2032
- Table 112: Brazil Green and Bio-Based Solvents Industry Volume (K Tons) Forecast, by Application 2019 & 2032
- Table 113: Argentina Green and Bio-Based Solvents Industry Revenue (Million) Forecast, by Application 2019 & 2032
- Table 114: Argentina Green and Bio-Based Solvents Industry Volume (K Tons) Forecast, by Application 2019 & 2032
- Table 115: Rest of South America Green and Bio-Based Solvents Industry Revenue (Million) Forecast, by Application 2019 & 2032
- Table 116: Rest of South America Green and Bio-Based Solvents Industry Volume (K Tons) Forecast, by Application 2019 & 2032
- Table 117: Global Green and Bio-Based Solvents Industry Revenue Million Forecast, by Type 2019 & 2032
- Table 118: Global Green and Bio-Based Solvents Industry Volume K Tons Forecast, by Type 2019 & 2032
- Table 119: Global Green and Bio-Based Solvents Industry Revenue Million Forecast, by Application 2019 & 2032
- Table 120: Global Green and Bio-Based Solvents Industry Volume K Tons Forecast, by Application 2019 & 2032
- Table 121: Global Green and Bio-Based Solvents Industry Revenue Million Forecast, by Country 2019 & 2032
- Table 122: Global Green and Bio-Based Solvents Industry Volume K Tons Forecast, by Country 2019 & 2032
- Table 123: Saudi Arabia Green and Bio-Based Solvents Industry Revenue (Million) Forecast, by Application 2019 & 2032
- Table 124: Saudi Arabia Green and Bio-Based Solvents Industry Volume (K Tons) Forecast, by Application 2019 & 2032
- Table 125: South Africa Green and Bio-Based Solvents Industry Revenue (Million) Forecast, by Application 2019 & 2032
- Table 126: South Africa Green and Bio-Based Solvents Industry Volume (K Tons) Forecast, by Application 2019 & 2032
- Table 127: Rest of Middle East and Africa Green and Bio-Based Solvents Industry Revenue (Million) Forecast, by Application 2019 & 2032
- Table 128: Rest of Middle East and Africa Green and Bio-Based Solvents Industry Volume (K Tons) Forecast, by Application 2019 & 2032
Frequently Asked Questions
1. What is the projected Compound Annual Growth Rate (CAGR) of the Green and Bio-Based Solvents Industry?
The projected CAGR is approximately > 7.00%.
2. Which companies are prominent players in the Green and Bio-Based Solvents Industry?
Key companies in the market include Elevance Renewable Sciences Inc, Cargill Incorporated, Cremer Oleo GmbH & Co Kg, Gemtek Products, Florachem Corporation, Archer Daniels Midland Company (ADM), BioAmber Inc, Bio Brands LLC, Vertec BioSolvents, Dow, Galactic, Florida Chemical Company, Corbion NV, LyondellBasell Industries Holdings BV, Gevo.
3. What are the main segments of the Green and Bio-Based Solvents Industry?
The market segments include Type, Application.
4. Can you provide details about the market size?
The market size is estimated to be USD XX Million as of 2022.
5. What are some drivers contributing to market growth?
; Stringent Regulation on VOC Emissions and Other Hazardous Air Pollutants; Increasing Market Penetration of Bio-based and Green Solvents in Asia-Pacific.
6. What are the notable trends driving market growth?
Paints and Coatings Segment to Dominate the Market.
7. Are there any restraints impacting market growth?
; Cost and Availability of New Technologies; High Production Cost and Uncertainty Regarding Feedstock Supplies.
8. Can you provide examples of recent developments in the market?
N/A
9. What pricing options are available for accessing the report?
Pricing options include single-user, multi-user, and enterprise licenses priced at USD 4750, USD 5250, and USD 8750 respectively.
10. Is the market size provided in terms of value or volume?
The market size is provided in terms of value, measured in Million and volume, measured in K Tons.
11. Are there any specific market keywords associated with the report?
Yes, the market keyword associated with the report is "Green and Bio-Based Solvents Industry," which aids in identifying and referencing the specific market segment covered.
12. How do I determine which pricing option suits my needs best?
The pricing options vary based on user requirements and access needs. Individual users may opt for single-user licenses, while businesses requiring broader access may choose multi-user or enterprise licenses for cost-effective access to the report.
13. Are there any additional resources or data provided in the Green and Bio-Based Solvents Industry report?
While the report offers comprehensive insights, it's advisable to review the specific contents or supplementary materials provided to ascertain if additional resources or data are available.
14. How can I stay updated on further developments or reports in the Green and Bio-Based Solvents Industry?
To stay informed about further developments, trends, and reports in the Green and Bio-Based Solvents Industry, consider subscribing to industry newsletters, following relevant companies and organizations, or regularly checking reputable industry news sources and publications.
Methodology
Step 1 - Identification of Relevant Samples Size from Population Database


Step 2 - Approaches for Defining Global Market Size (Value, Volume* & Price*)

Note*: In applicable scenarios
Step 3 - Data Sources
Primary Research
- Web Analytics
- Survey Reports
- Research Institute
- Latest Research Reports
- Opinion Leaders
Secondary Research
- Annual Reports
- White Paper
- Latest Press Release
- Industry Association
- Paid Database
- Investor Presentations

Step 4 - Data Triangulation
Involves using different sources of information in order to increase the validity of a study
These sources are likely to be stakeholders in a program - participants, other researchers, program staff, other community members, and so on.
Then we put all data in single framework & apply various statistical tools to find out the dynamic on the market.
During the analysis stage, feedback from the stakeholder groups would be compared to determine areas of agreement as well as areas of divergence


