

Key Insights
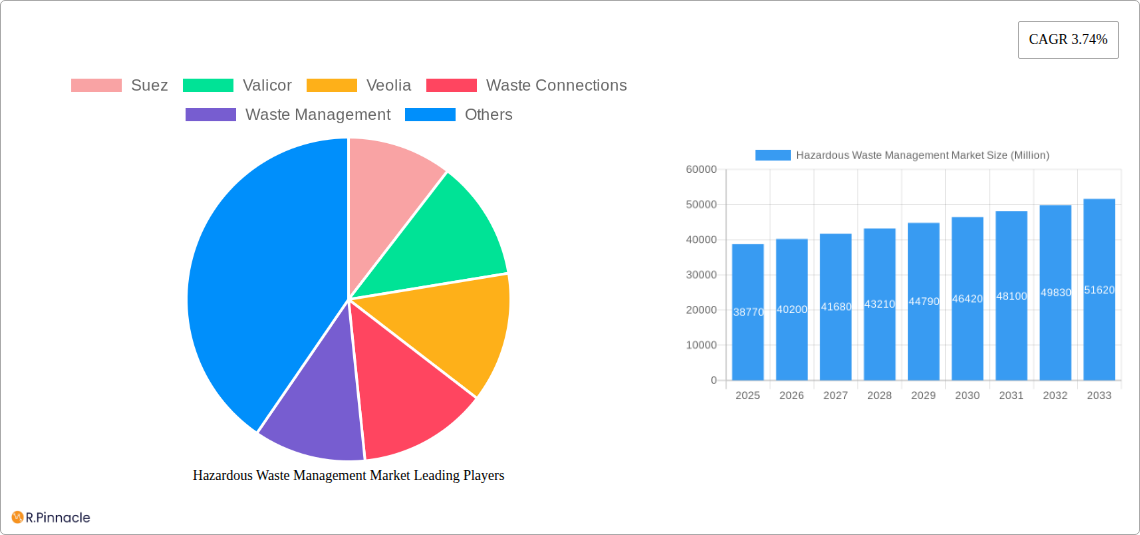
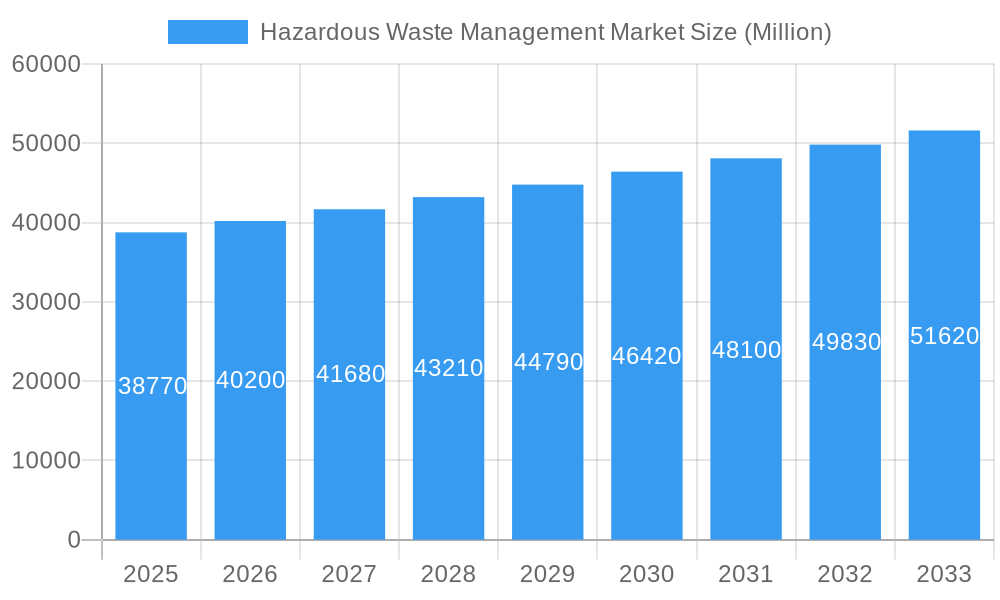
The Hazardous Waste Management Market, valued at $38.77 billion in 2025, is projected to experience steady growth, driven by increasing industrialization, stricter environmental regulations globally, and rising awareness about the detrimental effects of improper waste disposal. The Compound Annual Growth Rate (CAGR) of 3.74% from 2025 to 2033 indicates a consistent expansion, although the rate may fluctuate slightly year-over-year depending on economic conditions and technological advancements in waste treatment. Key drivers include the expanding manufacturing sector generating larger volumes of hazardous waste, governmental initiatives promoting sustainable waste management practices, and the increasing adoption of advanced technologies such as incineration, pyrolysis, and biological treatment methods. The market faces challenges including high operational costs associated with secure waste disposal and the need for continuous technological innovation to handle diverse and increasingly complex waste streams.
Hazardous Waste Management Market Market Size (In Billion)
Major players like Suez, Veolia, Waste Management, and Republic Services dominate the market, leveraging their established infrastructure and expertise in handling hazardous materials. However, the market is also witnessing the emergence of smaller, specialized companies focusing on niche waste types or innovative treatment technologies. Regional variations in regulations and economic conditions influence market growth, with developed regions like North America and Europe expected to lead in market share due to robust regulatory frameworks and higher industrial activity. The forecast period (2025-2033) will likely see a continued consolidation among market players, driven by mergers and acquisitions, as well as increasing investments in research and development to improve waste treatment efficiency and reduce environmental impact. The market's future trajectory will depend significantly on evolving environmental regulations, technological breakthroughs in waste processing, and the overall economic climate.
Hazardous Waste Management Market Company Market Share
Hazardous Waste Management Market Report: 2019-2033
This comprehensive report provides an in-depth analysis of the Hazardous Waste Management Market, offering valuable insights for industry professionals, investors, and strategic decision-makers. The study period covers 2019-2033, with 2025 as the base and estimated year. The forecast period spans 2025-2033, and the historical period encompasses 2019-2024. The report leverages extensive data analysis to project market growth, identify key trends, and highlight leading players in this crucial sector.
Hazardous Waste Management Market Structure & Innovation Trends
This section analyzes the market's competitive landscape, focusing on market concentration, innovation drivers, regulatory frameworks, and M&A activity. We examine the market share of key players, including Suez, Valicor, Veolia, Waste Connections, Waste Management, Republic Services, Biffa, Clean Harbors, Covanta Holding, Daiseki, Hitachi Zosen, Remondis SE & Co Kg, Urbaser, and Biomedical Solutions, along with 63 other companies.
- Market Concentration: The market exhibits a [Insert Market Concentration Level, e.g., moderately concentrated] structure, with the top five players holding an estimated [Insert Percentage, e.g., 45%] market share in 2025. Further analysis details the market share distribution across different segments and geographical regions.
- Innovation Drivers: Technological advancements in waste treatment, stricter environmental regulations, and increasing awareness of sustainable waste management practices are key innovation drivers. This includes the adoption of advanced technologies like AI and automation for improved efficiency and reduced environmental impact.
- Regulatory Frameworks: Government regulations pertaining to hazardous waste disposal significantly influence market dynamics. Compliance costs and stringent regulations drive innovation and consolidation within the industry.
- Product Substitutes: Limited effective substitutes currently exist for hazardous waste management services, solidifying the market's position. However, emerging technologies could present potential future substitutes.
- End-User Demographics: The key end-users include industrial sectors (manufacturing, healthcare, etc.), government agencies, and commercial establishments. The market is driven by the increasing generation of hazardous waste from these sectors.
- M&A Activities: The report analyzes recent M&A activities in the hazardous waste management sector, including deal values and their impact on market consolidation. [Insert details about M&A activity and deal values in Millions, e.g., "In 2024, the total value of M&A deals surpassed xx Million, reflecting a trend toward consolidation."].
Hazardous Waste Management Market Dynamics & Trends
This section examines the factors influencing market growth, including technological advancements, changing consumer preferences, and competitive dynamics. The report projects a CAGR of [Insert CAGR Percentage, e.g., 5.2%] for the forecast period (2025-2033). Market penetration analysis shows that [Insert percentage, e.g., 70%] of the total hazardous waste generated is currently managed by established players. Key drivers influencing this growth include increasing awareness of environmental protection, stricter regulatory compliance measures, and advancements in treatment technologies. We analyze these drivers in detail, including quantifiable data points like the number of new facilities constructed each year and the percentage increase in investment in R&D.
Dominant Regions & Segments in Hazardous Waste Management Market
This section identifies the leading regions and segments within the hazardous waste management market. [Insert Dominant Region/Country, e.g., North America] currently dominates the market, driven by stringent environmental regulations and a strong focus on sustainable waste management.
- Key Drivers in [Dominant Region/Country]:
- Stringent environmental regulations and policies
- Well-developed infrastructure for waste collection and disposal
- High level of industrial activity leading to increased waste generation
- Significant investments in advanced waste management technologies
[Continue with similar bullet points for other dominant regions/countries if applicable. Follow with paragraphs detailing dominance analysis for each region/country, providing specific data points and market share information.]
Hazardous Waste Management Market Product Innovations
Recent product innovations focus on improving efficiency and reducing environmental impact. These include advancements in incineration technologies, development of eco-friendly treatment methods, and the integration of advanced technologies like AI for improved waste sorting and processing. The market is witnessing a shift towards sustainable solutions, and companies are actively investing in research and development to offer environmentally friendly products and services.
Report Scope & Segmentation Analysis
The report segments the market based on [Insert Segmentation Criteria, e.g., waste type, treatment method, end-user industry]. Each segment's growth projections, market sizes, and competitive dynamics are analyzed in detail. [Provide a paragraph for each segment detailing market size, growth projections, and competitive analysis. Use predicted values where necessary. Example: "The industrial waste segment is projected to grow at a CAGR of xx% during the forecast period, driven by increasing industrial activity."]
Key Drivers of Hazardous Waste Management Market Growth
The growth of the hazardous waste management market is driven by several factors:
- Stringent Environmental Regulations: Governments worldwide are implementing stricter regulations to mitigate environmental pollution from hazardous waste.
- Technological Advancements: Innovative treatment technologies are improving efficiency, reducing costs, and minimizing environmental impact.
- Growing Industrialization: Increased industrial activity leads to higher hazardous waste generation, fueling market demand.
- Rising Environmental Awareness: Growing public awareness of environmental issues promotes sustainable waste management practices.
Challenges in the Hazardous Waste Management Market Sector
Several challenges hinder the growth of the hazardous waste management market:
- High Capital Investment: Establishing and operating hazardous waste management facilities requires substantial investments.
- Complex Regulatory Environment: Navigating complex and evolving regulations can be challenging.
- Fluctuating Raw Material Prices: Price volatility in raw materials used in waste treatment processes impacts operational costs.
- Public Perception and NIMBYism: Public resistance (Not In My Backyard) to the location of new facilities presents logistical hurdles.
Emerging Opportunities in Hazardous Waste Management Market
The market offers several promising opportunities:
- Technological Innovation: Emerging technologies like AI, robotics, and IoT offer significant potential for improving efficiency and reducing costs.
- Sustainable Waste Management: The demand for environmentally friendly waste management solutions is growing.
- Circular Economy Principles: Integrating waste management practices with circular economy principles offers opportunities for resource recovery and value creation.
- Expansion into Emerging Markets: Developing countries present significant growth potential due to rapid industrialization and increasing waste generation.
Leading Players in the Hazardous Waste Management Market
- Suez
- Valicor
- Veolia
- Waste Connections
- Waste Management
- Republic Services
- Biffa
- Clean Harbors
- Covanta Holding
- Daiseki
- Hitachi Zosen
- Remondis SE & Co Kg
- Urbaser
- Biomedical Solutions
- 63 Other Companies
Key Developments in Hazardous Waste Management Market Industry
- February 2024: WM announced plans to expand its footprint by establishing three new recycling facilities across North America and boost its recycling capacity by 1 Million metric tons annually by 2026 through automation enhancements at 10 existing sites.
- April 2024: China Everbright Environment Group Limited (Everbright Environment) celebrated the completion of its Hue Waste-to-Energy Project in Thua Thien Hue Province, Vietnam, attended by Vietnamese Prime Minister Pham Minh Chinh.
Future Outlook for Hazardous Waste Management Market
The hazardous waste management market is poised for significant growth, driven by increasing environmental awareness, stringent regulations, and technological advancements. The market will continue to consolidate, with larger players acquiring smaller companies to expand their market share. The focus on sustainable solutions and resource recovery will further drive innovation and investment in the sector. The adoption of circular economy principles and the emergence of new technologies present significant growth opportunities for businesses operating in this dynamic market.
Hazardous Waste Management Market Segmentation
-
1. Type
- 1.1. Solid
- 1.2. Liquid
- 1.3. Sludge
-
2. Waste
- 2.1. Chemicals
- 2.2. Biomedical
- 2.3. Radioactive
- 2.4. Other Waste (Corrosive, Flammable, etc.)
Hazardous Waste Management Market Segmentation By Geography
-
1. North America
- 1.1. United States
- 1.2. Canada
-
2. Europe
- 2.1. Germany
- 2.2. United Kingdom
- 2.3. France
- 2.4. Russia
- 2.5. Spain
- 2.6. Rest of Europe
-
3. Asia Pacific
- 3.1. India
- 3.2. China
- 3.3. Japan
- 3.4. Rest of Asia Pacific
-
4. Middle East and Africa
- 4.1. United Arab Emirates
- 4.2. Saudi Arabia
- 4.3. Rest of Middle East
-
5. South America
- 5.1. Brazil
- 5.2. Argentina
- 5.3. Rest of South America

Hazardous Waste Management Market Regional Market Share
Geographic Coverage of Hazardous Waste Management Market
Hazardous Waste Management Market REPORT HIGHLIGHTS
| Aspects | Details |
|---|---|
| Study Period | 2020-2034 |
| Base Year | 2025 |
| Estimated Year | 2026 |
| Forecast Period | 2026-2034 |
| Historical Period | 2020-2025 |
| Growth Rate | CAGR of 3.74% from 2020-2034 |
| Segmentation |
|
Table of Contents
- 1. Introduction
- 1.1. Research Scope
- 1.2. Market Segmentation
- 1.3. Research Objective
- 1.4. Definitions and Assumptions
- 2. Executive Summary
- 2.1. Market Snapshot
- 3. Market Dynamics
- 3.1. Market Drivers
- 3.2. Market Restrains
- 3.3. Market Trends
- 3.4. Market Opportunities
- 4. Market Factor Analysis
- 4.1. Porters Five Forces
- 4.1.1. Bargaining Power of Suppliers
- 4.1.2. Bargaining Power of Buyers
- 4.1.3. Threat of New Entrants
- 4.1.4. Threat of Substitutes
- 4.1.5. Competitive Rivalry
- 4.2. PESTEL analysis
- 4.3. BCG Analysis
- 4.3.1. Stars (High Growth, High Market Share)
- 4.3.2. Cash Cows (Low Growth, High Market Share)
- 4.3.3. Question Mark (High Growth, Low Market Share)
- 4.3.4. Dogs (Low Growth, Low Market Share)
- 4.4. Ansoff Matrix Analysis
- 4.5. Supply Chain Analysis
- 4.6. Regulatory Landscape
- 4.7. Current Market Potential and Opportunity Assessment (TAM–SAM–SOM Framework)
- 4.8. PRI Analyst Note
- 4.1. Porters Five Forces
- 5. Market Analysis, Insights and Forecast 2021-2033
- 5.1. Market Analysis, Insights and Forecast - by Type
- 5.1.1. Solid
- 5.1.2. Liquid
- 5.1.3. Sludge
- 5.2. Market Analysis, Insights and Forecast - by Waste
- 5.2.1. Chemicals
- 5.2.2. Biomedical
- 5.2.3. Radioactive
- 5.2.4. Other Waste (Corrosive, Flammable, etc.)
- 5.3. Market Analysis, Insights and Forecast - by Region
- 5.3.1. North America
- 5.3.2. Europe
- 5.3.3. Asia Pacific
- 5.3.4. Middle East and Africa
- 5.3.5. South America
- 5.1. Market Analysis, Insights and Forecast - by Type
- 6. Global Hazardous Waste Management Market Analysis, Insights and Forecast, 2021-2033
- 6.1. Market Analysis, Insights and Forecast - by Type
- 6.1.1. Solid
- 6.1.2. Liquid
- 6.1.3. Sludge
- 6.2. Market Analysis, Insights and Forecast - by Waste
- 6.2.1. Chemicals
- 6.2.2. Biomedical
- 6.2.3. Radioactive
- 6.2.4. Other Waste (Corrosive, Flammable, etc.)
- 6.1. Market Analysis, Insights and Forecast - by Type
- 7. North America Hazardous Waste Management Market Analysis, Insights and Forecast, 2020-2032
- 7.1. Market Analysis, Insights and Forecast - by Type
- 7.1.1. Solid
- 7.1.2. Liquid
- 7.1.3. Sludge
- 7.2. Market Analysis, Insights and Forecast - by Waste
- 7.2.1. Chemicals
- 7.2.2. Biomedical
- 7.2.3. Radioactive
- 7.2.4. Other Waste (Corrosive, Flammable, etc.)
- 7.1. Market Analysis, Insights and Forecast - by Type
- 8. Europe Hazardous Waste Management Market Analysis, Insights and Forecast, 2020-2032
- 8.1. Market Analysis, Insights and Forecast - by Type
- 8.1.1. Solid
- 8.1.2. Liquid
- 8.1.3. Sludge
- 8.2. Market Analysis, Insights and Forecast - by Waste
- 8.2.1. Chemicals
- 8.2.2. Biomedical
- 8.2.3. Radioactive
- 8.2.4. Other Waste (Corrosive, Flammable, etc.)
- 8.1. Market Analysis, Insights and Forecast - by Type
- 9. Asia Pacific Hazardous Waste Management Market Analysis, Insights and Forecast, 2020-2032
- 9.1. Market Analysis, Insights and Forecast - by Type
- 9.1.1. Solid
- 9.1.2. Liquid
- 9.1.3. Sludge
- 9.2. Market Analysis, Insights and Forecast - by Waste
- 9.2.1. Chemicals
- 9.2.2. Biomedical
- 9.2.3. Radioactive
- 9.2.4. Other Waste (Corrosive, Flammable, etc.)
- 9.1. Market Analysis, Insights and Forecast - by Type
- 10. Middle East and Africa Hazardous Waste Management Market Analysis, Insights and Forecast, 2020-2032
- 10.1. Market Analysis, Insights and Forecast - by Type
- 10.1.1. Solid
- 10.1.2. Liquid
- 10.1.3. Sludge
- 10.2. Market Analysis, Insights and Forecast - by Waste
- 10.2.1. Chemicals
- 10.2.2. Biomedical
- 10.2.3. Radioactive
- 10.2.4. Other Waste (Corrosive, Flammable, etc.)
- 10.1. Market Analysis, Insights and Forecast - by Type
- 11. South America Hazardous Waste Management Market Analysis, Insights and Forecast, 2020-2032
- 11.1. Market Analysis, Insights and Forecast - by Type
- 11.1.1. Solid
- 11.1.2. Liquid
- 11.1.3. Sludge
- 11.2. Market Analysis, Insights and Forecast - by Waste
- 11.2.1. Chemicals
- 11.2.2. Biomedical
- 11.2.3. Radioactive
- 11.2.4. Other Waste (Corrosive, Flammable, etc.)
- 11.1. Market Analysis, Insights and Forecast - by Type
- 12. Competitive Analysis
- 12.1. Company Profiles
- 12.1.1 Suez
- 12.1.1.1. Company Overview
- 12.1.1.2. Products
- 12.1.1.3. Company Financials
- 12.1.1.4. SWOT Analysis
- 12.1.2 Valicor
- 12.1.2.1. Company Overview
- 12.1.2.2. Products
- 12.1.2.3. Company Financials
- 12.1.2.4. SWOT Analysis
- 12.1.3 Veolia
- 12.1.3.1. Company Overview
- 12.1.3.2. Products
- 12.1.3.3. Company Financials
- 12.1.3.4. SWOT Analysis
- 12.1.4 Waste Connections
- 12.1.4.1. Company Overview
- 12.1.4.2. Products
- 12.1.4.3. Company Financials
- 12.1.4.4. SWOT Analysis
- 12.1.5 Waste Management
- 12.1.5.1. Company Overview
- 12.1.5.2. Products
- 12.1.5.3. Company Financials
- 12.1.5.4. SWOT Analysis
- 12.1.6 Republic Services
- 12.1.6.1. Company Overview
- 12.1.6.2. Products
- 12.1.6.3. Company Financials
- 12.1.6.4. SWOT Analysis
- 12.1.7 Biffa
- 12.1.7.1. Company Overview
- 12.1.7.2. Products
- 12.1.7.3. Company Financials
- 12.1.7.4. SWOT Analysis
- 12.1.8 Clean Harbors
- 12.1.8.1. Company Overview
- 12.1.8.2. Products
- 12.1.8.3. Company Financials
- 12.1.8.4. SWOT Analysis
- 12.1.9 Covanta Holding
- 12.1.9.1. Company Overview
- 12.1.9.2. Products
- 12.1.9.3. Company Financials
- 12.1.9.4. SWOT Analysis
- 12.1.10 Daiseki
- 12.1.10.1. Company Overview
- 12.1.10.2. Products
- 12.1.10.3. Company Financials
- 12.1.10.4. SWOT Analysis
- 12.1.11 Hitachi Zosen
- 12.1.11.1. Company Overview
- 12.1.11.2. Products
- 12.1.11.3. Company Financials
- 12.1.11.4. SWOT Analysis
- 12.1.12 Remondis SE & Co Kg
- 12.1.12.1. Company Overview
- 12.1.12.2. Products
- 12.1.12.3. Company Financials
- 12.1.12.4. SWOT Analysis
- 12.1.13 Urbaser
- 12.1.13.1. Company Overview
- 12.1.13.2. Products
- 12.1.13.3. Company Financials
- 12.1.13.4. SWOT Analysis
- 12.1.14 Biomedical Solutions*List Not Exhaustive 6 3 Other Companie
- 12.1.14.1. Company Overview
- 12.1.14.2. Products
- 12.1.14.3. Company Financials
- 12.1.14.4. SWOT Analysis
- 12.1.1 Suez
- 12.2. Market Entropy
- 12.2.1 Company's Key Areas Served
- 12.2.2 Recent Developments
- 12.3. Company Market Share Analysis 2025
- 12.3.1 Top 5 Companies Market Share Analysis
- 12.3.2 Top 3 Companies Market Share Analysis
- 12.4. List of Potential Customers
- 13. Research Methodology
List of Figures
- Figure 1: Global Hazardous Waste Management Market Revenue Breakdown (Million, %) by Region 2025 & 2033
- Figure 2: Global Hazardous Waste Management Market Volume Breakdown (Billion, %) by Region 2025 & 2033
- Figure 3: North America Hazardous Waste Management Market Revenue (Million), by Type 2025 & 2033
- Figure 4: North America Hazardous Waste Management Market Volume (Billion), by Type 2025 & 2033
- Figure 5: North America Hazardous Waste Management Market Revenue Share (%), by Type 2025 & 2033
- Figure 6: North America Hazardous Waste Management Market Volume Share (%), by Type 2025 & 2033
- Figure 7: North America Hazardous Waste Management Market Revenue (Million), by Waste 2025 & 2033
- Figure 8: North America Hazardous Waste Management Market Volume (Billion), by Waste 2025 & 2033
- Figure 9: North America Hazardous Waste Management Market Revenue Share (%), by Waste 2025 & 2033
- Figure 10: North America Hazardous Waste Management Market Volume Share (%), by Waste 2025 & 2033
- Figure 11: North America Hazardous Waste Management Market Revenue (Million), by Country 2025 & 2033
- Figure 12: North America Hazardous Waste Management Market Volume (Billion), by Country 2025 & 2033
- Figure 13: North America Hazardous Waste Management Market Revenue Share (%), by Country 2025 & 2033
- Figure 14: North America Hazardous Waste Management Market Volume Share (%), by Country 2025 & 2033
- Figure 15: Europe Hazardous Waste Management Market Revenue (Million), by Type 2025 & 2033
- Figure 16: Europe Hazardous Waste Management Market Volume (Billion), by Type 2025 & 2033
- Figure 17: Europe Hazardous Waste Management Market Revenue Share (%), by Type 2025 & 2033
- Figure 18: Europe Hazardous Waste Management Market Volume Share (%), by Type 2025 & 2033
- Figure 19: Europe Hazardous Waste Management Market Revenue (Million), by Waste 2025 & 2033
- Figure 20: Europe Hazardous Waste Management Market Volume (Billion), by Waste 2025 & 2033
- Figure 21: Europe Hazardous Waste Management Market Revenue Share (%), by Waste 2025 & 2033
- Figure 22: Europe Hazardous Waste Management Market Volume Share (%), by Waste 2025 & 2033
- Figure 23: Europe Hazardous Waste Management Market Revenue (Million), by Country 2025 & 2033
- Figure 24: Europe Hazardous Waste Management Market Volume (Billion), by Country 2025 & 2033
- Figure 25: Europe Hazardous Waste Management Market Revenue Share (%), by Country 2025 & 2033
- Figure 26: Europe Hazardous Waste Management Market Volume Share (%), by Country 2025 & 2033
- Figure 27: Asia Pacific Hazardous Waste Management Market Revenue (Million), by Type 2025 & 2033
- Figure 28: Asia Pacific Hazardous Waste Management Market Volume (Billion), by Type 2025 & 2033
- Figure 29: Asia Pacific Hazardous Waste Management Market Revenue Share (%), by Type 2025 & 2033
- Figure 30: Asia Pacific Hazardous Waste Management Market Volume Share (%), by Type 2025 & 2033
- Figure 31: Asia Pacific Hazardous Waste Management Market Revenue (Million), by Waste 2025 & 2033
- Figure 32: Asia Pacific Hazardous Waste Management Market Volume (Billion), by Waste 2025 & 2033
- Figure 33: Asia Pacific Hazardous Waste Management Market Revenue Share (%), by Waste 2025 & 2033
- Figure 34: Asia Pacific Hazardous Waste Management Market Volume Share (%), by Waste 2025 & 2033
- Figure 35: Asia Pacific Hazardous Waste Management Market Revenue (Million), by Country 2025 & 2033
- Figure 36: Asia Pacific Hazardous Waste Management Market Volume (Billion), by Country 2025 & 2033
- Figure 37: Asia Pacific Hazardous Waste Management Market Revenue Share (%), by Country 2025 & 2033
- Figure 38: Asia Pacific Hazardous Waste Management Market Volume Share (%), by Country 2025 & 2033
- Figure 39: Middle East and Africa Hazardous Waste Management Market Revenue (Million), by Type 2025 & 2033
- Figure 40: Middle East and Africa Hazardous Waste Management Market Volume (Billion), by Type 2025 & 2033
- Figure 41: Middle East and Africa Hazardous Waste Management Market Revenue Share (%), by Type 2025 & 2033
- Figure 42: Middle East and Africa Hazardous Waste Management Market Volume Share (%), by Type 2025 & 2033
- Figure 43: Middle East and Africa Hazardous Waste Management Market Revenue (Million), by Waste 2025 & 2033
- Figure 44: Middle East and Africa Hazardous Waste Management Market Volume (Billion), by Waste 2025 & 2033
- Figure 45: Middle East and Africa Hazardous Waste Management Market Revenue Share (%), by Waste 2025 & 2033
- Figure 46: Middle East and Africa Hazardous Waste Management Market Volume Share (%), by Waste 2025 & 2033
- Figure 47: Middle East and Africa Hazardous Waste Management Market Revenue (Million), by Country 2025 & 2033
- Figure 48: Middle East and Africa Hazardous Waste Management Market Volume (Billion), by Country 2025 & 2033
- Figure 49: Middle East and Africa Hazardous Waste Management Market Revenue Share (%), by Country 2025 & 2033
- Figure 50: Middle East and Africa Hazardous Waste Management Market Volume Share (%), by Country 2025 & 2033
- Figure 51: South America Hazardous Waste Management Market Revenue (Million), by Type 2025 & 2033
- Figure 52: South America Hazardous Waste Management Market Volume (Billion), by Type 2025 & 2033
- Figure 53: South America Hazardous Waste Management Market Revenue Share (%), by Type 2025 & 2033
- Figure 54: South America Hazardous Waste Management Market Volume Share (%), by Type 2025 & 2033
- Figure 55: South America Hazardous Waste Management Market Revenue (Million), by Waste 2025 & 2033
- Figure 56: South America Hazardous Waste Management Market Volume (Billion), by Waste 2025 & 2033
- Figure 57: South America Hazardous Waste Management Market Revenue Share (%), by Waste 2025 & 2033
- Figure 58: South America Hazardous Waste Management Market Volume Share (%), by Waste 2025 & 2033
- Figure 59: South America Hazardous Waste Management Market Revenue (Million), by Country 2025 & 2033
- Figure 60: South America Hazardous Waste Management Market Volume (Billion), by Country 2025 & 2033
- Figure 61: South America Hazardous Waste Management Market Revenue Share (%), by Country 2025 & 2033
- Figure 62: South America Hazardous Waste Management Market Volume Share (%), by Country 2025 & 2033
List of Tables
- Table 1: Global Hazardous Waste Management Market Revenue Million Forecast, by Type 2020 & 2033
- Table 2: Global Hazardous Waste Management Market Volume Billion Forecast, by Type 2020 & 2033
- Table 3: Global Hazardous Waste Management Market Revenue Million Forecast, by Waste 2020 & 2033
- Table 4: Global Hazardous Waste Management Market Volume Billion Forecast, by Waste 2020 & 2033
- Table 5: Global Hazardous Waste Management Market Revenue Million Forecast, by Region 2020 & 2033
- Table 6: Global Hazardous Waste Management Market Volume Billion Forecast, by Region 2020 & 2033
- Table 7: Global Hazardous Waste Management Market Revenue Million Forecast, by Type 2020 & 2033
- Table 8: Global Hazardous Waste Management Market Volume Billion Forecast, by Type 2020 & 2033
- Table 9: Global Hazardous Waste Management Market Revenue Million Forecast, by Waste 2020 & 2033
- Table 10: Global Hazardous Waste Management Market Volume Billion Forecast, by Waste 2020 & 2033
- Table 11: Global Hazardous Waste Management Market Revenue Million Forecast, by Country 2020 & 2033
- Table 12: Global Hazardous Waste Management Market Volume Billion Forecast, by Country 2020 & 2033
- Table 13: United States Hazardous Waste Management Market Revenue (Million) Forecast, by Application 2020 & 2033
- Table 14: United States Hazardous Waste Management Market Volume (Billion) Forecast, by Application 2020 & 2033
- Table 15: Canada Hazardous Waste Management Market Revenue (Million) Forecast, by Application 2020 & 2033
- Table 16: Canada Hazardous Waste Management Market Volume (Billion) Forecast, by Application 2020 & 2033
- Table 17: Global Hazardous Waste Management Market Revenue Million Forecast, by Type 2020 & 2033
- Table 18: Global Hazardous Waste Management Market Volume Billion Forecast, by Type 2020 & 2033
- Table 19: Global Hazardous Waste Management Market Revenue Million Forecast, by Waste 2020 & 2033
- Table 20: Global Hazardous Waste Management Market Volume Billion Forecast, by Waste 2020 & 2033
- Table 21: Global Hazardous Waste Management Market Revenue Million Forecast, by Country 2020 & 2033
- Table 22: Global Hazardous Waste Management Market Volume Billion Forecast, by Country 2020 & 2033
- Table 23: Germany Hazardous Waste Management Market Revenue (Million) Forecast, by Application 2020 & 2033
- Table 24: Germany Hazardous Waste Management Market Volume (Billion) Forecast, by Application 2020 & 2033
- Table 25: United Kingdom Hazardous Waste Management Market Revenue (Million) Forecast, by Application 2020 & 2033
- Table 26: United Kingdom Hazardous Waste Management Market Volume (Billion) Forecast, by Application 2020 & 2033
- Table 27: France Hazardous Waste Management Market Revenue (Million) Forecast, by Application 2020 & 2033
- Table 28: France Hazardous Waste Management Market Volume (Billion) Forecast, by Application 2020 & 2033
- Table 29: Russia Hazardous Waste Management Market Revenue (Million) Forecast, by Application 2020 & 2033
- Table 30: Russia Hazardous Waste Management Market Volume (Billion) Forecast, by Application 2020 & 2033
- Table 31: Spain Hazardous Waste Management Market Revenue (Million) Forecast, by Application 2020 & 2033
- Table 32: Spain Hazardous Waste Management Market Volume (Billion) Forecast, by Application 2020 & 2033
- Table 33: Rest of Europe Hazardous Waste Management Market Revenue (Million) Forecast, by Application 2020 & 2033
- Table 34: Rest of Europe Hazardous Waste Management Market Volume (Billion) Forecast, by Application 2020 & 2033
- Table 35: Global Hazardous Waste Management Market Revenue Million Forecast, by Type 2020 & 2033
- Table 36: Global Hazardous Waste Management Market Volume Billion Forecast, by Type 2020 & 2033
- Table 37: Global Hazardous Waste Management Market Revenue Million Forecast, by Waste 2020 & 2033
- Table 38: Global Hazardous Waste Management Market Volume Billion Forecast, by Waste 2020 & 2033
- Table 39: Global Hazardous Waste Management Market Revenue Million Forecast, by Country 2020 & 2033
- Table 40: Global Hazardous Waste Management Market Volume Billion Forecast, by Country 2020 & 2033
- Table 41: India Hazardous Waste Management Market Revenue (Million) Forecast, by Application 2020 & 2033
- Table 42: India Hazardous Waste Management Market Volume (Billion) Forecast, by Application 2020 & 2033
- Table 43: China Hazardous Waste Management Market Revenue (Million) Forecast, by Application 2020 & 2033
- Table 44: China Hazardous Waste Management Market Volume (Billion) Forecast, by Application 2020 & 2033
- Table 45: Japan Hazardous Waste Management Market Revenue (Million) Forecast, by Application 2020 & 2033
- Table 46: Japan Hazardous Waste Management Market Volume (Billion) Forecast, by Application 2020 & 2033
- Table 47: Rest of Asia Pacific Hazardous Waste Management Market Revenue (Million) Forecast, by Application 2020 & 2033
- Table 48: Rest of Asia Pacific Hazardous Waste Management Market Volume (Billion) Forecast, by Application 2020 & 2033
- Table 49: Global Hazardous Waste Management Market Revenue Million Forecast, by Type 2020 & 2033
- Table 50: Global Hazardous Waste Management Market Volume Billion Forecast, by Type 2020 & 2033
- Table 51: Global Hazardous Waste Management Market Revenue Million Forecast, by Waste 2020 & 2033
- Table 52: Global Hazardous Waste Management Market Volume Billion Forecast, by Waste 2020 & 2033
- Table 53: Global Hazardous Waste Management Market Revenue Million Forecast, by Country 2020 & 2033
- Table 54: Global Hazardous Waste Management Market Volume Billion Forecast, by Country 2020 & 2033
- Table 55: United Arab Emirates Hazardous Waste Management Market Revenue (Million) Forecast, by Application 2020 & 2033
- Table 56: United Arab Emirates Hazardous Waste Management Market Volume (Billion) Forecast, by Application 2020 & 2033
- Table 57: Saudi Arabia Hazardous Waste Management Market Revenue (Million) Forecast, by Application 2020 & 2033
- Table 58: Saudi Arabia Hazardous Waste Management Market Volume (Billion) Forecast, by Application 2020 & 2033
- Table 59: Rest of Middle East Hazardous Waste Management Market Revenue (Million) Forecast, by Application 2020 & 2033
- Table 60: Rest of Middle East Hazardous Waste Management Market Volume (Billion) Forecast, by Application 2020 & 2033
- Table 61: Global Hazardous Waste Management Market Revenue Million Forecast, by Type 2020 & 2033
- Table 62: Global Hazardous Waste Management Market Volume Billion Forecast, by Type 2020 & 2033
- Table 63: Global Hazardous Waste Management Market Revenue Million Forecast, by Waste 2020 & 2033
- Table 64: Global Hazardous Waste Management Market Volume Billion Forecast, by Waste 2020 & 2033
- Table 65: Global Hazardous Waste Management Market Revenue Million Forecast, by Country 2020 & 2033
- Table 66: Global Hazardous Waste Management Market Volume Billion Forecast, by Country 2020 & 2033
- Table 67: Brazil Hazardous Waste Management Market Revenue (Million) Forecast, by Application 2020 & 2033
- Table 68: Brazil Hazardous Waste Management Market Volume (Billion) Forecast, by Application 2020 & 2033
- Table 69: Argentina Hazardous Waste Management Market Revenue (Million) Forecast, by Application 2020 & 2033
- Table 70: Argentina Hazardous Waste Management Market Volume (Billion) Forecast, by Application 2020 & 2033
- Table 71: Rest of South America Hazardous Waste Management Market Revenue (Million) Forecast, by Application 2020 & 2033
- Table 72: Rest of South America Hazardous Waste Management Market Volume (Billion) Forecast, by Application 2020 & 2033
Frequently Asked Questions
1. What is the projected Compound Annual Growth Rate (CAGR) of the Hazardous Waste Management Market?
The projected CAGR is approximately 3.74%.
2. Which companies are prominent players in the Hazardous Waste Management Market?
Key companies in the market include Suez, Valicor, Veolia, Waste Connections, Waste Management, Republic Services, Biffa, Clean Harbors, Covanta Holding, Daiseki, Hitachi Zosen, Remondis SE & Co Kg, Urbaser, Biomedical Solutions*List Not Exhaustive 6 3 Other Companie.
3. What are the main segments of the Hazardous Waste Management Market?
The market segments include Type, Waste.
4. Can you provide details about the market size?
The market size is estimated to be USD 38.77 Million as of 2022.
5. What are some drivers contributing to market growth?
Stringent Global Environmental Regulations Drive Demand for Compliant Hazardous Waste Management and Disposal Solutions; Increased Industrial Activities and Urbanization Driving up Hazardous Waste Production. Fueling Demand for Waste Management Services; Innovations in Waste Treatment Technologies. such as Advanced Recycling and Waste-to-Energy Processes. Enhance Efficiency and Reduce Environmental Impact.
6. What are the notable trends driving market growth?
Asia-Pacific Expected to Dominate the Market Over the Coming Years.
7. Are there any restraints impacting market growth?
Stringent Global Environmental Regulations Drive Demand for Compliant Hazardous Waste Management and Disposal Solutions; Increased Industrial Activities and Urbanization Driving up Hazardous Waste Production. Fueling Demand for Waste Management Services; Innovations in Waste Treatment Technologies. such as Advanced Recycling and Waste-to-Energy Processes. Enhance Efficiency and Reduce Environmental Impact.
8. Can you provide examples of recent developments in the market?
April 2024: China Everbright Environment Group Limited, known as Everbright Environment, celebrated the successful construction of its Hue Waste-to-Energy Project in Thua Thien Hue Province, Vietnam. The event was graced by the presence of Vietnamese Prime Minister Pham Minh Chinh.
9. What pricing options are available for accessing the report?
Pricing options include single-user, multi-user, and enterprise licenses priced at USD 4750, USD 5250, and USD 8750 respectively.
10. Is the market size provided in terms of value or volume?
The market size is provided in terms of value, measured in Million and volume, measured in Billion.
11. Are there any specific market keywords associated with the report?
Yes, the market keyword associated with the report is "Hazardous Waste Management Market," which aids in identifying and referencing the specific market segment covered.
12. How do I determine which pricing option suits my needs best?
The pricing options vary based on user requirements and access needs. Individual users may opt for single-user licenses, while businesses requiring broader access may choose multi-user or enterprise licenses for cost-effective access to the report.
13. Are there any additional resources or data provided in the Hazardous Waste Management Market report?
While the report offers comprehensive insights, it's advisable to review the specific contents or supplementary materials provided to ascertain if additional resources or data are available.
14. How can I stay updated on further developments or reports in the Hazardous Waste Management Market?
To stay informed about further developments, trends, and reports in the Hazardous Waste Management Market, consider subscribing to industry newsletters, following relevant companies and organizations, or regularly checking reputable industry news sources and publications.
Methodology
Step 1 - Identification of Relevant Samples Size from Population Database


Step 2 - Approaches for Defining Global Market Size (Value, Volume* & Price*)

Note*: In applicable scenarios
Step 3 - Data Sources
Primary Research
- Web Analytics
- Survey Reports
- Research Institute
- Latest Research Reports
- Opinion Leaders
Secondary Research
- Annual Reports
- White Paper
- Latest Press Release
- Industry Association
- Paid Database
- Investor Presentations

Step 4 - Data Triangulation
Involves using different sources of information in order to increase the validity of a study
These sources are likely to be stakeholders in a program - participants, other researchers, program staff, other community members, and so on.
Then we put all data in single framework & apply various statistical tools to find out the dynamic on the market.
During the analysis stage, feedback from the stakeholder groups would be compared to determine areas of agreement as well as areas of divergence