

Key Insights
The High-Power Gallium Nitride (GaN) Devices market is experiencing substantial expansion, driven by increasing demand across key industries. GaN's inherent superiority over traditional silicon-based semiconductors, including enhanced efficiency, compact form factors, and faster switching capabilities, fuels its adoption for reduced energy consumption and improved system performance. Primary application areas encompass radar systems, satellite communications, 5G base stations, renewable energy inverters, and power switches for electric vehicles and industrial automation. The market is segmented by application (Radar, Satellite, Base Station, Inverter, Power Switch, Others) and by type (Transistors, Diodes), with transistors currently dominating due to their versatility in high-power applications. Leading players are actively investing in research & development and manufacturing capacity to address escalating demand.
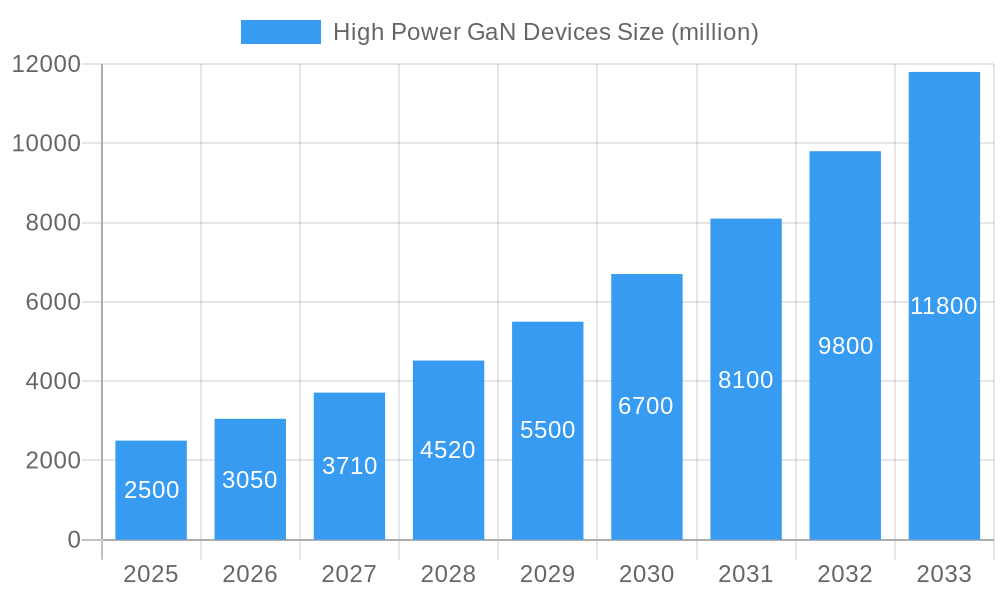
High Power GaN Devices Market Size (In Million)
Geographically, North America and Asia Pacific exhibit strong growth, propelled by infrastructure development and increased GaN integration in consumer electronics and industrial sectors. Although the initial cost of GaN devices has been a constraint, ongoing technological advancements and economies of scale are projected to diminish this challenge, accelerating future market growth. We forecast a Compound Annual Growth Rate (CAGR) of 35.9%, with the market size expected to reach 635.1 million by 2025.
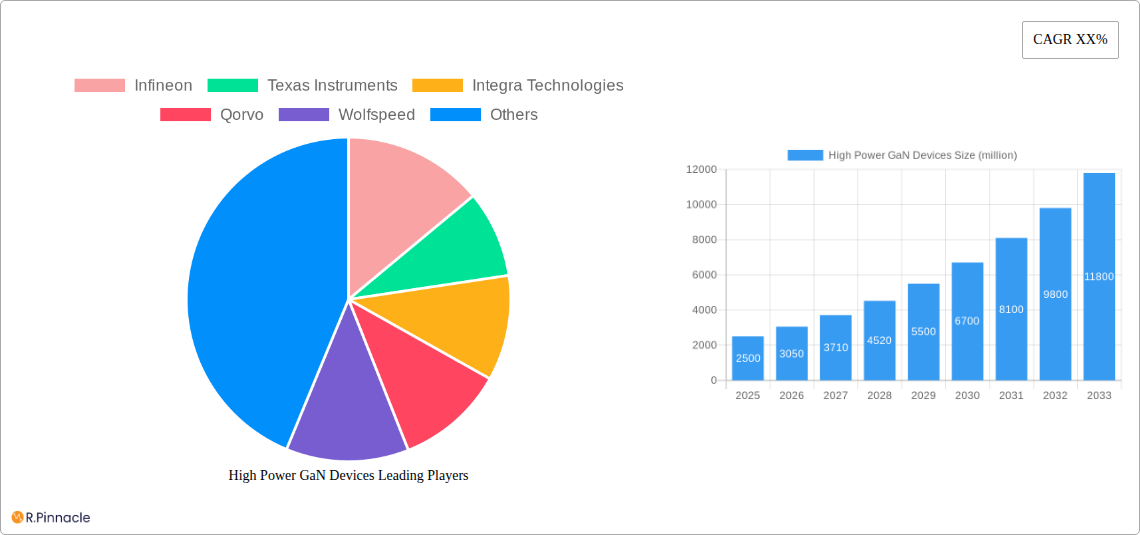
High Power GaN Devices Company Market Share
The competitive environment is dynamic, characterized by intense competition among established semiconductor manufacturers and specialized GaN companies. Strategic collaborations, mergers, and acquisitions are anticipated to redefine the industry. Furthermore, the escalating emphasis on energy efficiency and sustainability significantly benefits the GaN market, as its technology facilitates a reduced carbon footprint across numerous applications. Government initiatives supporting renewable energy and energy-efficient technologies amplify this trend. Continuous advancements in GaN device performance, coupled with declining production costs, will drive broader adoption in diverse sectors, cementing its role as a pivotal technology for next-generation power electronics.
High Power GaN Devices Market Report: 2019-2033
This comprehensive report delivers an in-depth analysis of the High Power GaN Devices market, providing invaluable insights for industry professionals, investors, and strategic decision-makers. Spanning the period 2019-2033, with a base year of 2025 and a forecast period of 2025-2033, this report offers a detailed understanding of market dynamics, growth drivers, challenges, and future opportunities. The market is projected to reach xx million by 2033, exhibiting a CAGR of xx% during the forecast period.
High Power GaN Devices Market Structure & Innovation Trends
The High Power GaN Devices market is characterized by a moderately concentrated landscape, with key players including Infineon, Texas Instruments, Integra Technologies, Qorvo, Wolfspeed, Efficient Power Conversion, GaN Systems, Nexperia, STMicroelectronics, GOHM, Navitas, Power Integrations, Transphorm, Panasonic, GaNPower, Toshiba, and Mitsubishi Electric. Market share is currently distributed amongst these players, with Infineon and Texas Instruments holding a significant portion. Innovation is driven by advancements in GaN technology, leading to higher efficiency, power density, and thermal performance. M&A activities, while not frequent, play a significant role in shaping the market landscape. Recent deals, valued at an estimated xx million collectively, have focused on expanding technology portfolios and gaining access to new markets. Regulatory frameworks related to energy efficiency and environmental concerns are also shaping industry development. Product substitutes, such as silicon-based devices, pose a challenge, but GaN's superior performance is steadily increasing its market penetration.
High Power GaN Devices Market Dynamics & Trends
The High Power GaN Devices market is experiencing robust growth, driven primarily by increasing demand from diverse sectors like telecommunications (base stations, 5G infrastructure), automotive (electric vehicles, inverters), and renewable energy (solar inverters, wind turbines). Technological disruptions, including the development of higher power GaN transistors and diodes, are further accelerating market growth. Consumer preferences towards energy-efficient and compact electronic devices fuels demand. Competitive dynamics are intense, with companies continuously investing in R&D to improve device performance and reduce manufacturing costs. The market is expected to see significant penetration in various applications, with a projected market size of xx million in 2025, rising to xx million by 2033. This translates to a robust CAGR of xx%.
Dominant Regions & Segments in High Power GaN Devices
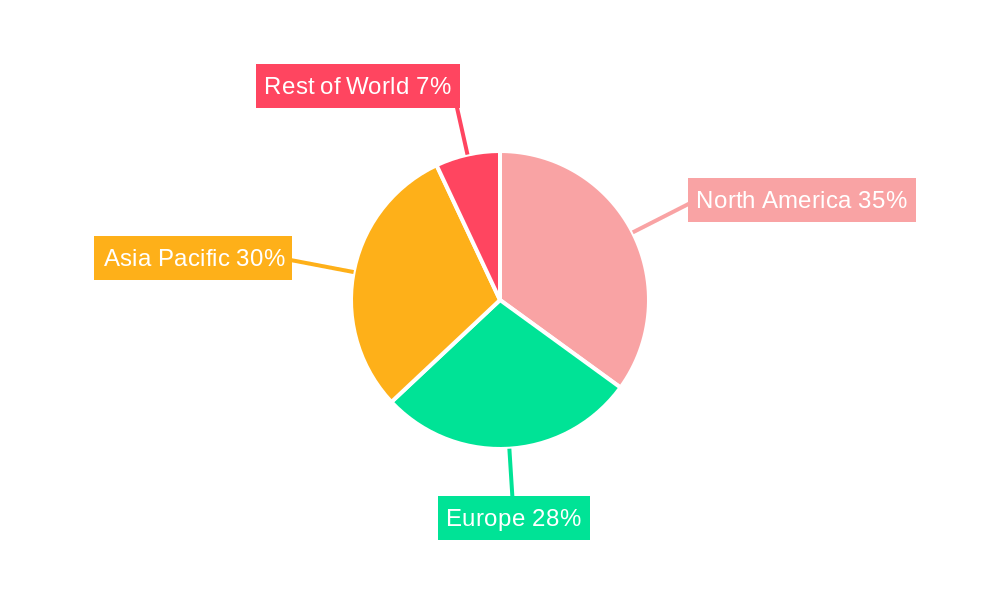
The North American region currently dominates the High Power GaN Devices market, fueled by robust technological advancements and high adoption in key industries.
- Key Drivers in North America: Strong R&D investments, government support for renewable energy initiatives, and the presence of major GaN device manufacturers.
- Dominant Application Segments: The inverter segment is currently the leading application, due to the increasing demand for electric vehicles and renewable energy systems. The base station segment is also experiencing substantial growth fueled by 5G deployment.
- Dominant Device Type: GaN transistors currently hold the largest market share compared to GaN diodes, attributed to their wider range of applications.
Other regions, including Asia-Pacific and Europe, are witnessing rapid growth, driven by expanding industrialization and infrastructure development. However, factors like manufacturing costs and technological advancements influence regional dominance.
High Power GaN Devices Product Innovations
Recent years have witnessed significant innovations in high power GaN devices, focusing on increasing power density, efficiency, and reliability. The development of wide bandgap technology has enabled the creation of devices capable of handling higher voltages and currents while significantly reducing energy losses. These innovations are improving the market fit for applications requiring high performance and energy efficiency, particularly in electric vehicles, renewable energy systems, and telecommunications.
Report Scope & Segmentation Analysis
This report segments the High Power GaN Devices market by application (Radar, Satellite, Base Station, Inverter, Power Switch, Others) and type (Transistors, Diodes). Each segment's growth is analyzed, considering the market size, growth rate, and competitive landscape. The Inverter segment is anticipated to dominate due to the burgeoning electric vehicle market. Similarly, GaN transistors are expected to capture a larger market share driven by their superior performance. Detailed growth projections, market size estimations, and competitive analyses are provided for each segment in the full report.
Key Drivers of High Power GaN Devices Growth
Several factors drive the growth of the High Power GaN Devices market. The increasing demand for energy-efficient power solutions in various industries is a major driver. Government initiatives promoting renewable energy and electric vehicles also contribute significantly. Furthermore, continuous technological advancements leading to improved device performance and reduced costs are fueling market expansion.
Challenges in the High Power GaN Devices Sector
The High Power GaN Devices market faces certain challenges. High manufacturing costs remain a barrier to wider adoption, especially in price-sensitive markets. Competition from established silicon-based technologies also poses a challenge. Supply chain disruptions and the availability of raw materials can also impact production and market growth.
Emerging Opportunities in High Power GaN Devices
Several emerging opportunities exist for growth in the High Power GaN Devices market. The expansion of 5G infrastructure presents a significant growth opportunity. Additionally, the burgeoning electric vehicle market and the increasing adoption of renewable energy technologies create a high demand for efficient power solutions. Advancements in GaN technology and the development of new applications are likely to drive significant market expansion.
Leading Players in the High Power GaN Devices Market
- Infineon
- Texas Instruments
- Integra Technologies
- Qorvo
- Wolfspeed
- Efficient Power Conversion
- GaN Systems
- Nexperia
- STMicroelectronics
- GOHM
- Navitas
- Power Integrations
- Transphorm
- Panasonic
- GaNPower
- Toshiba
- Mitsubishi Electric
Key Developments in High Power GaN Devices Industry
- 2022 Q4: Infineon launches a new line of high-power GaN transistors, improving efficiency by 15%.
- 2023 Q1: Texas Instruments announces a strategic partnership with a major automotive manufacturer to develop GaN-based inverters for electric vehicles.
- 2023 Q2: Wolfspeed expands its GaN production capacity to meet growing market demand. (Further developments will be detailed in the full report.)
Future Outlook for High Power GaN Devices Market
The future outlook for the High Power GaN Devices market is highly promising. Continuous technological advancements, coupled with increasing demand from diverse applications, will fuel robust market growth. Strategic partnerships and collaborations between key players will further accelerate the market's expansion. The focus on improving efficiency and reducing costs will make GaN devices increasingly competitive, leading to wider adoption across various sectors. The market is poised for significant growth throughout the forecast period.
High Power GaN Devices Segmentation
-
1. Application
- 1.1. Radar
- 1.2. Satellite
- 1.3. Base Station
- 1.4. Inverter
- 1.5. Power Switch
- 1.6. Others
-
2. Types
- 2.1. Transistors
- 2.2. Diodes
High Power GaN Devices Segmentation By Geography
-
1. North America
- 1.1. United States
- 1.2. Canada
- 1.3. Mexico
-
2. South America
- 2.1. Brazil
- 2.2. Argentina
- 2.3. Rest of South America
-
3. Europe
- 3.1. United Kingdom
- 3.2. Germany
- 3.3. France
- 3.4. Italy
- 3.5. Spain
- 3.6. Russia
- 3.7. Benelux
- 3.8. Nordics
- 3.9. Rest of Europe
-
4. Middle East & Africa
- 4.1. Turkey
- 4.2. Israel
- 4.3. GCC
- 4.4. North Africa
- 4.5. South Africa
- 4.6. Rest of Middle East & Africa
-
5. Asia Pacific
- 5.1. China
- 5.2. India
- 5.3. Japan
- 5.4. South Korea
- 5.5. ASEAN
- 5.6. Oceania
- 5.7. Rest of Asia Pacific
High Power GaN Devices Regional Market Share
Geographic Coverage of High Power GaN Devices
High Power GaN Devices REPORT HIGHLIGHTS
| Aspects | Details |
|---|---|
| Study Period | 2020-2034 |
| Base Year | 2025 |
| Estimated Year | 2026 |
| Forecast Period | 2026-2034 |
| Historical Period | 2020-2025 |
| Growth Rate | CAGR of 35.9% from 2020-2034 |
| Segmentation |
|
Table of Contents
- 1. Introduction
- 1.1. Research Scope
- 1.2. Market Segmentation
- 1.3. Research Methodology
- 1.4. Definitions and Assumptions
- 2. Executive Summary
- 2.1. Introduction
- 3. Market Dynamics
- 3.1. Introduction
- 3.2. Market Drivers
- 3.3. Market Restrains
- 3.4. Market Trends
- 4. Market Factor Analysis
- 4.1. Porters Five Forces
- 4.2. Supply/Value Chain
- 4.3. PESTEL analysis
- 4.4. Market Entropy
- 4.5. Patent/Trademark Analysis
- 5. Global High Power GaN Devices Analysis, Insights and Forecast, 2020-2032
- 5.1. Market Analysis, Insights and Forecast - by Application
- 5.1.1. Radar
- 5.1.2. Satellite
- 5.1.3. Base Station
- 5.1.4. Inverter
- 5.1.5. Power Switch
- 5.1.6. Others
- 5.2. Market Analysis, Insights and Forecast - by Types
- 5.2.1. Transistors
- 5.2.2. Diodes
- 5.3. Market Analysis, Insights and Forecast - by Region
- 5.3.1. North America
- 5.3.2. South America
- 5.3.3. Europe
- 5.3.4. Middle East & Africa
- 5.3.5. Asia Pacific
- 5.1. Market Analysis, Insights and Forecast - by Application
- 6. North America High Power GaN Devices Analysis, Insights and Forecast, 2020-2032
- 6.1. Market Analysis, Insights and Forecast - by Application
- 6.1.1. Radar
- 6.1.2. Satellite
- 6.1.3. Base Station
- 6.1.4. Inverter
- 6.1.5. Power Switch
- 6.1.6. Others
- 6.2. Market Analysis, Insights and Forecast - by Types
- 6.2.1. Transistors
- 6.2.2. Diodes
- 6.1. Market Analysis, Insights and Forecast - by Application
- 7. South America High Power GaN Devices Analysis, Insights and Forecast, 2020-2032
- 7.1. Market Analysis, Insights and Forecast - by Application
- 7.1.1. Radar
- 7.1.2. Satellite
- 7.1.3. Base Station
- 7.1.4. Inverter
- 7.1.5. Power Switch
- 7.1.6. Others
- 7.2. Market Analysis, Insights and Forecast - by Types
- 7.2.1. Transistors
- 7.2.2. Diodes
- 7.1. Market Analysis, Insights and Forecast - by Application
- 8. Europe High Power GaN Devices Analysis, Insights and Forecast, 2020-2032
- 8.1. Market Analysis, Insights and Forecast - by Application
- 8.1.1. Radar
- 8.1.2. Satellite
- 8.1.3. Base Station
- 8.1.4. Inverter
- 8.1.5. Power Switch
- 8.1.6. Others
- 8.2. Market Analysis, Insights and Forecast - by Types
- 8.2.1. Transistors
- 8.2.2. Diodes
- 8.1. Market Analysis, Insights and Forecast - by Application
- 9. Middle East & Africa High Power GaN Devices Analysis, Insights and Forecast, 2020-2032
- 9.1. Market Analysis, Insights and Forecast - by Application
- 9.1.1. Radar
- 9.1.2. Satellite
- 9.1.3. Base Station
- 9.1.4. Inverter
- 9.1.5. Power Switch
- 9.1.6. Others
- 9.2. Market Analysis, Insights and Forecast - by Types
- 9.2.1. Transistors
- 9.2.2. Diodes
- 9.1. Market Analysis, Insights and Forecast - by Application
- 10. Asia Pacific High Power GaN Devices Analysis, Insights and Forecast, 2020-2032
- 10.1. Market Analysis, Insights and Forecast - by Application
- 10.1.1. Radar
- 10.1.2. Satellite
- 10.1.3. Base Station
- 10.1.4. Inverter
- 10.1.5. Power Switch
- 10.1.6. Others
- 10.2. Market Analysis, Insights and Forecast - by Types
- 10.2.1. Transistors
- 10.2.2. Diodes
- 10.1. Market Analysis, Insights and Forecast - by Application
- 11. Competitive Analysis
- 11.1. Global Market Share Analysis 2025
- 11.2. Company Profiles
- 11.2.1 Infineon
- 11.2.1.1. Overview
- 11.2.1.2. Products
- 11.2.1.3. SWOT Analysis
- 11.2.1.4. Recent Developments
- 11.2.1.5. Financials (Based on Availability)
- 11.2.2 Texas Instruments
- 11.2.2.1. Overview
- 11.2.2.2. Products
- 11.2.2.3. SWOT Analysis
- 11.2.2.4. Recent Developments
- 11.2.2.5. Financials (Based on Availability)
- 11.2.3 Integra Technologies
- 11.2.3.1. Overview
- 11.2.3.2. Products
- 11.2.3.3. SWOT Analysis
- 11.2.3.4. Recent Developments
- 11.2.3.5. Financials (Based on Availability)
- 11.2.4 Qorvo
- 11.2.4.1. Overview
- 11.2.4.2. Products
- 11.2.4.3. SWOT Analysis
- 11.2.4.4. Recent Developments
- 11.2.4.5. Financials (Based on Availability)
- 11.2.5 Wolfspeed
- 11.2.5.1. Overview
- 11.2.5.2. Products
- 11.2.5.3. SWOT Analysis
- 11.2.5.4. Recent Developments
- 11.2.5.5. Financials (Based on Availability)
- 11.2.6 Efficient Power Conversion
- 11.2.6.1. Overview
- 11.2.6.2. Products
- 11.2.6.3. SWOT Analysis
- 11.2.6.4. Recent Developments
- 11.2.6.5. Financials (Based on Availability)
- 11.2.7 GaN Systems
- 11.2.7.1. Overview
- 11.2.7.2. Products
- 11.2.7.3. SWOT Analysis
- 11.2.7.4. Recent Developments
- 11.2.7.5. Financials (Based on Availability)
- 11.2.8 Nexperia
- 11.2.8.1. Overview
- 11.2.8.2. Products
- 11.2.8.3. SWOT Analysis
- 11.2.8.4. Recent Developments
- 11.2.8.5. Financials (Based on Availability)
- 11.2.9 STMicroelectronics
- 11.2.9.1. Overview
- 11.2.9.2. Products
- 11.2.9.3. SWOT Analysis
- 11.2.9.4. Recent Developments
- 11.2.9.5. Financials (Based on Availability)
- 11.2.10 GOHM
- 11.2.10.1. Overview
- 11.2.10.2. Products
- 11.2.10.3. SWOT Analysis
- 11.2.10.4. Recent Developments
- 11.2.10.5. Financials (Based on Availability)
- 11.2.11 Navitas
- 11.2.11.1. Overview
- 11.2.11.2. Products
- 11.2.11.3. SWOT Analysis
- 11.2.11.4. Recent Developments
- 11.2.11.5. Financials (Based on Availability)
- 11.2.12 Power Integrations
- 11.2.12.1. Overview
- 11.2.12.2. Products
- 11.2.12.3. SWOT Analysis
- 11.2.12.4. Recent Developments
- 11.2.12.5. Financials (Based on Availability)
- 11.2.13 Transphorm
- 11.2.13.1. Overview
- 11.2.13.2. Products
- 11.2.13.3. SWOT Analysis
- 11.2.13.4. Recent Developments
- 11.2.13.5. Financials (Based on Availability)
- 11.2.14 Panasonic
- 11.2.14.1. Overview
- 11.2.14.2. Products
- 11.2.14.3. SWOT Analysis
- 11.2.14.4. Recent Developments
- 11.2.14.5. Financials (Based on Availability)
- 11.2.15 GaNPower
- 11.2.15.1. Overview
- 11.2.15.2. Products
- 11.2.15.3. SWOT Analysis
- 11.2.15.4. Recent Developments
- 11.2.15.5. Financials (Based on Availability)
- 11.2.16 Toshiba
- 11.2.16.1. Overview
- 11.2.16.2. Products
- 11.2.16.3. SWOT Analysis
- 11.2.16.4. Recent Developments
- 11.2.16.5. Financials (Based on Availability)
- 11.2.17 Mitsubishi Electric
- 11.2.17.1. Overview
- 11.2.17.2. Products
- 11.2.17.3. SWOT Analysis
- 11.2.17.4. Recent Developments
- 11.2.17.5. Financials (Based on Availability)
- 11.2.1 Infineon
List of Figures
- Figure 1: Global High Power GaN Devices Revenue Breakdown (million, %) by Region 2025 & 2033
- Figure 2: Global High Power GaN Devices Volume Breakdown (K, %) by Region 2025 & 2033
- Figure 3: North America High Power GaN Devices Revenue (million), by Application 2025 & 2033
- Figure 4: North America High Power GaN Devices Volume (K), by Application 2025 & 2033
- Figure 5: North America High Power GaN Devices Revenue Share (%), by Application 2025 & 2033
- Figure 6: North America High Power GaN Devices Volume Share (%), by Application 2025 & 2033
- Figure 7: North America High Power GaN Devices Revenue (million), by Types 2025 & 2033
- Figure 8: North America High Power GaN Devices Volume (K), by Types 2025 & 2033
- Figure 9: North America High Power GaN Devices Revenue Share (%), by Types 2025 & 2033
- Figure 10: North America High Power GaN Devices Volume Share (%), by Types 2025 & 2033
- Figure 11: North America High Power GaN Devices Revenue (million), by Country 2025 & 2033
- Figure 12: North America High Power GaN Devices Volume (K), by Country 2025 & 2033
- Figure 13: North America High Power GaN Devices Revenue Share (%), by Country 2025 & 2033
- Figure 14: North America High Power GaN Devices Volume Share (%), by Country 2025 & 2033
- Figure 15: South America High Power GaN Devices Revenue (million), by Application 2025 & 2033
- Figure 16: South America High Power GaN Devices Volume (K), by Application 2025 & 2033
- Figure 17: South America High Power GaN Devices Revenue Share (%), by Application 2025 & 2033
- Figure 18: South America High Power GaN Devices Volume Share (%), by Application 2025 & 2033
- Figure 19: South America High Power GaN Devices Revenue (million), by Types 2025 & 2033
- Figure 20: South America High Power GaN Devices Volume (K), by Types 2025 & 2033
- Figure 21: South America High Power GaN Devices Revenue Share (%), by Types 2025 & 2033
- Figure 22: South America High Power GaN Devices Volume Share (%), by Types 2025 & 2033
- Figure 23: South America High Power GaN Devices Revenue (million), by Country 2025 & 2033
- Figure 24: South America High Power GaN Devices Volume (K), by Country 2025 & 2033
- Figure 25: South America High Power GaN Devices Revenue Share (%), by Country 2025 & 2033
- Figure 26: South America High Power GaN Devices Volume Share (%), by Country 2025 & 2033
- Figure 27: Europe High Power GaN Devices Revenue (million), by Application 2025 & 2033
- Figure 28: Europe High Power GaN Devices Volume (K), by Application 2025 & 2033
- Figure 29: Europe High Power GaN Devices Revenue Share (%), by Application 2025 & 2033
- Figure 30: Europe High Power GaN Devices Volume Share (%), by Application 2025 & 2033
- Figure 31: Europe High Power GaN Devices Revenue (million), by Types 2025 & 2033
- Figure 32: Europe High Power GaN Devices Volume (K), by Types 2025 & 2033
- Figure 33: Europe High Power GaN Devices Revenue Share (%), by Types 2025 & 2033
- Figure 34: Europe High Power GaN Devices Volume Share (%), by Types 2025 & 2033
- Figure 35: Europe High Power GaN Devices Revenue (million), by Country 2025 & 2033
- Figure 36: Europe High Power GaN Devices Volume (K), by Country 2025 & 2033
- Figure 37: Europe High Power GaN Devices Revenue Share (%), by Country 2025 & 2033
- Figure 38: Europe High Power GaN Devices Volume Share (%), by Country 2025 & 2033
- Figure 39: Middle East & Africa High Power GaN Devices Revenue (million), by Application 2025 & 2033
- Figure 40: Middle East & Africa High Power GaN Devices Volume (K), by Application 2025 & 2033
- Figure 41: Middle East & Africa High Power GaN Devices Revenue Share (%), by Application 2025 & 2033
- Figure 42: Middle East & Africa High Power GaN Devices Volume Share (%), by Application 2025 & 2033
- Figure 43: Middle East & Africa High Power GaN Devices Revenue (million), by Types 2025 & 2033
- Figure 44: Middle East & Africa High Power GaN Devices Volume (K), by Types 2025 & 2033
- Figure 45: Middle East & Africa High Power GaN Devices Revenue Share (%), by Types 2025 & 2033
- Figure 46: Middle East & Africa High Power GaN Devices Volume Share (%), by Types 2025 & 2033
- Figure 47: Middle East & Africa High Power GaN Devices Revenue (million), by Country 2025 & 2033
- Figure 48: Middle East & Africa High Power GaN Devices Volume (K), by Country 2025 & 2033
- Figure 49: Middle East & Africa High Power GaN Devices Revenue Share (%), by Country 2025 & 2033
- Figure 50: Middle East & Africa High Power GaN Devices Volume Share (%), by Country 2025 & 2033
- Figure 51: Asia Pacific High Power GaN Devices Revenue (million), by Application 2025 & 2033
- Figure 52: Asia Pacific High Power GaN Devices Volume (K), by Application 2025 & 2033
- Figure 53: Asia Pacific High Power GaN Devices Revenue Share (%), by Application 2025 & 2033
- Figure 54: Asia Pacific High Power GaN Devices Volume Share (%), by Application 2025 & 2033
- Figure 55: Asia Pacific High Power GaN Devices Revenue (million), by Types 2025 & 2033
- Figure 56: Asia Pacific High Power GaN Devices Volume (K), by Types 2025 & 2033
- Figure 57: Asia Pacific High Power GaN Devices Revenue Share (%), by Types 2025 & 2033
- Figure 58: Asia Pacific High Power GaN Devices Volume Share (%), by Types 2025 & 2033
- Figure 59: Asia Pacific High Power GaN Devices Revenue (million), by Country 2025 & 2033
- Figure 60: Asia Pacific High Power GaN Devices Volume (K), by Country 2025 & 2033
- Figure 61: Asia Pacific High Power GaN Devices Revenue Share (%), by Country 2025 & 2033
- Figure 62: Asia Pacific High Power GaN Devices Volume Share (%), by Country 2025 & 2033
List of Tables
- Table 1: Global High Power GaN Devices Revenue million Forecast, by Application 2020 & 2033
- Table 2: Global High Power GaN Devices Volume K Forecast, by Application 2020 & 2033
- Table 3: Global High Power GaN Devices Revenue million Forecast, by Types 2020 & 2033
- Table 4: Global High Power GaN Devices Volume K Forecast, by Types 2020 & 2033
- Table 5: Global High Power GaN Devices Revenue million Forecast, by Region 2020 & 2033
- Table 6: Global High Power GaN Devices Volume K Forecast, by Region 2020 & 2033
- Table 7: Global High Power GaN Devices Revenue million Forecast, by Application 2020 & 2033
- Table 8: Global High Power GaN Devices Volume K Forecast, by Application 2020 & 2033
- Table 9: Global High Power GaN Devices Revenue million Forecast, by Types 2020 & 2033
- Table 10: Global High Power GaN Devices Volume K Forecast, by Types 2020 & 2033
- Table 11: Global High Power GaN Devices Revenue million Forecast, by Country 2020 & 2033
- Table 12: Global High Power GaN Devices Volume K Forecast, by Country 2020 & 2033
- Table 13: United States High Power GaN Devices Revenue (million) Forecast, by Application 2020 & 2033
- Table 14: United States High Power GaN Devices Volume (K) Forecast, by Application 2020 & 2033
- Table 15: Canada High Power GaN Devices Revenue (million) Forecast, by Application 2020 & 2033
- Table 16: Canada High Power GaN Devices Volume (K) Forecast, by Application 2020 & 2033
- Table 17: Mexico High Power GaN Devices Revenue (million) Forecast, by Application 2020 & 2033
- Table 18: Mexico High Power GaN Devices Volume (K) Forecast, by Application 2020 & 2033
- Table 19: Global High Power GaN Devices Revenue million Forecast, by Application 2020 & 2033
- Table 20: Global High Power GaN Devices Volume K Forecast, by Application 2020 & 2033
- Table 21: Global High Power GaN Devices Revenue million Forecast, by Types 2020 & 2033
- Table 22: Global High Power GaN Devices Volume K Forecast, by Types 2020 & 2033
- Table 23: Global High Power GaN Devices Revenue million Forecast, by Country 2020 & 2033
- Table 24: Global High Power GaN Devices Volume K Forecast, by Country 2020 & 2033
- Table 25: Brazil High Power GaN Devices Revenue (million) Forecast, by Application 2020 & 2033
- Table 26: Brazil High Power GaN Devices Volume (K) Forecast, by Application 2020 & 2033
- Table 27: Argentina High Power GaN Devices Revenue (million) Forecast, by Application 2020 & 2033
- Table 28: Argentina High Power GaN Devices Volume (K) Forecast, by Application 2020 & 2033
- Table 29: Rest of South America High Power GaN Devices Revenue (million) Forecast, by Application 2020 & 2033
- Table 30: Rest of South America High Power GaN Devices Volume (K) Forecast, by Application 2020 & 2033
- Table 31: Global High Power GaN Devices Revenue million Forecast, by Application 2020 & 2033
- Table 32: Global High Power GaN Devices Volume K Forecast, by Application 2020 & 2033
- Table 33: Global High Power GaN Devices Revenue million Forecast, by Types 2020 & 2033
- Table 34: Global High Power GaN Devices Volume K Forecast, by Types 2020 & 2033
- Table 35: Global High Power GaN Devices Revenue million Forecast, by Country 2020 & 2033
- Table 36: Global High Power GaN Devices Volume K Forecast, by Country 2020 & 2033
- Table 37: United Kingdom High Power GaN Devices Revenue (million) Forecast, by Application 2020 & 2033
- Table 38: United Kingdom High Power GaN Devices Volume (K) Forecast, by Application 2020 & 2033
- Table 39: Germany High Power GaN Devices Revenue (million) Forecast, by Application 2020 & 2033
- Table 40: Germany High Power GaN Devices Volume (K) Forecast, by Application 2020 & 2033
- Table 41: France High Power GaN Devices Revenue (million) Forecast, by Application 2020 & 2033
- Table 42: France High Power GaN Devices Volume (K) Forecast, by Application 2020 & 2033
- Table 43: Italy High Power GaN Devices Revenue (million) Forecast, by Application 2020 & 2033
- Table 44: Italy High Power GaN Devices Volume (K) Forecast, by Application 2020 & 2033
- Table 45: Spain High Power GaN Devices Revenue (million) Forecast, by Application 2020 & 2033
- Table 46: Spain High Power GaN Devices Volume (K) Forecast, by Application 2020 & 2033
- Table 47: Russia High Power GaN Devices Revenue (million) Forecast, by Application 2020 & 2033
- Table 48: Russia High Power GaN Devices Volume (K) Forecast, by Application 2020 & 2033
- Table 49: Benelux High Power GaN Devices Revenue (million) Forecast, by Application 2020 & 2033
- Table 50: Benelux High Power GaN Devices Volume (K) Forecast, by Application 2020 & 2033
- Table 51: Nordics High Power GaN Devices Revenue (million) Forecast, by Application 2020 & 2033
- Table 52: Nordics High Power GaN Devices Volume (K) Forecast, by Application 2020 & 2033
- Table 53: Rest of Europe High Power GaN Devices Revenue (million) Forecast, by Application 2020 & 2033
- Table 54: Rest of Europe High Power GaN Devices Volume (K) Forecast, by Application 2020 & 2033
- Table 55: Global High Power GaN Devices Revenue million Forecast, by Application 2020 & 2033
- Table 56: Global High Power GaN Devices Volume K Forecast, by Application 2020 & 2033
- Table 57: Global High Power GaN Devices Revenue million Forecast, by Types 2020 & 2033
- Table 58: Global High Power GaN Devices Volume K Forecast, by Types 2020 & 2033
- Table 59: Global High Power GaN Devices Revenue million Forecast, by Country 2020 & 2033
- Table 60: Global High Power GaN Devices Volume K Forecast, by Country 2020 & 2033
- Table 61: Turkey High Power GaN Devices Revenue (million) Forecast, by Application 2020 & 2033
- Table 62: Turkey High Power GaN Devices Volume (K) Forecast, by Application 2020 & 2033
- Table 63: Israel High Power GaN Devices Revenue (million) Forecast, by Application 2020 & 2033
- Table 64: Israel High Power GaN Devices Volume (K) Forecast, by Application 2020 & 2033
- Table 65: GCC High Power GaN Devices Revenue (million) Forecast, by Application 2020 & 2033
- Table 66: GCC High Power GaN Devices Volume (K) Forecast, by Application 2020 & 2033
- Table 67: North Africa High Power GaN Devices Revenue (million) Forecast, by Application 2020 & 2033
- Table 68: North Africa High Power GaN Devices Volume (K) Forecast, by Application 2020 & 2033
- Table 69: South Africa High Power GaN Devices Revenue (million) Forecast, by Application 2020 & 2033
- Table 70: South Africa High Power GaN Devices Volume (K) Forecast, by Application 2020 & 2033
- Table 71: Rest of Middle East & Africa High Power GaN Devices Revenue (million) Forecast, by Application 2020 & 2033
- Table 72: Rest of Middle East & Africa High Power GaN Devices Volume (K) Forecast, by Application 2020 & 2033
- Table 73: Global High Power GaN Devices Revenue million Forecast, by Application 2020 & 2033
- Table 74: Global High Power GaN Devices Volume K Forecast, by Application 2020 & 2033
- Table 75: Global High Power GaN Devices Revenue million Forecast, by Types 2020 & 2033
- Table 76: Global High Power GaN Devices Volume K Forecast, by Types 2020 & 2033
- Table 77: Global High Power GaN Devices Revenue million Forecast, by Country 2020 & 2033
- Table 78: Global High Power GaN Devices Volume K Forecast, by Country 2020 & 2033
- Table 79: China High Power GaN Devices Revenue (million) Forecast, by Application 2020 & 2033
- Table 80: China High Power GaN Devices Volume (K) Forecast, by Application 2020 & 2033
- Table 81: India High Power GaN Devices Revenue (million) Forecast, by Application 2020 & 2033
- Table 82: India High Power GaN Devices Volume (K) Forecast, by Application 2020 & 2033
- Table 83: Japan High Power GaN Devices Revenue (million) Forecast, by Application 2020 & 2033
- Table 84: Japan High Power GaN Devices Volume (K) Forecast, by Application 2020 & 2033
- Table 85: South Korea High Power GaN Devices Revenue (million) Forecast, by Application 2020 & 2033
- Table 86: South Korea High Power GaN Devices Volume (K) Forecast, by Application 2020 & 2033
- Table 87: ASEAN High Power GaN Devices Revenue (million) Forecast, by Application 2020 & 2033
- Table 88: ASEAN High Power GaN Devices Volume (K) Forecast, by Application 2020 & 2033
- Table 89: Oceania High Power GaN Devices Revenue (million) Forecast, by Application 2020 & 2033
- Table 90: Oceania High Power GaN Devices Volume (K) Forecast, by Application 2020 & 2033
- Table 91: Rest of Asia Pacific High Power GaN Devices Revenue (million) Forecast, by Application 2020 & 2033
- Table 92: Rest of Asia Pacific High Power GaN Devices Volume (K) Forecast, by Application 2020 & 2033
Frequently Asked Questions
1. What is the projected Compound Annual Growth Rate (CAGR) of the High Power GaN Devices?
The projected CAGR is approximately 35.9%.
2. Which companies are prominent players in the High Power GaN Devices?
Key companies in the market include Infineon, Texas Instruments, Integra Technologies, Qorvo, Wolfspeed, Efficient Power Conversion, GaN Systems, Nexperia, STMicroelectronics, GOHM, Navitas, Power Integrations, Transphorm, Panasonic, GaNPower, Toshiba, Mitsubishi Electric.
3. What are the main segments of the High Power GaN Devices?
The market segments include Application, Types.
4. Can you provide details about the market size?
The market size is estimated to be USD 635.1 million as of 2022.
5. What are some drivers contributing to market growth?
N/A
6. What are the notable trends driving market growth?
N/A
7. Are there any restraints impacting market growth?
N/A
8. Can you provide examples of recent developments in the market?
N/A
9. What pricing options are available for accessing the report?
Pricing options include single-user, multi-user, and enterprise licenses priced at USD 3950.00, USD 5925.00, and USD 7900.00 respectively.
10. Is the market size provided in terms of value or volume?
The market size is provided in terms of value, measured in million and volume, measured in K.
11. Are there any specific market keywords associated with the report?
Yes, the market keyword associated with the report is "High Power GaN Devices," which aids in identifying and referencing the specific market segment covered.
12. How do I determine which pricing option suits my needs best?
The pricing options vary based on user requirements and access needs. Individual users may opt for single-user licenses, while businesses requiring broader access may choose multi-user or enterprise licenses for cost-effective access to the report.
13. Are there any additional resources or data provided in the High Power GaN Devices report?
While the report offers comprehensive insights, it's advisable to review the specific contents or supplementary materials provided to ascertain if additional resources or data are available.
14. How can I stay updated on further developments or reports in the High Power GaN Devices?
To stay informed about further developments, trends, and reports in the High Power GaN Devices, consider subscribing to industry newsletters, following relevant companies and organizations, or regularly checking reputable industry news sources and publications.
Methodology
Step 1 - Identification of Relevant Samples Size from Population Database


Step 2 - Approaches for Defining Global Market Size (Value, Volume* & Price*)

Note*: In applicable scenarios
Step 3 - Data Sources
Primary Research
- Web Analytics
- Survey Reports
- Research Institute
- Latest Research Reports
- Opinion Leaders
Secondary Research
- Annual Reports
- White Paper
- Latest Press Release
- Industry Association
- Paid Database
- Investor Presentations

Step 4 - Data Triangulation
Involves using different sources of information in order to increase the validity of a study
These sources are likely to be stakeholders in a program - participants, other researchers, program staff, other community members, and so on.
Then we put all data in single framework & apply various statistical tools to find out the dynamic on the market.
During the analysis stage, feedback from the stakeholder groups would be compared to determine areas of agreement as well as areas of divergence