


Key Insights
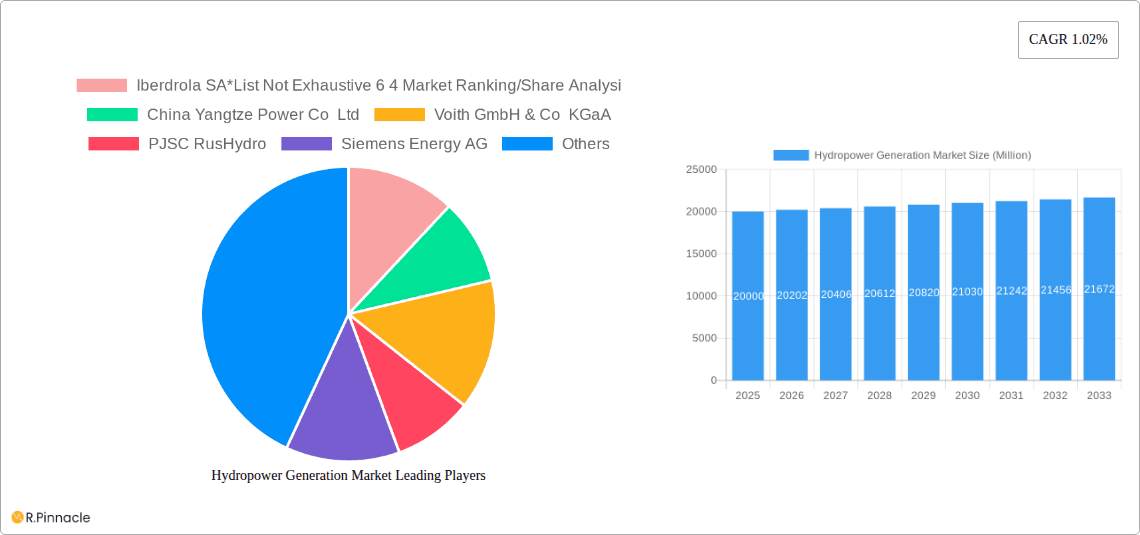
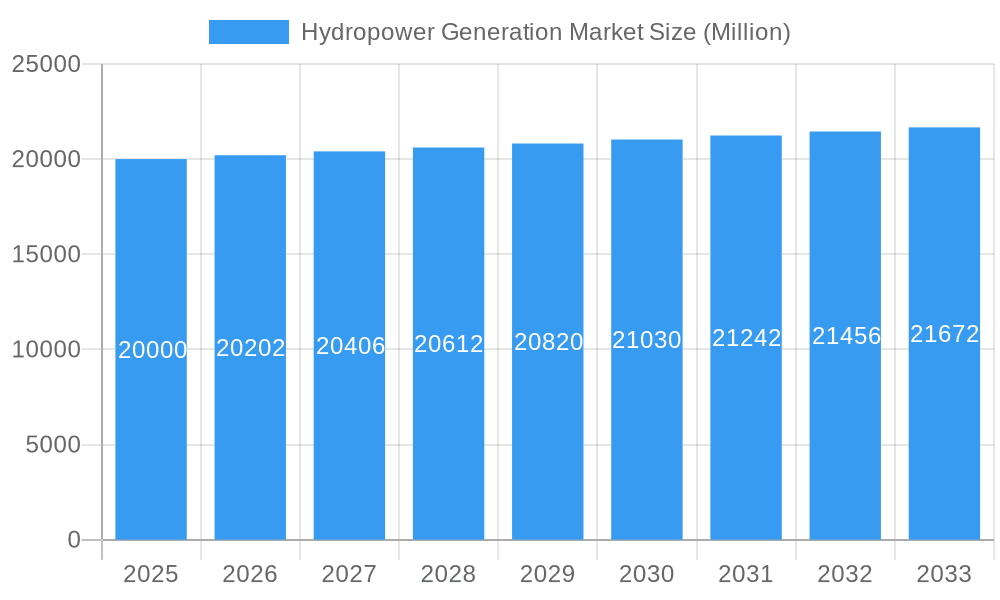
The global hydropower generation market, valued at $116.09 billion in 2025, is projected for robust expansion at a Compound Annual Growth Rate (CAGR) of 0.99% through 2033. This growth is propelled by escalating global energy demands, particularly in emerging economies, and a heightened focus on renewable energy to combat climate change. Favorable government policies supporting clean energy and sustainable development further stimulate market growth. Key market segments include large-scale hydropower (over 100 MW), small-scale hydropower (under 10 MW) for decentralized solutions, and medium-scale projects (10-100 MW) addressing varied energy needs. Leading companies such as Iberdrola SA, China Yangtze Power Co Ltd, and Voith GmbH & Co KGaA are instrumental in driving market evolution through innovation and strategic expansion, though regional market dynamics and penetration vary significantly.
Hydropower Generation Market Market Size (In Billion)

Notable regional disparities characterize market development. North America and Europe, with mature hydropower infrastructure, are expected to exhibit moderate growth. Conversely, the Asia-Pacific region, possessing substantial untapped hydro potential and rapid economic advancement, is poised for significant expansion. However, market growth faces constraints including the environmental impact of large dams, substantial upfront investment requirements, and regulatory complexities in project approvals. The industry is actively addressing these challenges through sustainable development practices, technological advancements enhancing efficiency and reducing environmental impact, and streamlined regulatory frameworks to improve project feasibility.
Hydropower Generation Market Company Market Share
Hydropower Generation Market Report: 2019-2033 Forecast
This comprehensive report provides an in-depth analysis of the global Hydropower Generation Market, offering invaluable insights for industry professionals, investors, and strategic decision-makers. Covering the period from 2019 to 2033, with 2025 as the base year, this report delivers a detailed understanding of market dynamics, growth drivers, and future trends. The study meticulously segments the market by size – Large Hydropower (Greater than 100 MW), Small Hydropower (Smaller than 10 MW), and Other Sizes (10-100 MW) – enabling a granular assessment of regional and segmental performances.
Hydropower Generation Market Structure & Innovation Trends
This section analyzes the competitive landscape, innovation drivers, and regulatory influences within the hydropower generation market. We examine market concentration, identifying key players and their market share. The analysis incorporates an assessment of mergers and acquisitions (M&A) activity, including deal values where available. The report also explores the impact of technological advancements, substitute products, and evolving end-user demographics.
- Market Concentration: The market exhibits a [xx]% concentration ratio, with the top six players, including Iberdrola SA, China Yangtze Power Co Ltd, Voith GmbH & Co KGaA, PJSC RusHydro, Siemens Energy AG, and GE Renewable Energy, holding a combined market share of approximately [xx]%.
- Innovation Drivers: Key innovation drivers include advancements in turbine technology, improved energy storage solutions, and the development of smart grids.
- Regulatory Frameworks: Government policies promoting renewable energy sources, coupled with stringent environmental regulations, significantly influence market growth.
- M&A Activity: Over the historical period (2019-2024), the total value of M&A transactions in the hydropower generation market was estimated at [xx] Million.
Hydropower Generation Market Dynamics & Trends
This section delves into the key market dynamics, including growth drivers, technological disruptions, and competitive landscapes. We explore the Compound Annual Growth Rate (CAGR) and market penetration across various segments. The impact of evolving consumer preferences and emerging technologies is also considered.
The global Hydropower Generation market is projected to experience a CAGR of [xx]% during the forecast period (2025-2033). This growth is driven by factors such as increasing demand for renewable energy, government initiatives supporting sustainable development, and continuous technological advancements in hydropower generation. However, challenges such as environmental concerns and the high initial capital investment required can impede market expansion. The market penetration of large hydropower projects is expected to remain higher compared to small and medium-sized projects due to economies of scale and established infrastructure. Competitive dynamics are characterized by both collaboration and competition among established players and emerging technology providers.
Dominant Regions & Segments in Hydropower Generation Market
This section identifies the leading regions and segments within the hydropower generation market. We analyze market dominance through a combination of quantitative and qualitative data.
Dominant Region: [Region Name] holds the largest market share, primarily due to [explain reasons, e.g., favorable government policies, abundant water resources, robust infrastructure].
Dominant Segment: The Large Hydropower (Greater than 100 MW) segment dominates the market due to:
- Higher energy output per unit.
- Economies of scale in project development and operation.
- Established infrastructure and expertise in this segment.
Other segments (Small Hydropower and Other Sizes) also exhibit promising growth, driven by factors such as decentralized energy generation and suitability for remote areas.
Hydropower Generation Market Product Innovations
Recent advancements in hydropower technology encompass more efficient turbines, improved energy storage systems, and the integration of smart grid technologies. These innovations enhance power generation capacity, reduce environmental impact, and increase overall system efficiency. This is leading to the development of more compact, modular, and adaptable hydropower systems. This trend caters to a broader range of applications, from large-scale power plants to small-scale, off-grid solutions.
Report Scope & Segmentation Analysis
This report segments the hydropower generation market based on size:
- Large Hydropower (Greater than 100 MW): This segment is projected to account for [xx]% of the market in 2025, growing to [xx]% by 2033. Competition is intense, with major players vying for large-scale projects.
- Small Hydropower (Smaller than 10 MW): This segment is experiencing steady growth due to its suitability for decentralized power generation. It is projected to reach [xx] Million by 2033.
- Other Sizes (10-100 MW): This segment offers a balance between scale and adaptability, attracting a mix of large and smaller players. The market size is projected to reach [xx] Million by 2033.
Key Drivers of Hydropower Generation Market Growth
Several factors drive the growth of the hydropower generation market. These include:
- Growing global demand for renewable energy sources to combat climate change.
- Government incentives and policies supporting renewable energy development.
- Technological advancements leading to higher efficiency and lower costs.
- Improved grid integration capabilities enhancing the reliability and stability of hydropower systems.
Challenges in the Hydropower Generation Market Sector
Despite its potential, the hydropower generation market faces several challenges:
- High initial capital investment requirements can deter potential investors.
- Environmental concerns related to dam construction and ecosystem impacts.
- Geographical limitations restrict the availability of suitable sites for hydropower projects.
- Regulatory hurdles and permitting processes can delay project implementation.
Emerging Opportunities in Hydropower Generation Market
Emerging opportunities within the hydropower generation market include:
- Development of pumped hydro storage solutions for grid stabilization and energy storage.
- Expansion into untapped markets with high hydropower potential.
- Integration of smart grid technologies for efficient energy management and distribution.
- The exploration of innovative technologies, like tidal and wave energy, that harness other forms of hydropower.
Leading Players in the Hydropower Generation Market Market
- Iberdrola SA
- China Yangtze Power Co Ltd
- Voith GmbH & Co KGaA
- PJSC RusHydro
- Siemens Energy AG
- GE Renewable Energy
- Andritz AG
- Électricité de France SA (EDF)
Key Developments in Hydropower Generation Market Industry
- May 2023: Satluj Jal Vidyut Nigam (SJVN) of India secures approval from Nepal to develop the 669 MW Lower Arun hydropower project, adding to its existing 900-MW Arun-III project (completion expected in 2024). This signifies expanding market activity in South Asia.
- December 2022: China completes the Baihetan hydropower plant, its second-largest facility, significantly boosting its renewable energy capacity and highlighting significant investment in large-scale hydropower.
Future Outlook for Hydropower Generation Market Market
The future outlook for the hydropower generation market is positive, driven by increasing global demand for renewable energy and technological advancements. Continued investment in research and development, coupled with supportive government policies, will pave the way for more efficient, sustainable, and cost-effective hydropower solutions. The market is poised for significant growth, particularly in regions with abundant water resources and supportive regulatory frameworks. Strategic partnerships between technology providers, energy companies, and government agencies will be crucial for realizing the full potential of hydropower in the coming years.
Hydropower Generation Market Segmentation
-
1. Size
- 1.1. Large Hydropower (Greater Than 100 MW)
- 1.2. Small Hydropower (Smaller Than 10 MW)
- 1.3. Other Sizes (10-100 MW)
Hydropower Generation Market Segmentation By Geography
-
1. North America
- 1.1. United States
- 1.2. Canada
- 1.3. Rest of North America
-
2. Europe
- 2.1. Germany
- 2.2. France
- 2.3. United Kingdom
- 2.4. Rest of Europe
-
3. Asia Pacific
- 3.1. China
- 3.2. India
- 3.3. Japan
- 3.4. South Korea
- 3.5. Rest of Asia Pacific
-
4. South America
- 4.1. Brazil
- 4.2. Argentina
- 4.3. Rest of South America
-
5. Middle East and Africa
- 5.1. Saudi Arabia
- 5.2. United Arab Emirates
- 5.3. South Africa
- 5.4. Rest of Middle East and Africa
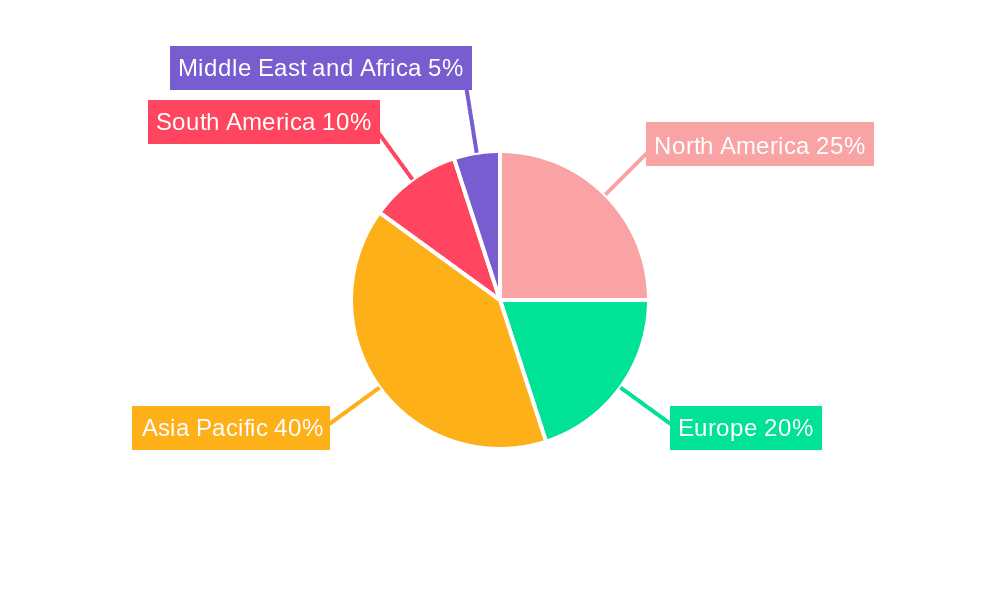
Hydropower Generation Market Regional Market Share
Geographic Coverage of Hydropower Generation Market
Hydropower Generation Market REPORT HIGHLIGHTS
| Aspects | Details |
|---|---|
| Study Period | 2020-2034 |
| Base Year | 2025 |
| Estimated Year | 2026 |
| Forecast Period | 2026-2034 |
| Historical Period | 2020-2025 |
| Growth Rate | CAGR of 0.99% from 2020-2034 |
| Segmentation |
|
Table of Contents
- 1. Introduction
- 1.1. Research Scope
- 1.2. Market Segmentation
- 1.3. Research Methodology
- 1.4. Definitions and Assumptions
- 2. Executive Summary
- 2.1. Introduction
- 3. Market Dynamics
- 3.1. Introduction
- 3.2. Market Drivers
- 3.2.1. 4.; Rising Demand for Reliable Electricity4.; Increasing Government Support for Hydropower Gneeration
- 3.3. Market Restrains
- 3.3.1. 4.; Negative Environmental Consequences of Hydropower Projects
- 3.4. Market Trends
- 3.4.1. The Large Hydropower (Greater Than 100 MW) Segment to Dominate the Market
- 4. Market Factor Analysis
- 4.1. Porters Five Forces
- 4.2. Supply/Value Chain
- 4.3. PESTEL analysis
- 4.4. Market Entropy
- 4.5. Patent/Trademark Analysis
- 5. Global Hydropower Generation Market Analysis, Insights and Forecast, 2020-2032
- 5.1. Market Analysis, Insights and Forecast - by Size
- 5.1.1. Large Hydropower (Greater Than 100 MW)
- 5.1.2. Small Hydropower (Smaller Than 10 MW)
- 5.1.3. Other Sizes (10-100 MW)
- 5.2. Market Analysis, Insights and Forecast - by Region
- 5.2.1. North America
- 5.2.2. Europe
- 5.2.3. Asia Pacific
- 5.2.4. South America
- 5.2.5. Middle East and Africa
- 5.1. Market Analysis, Insights and Forecast - by Size
- 6. North America Hydropower Generation Market Analysis, Insights and Forecast, 2020-2032
- 6.1. Market Analysis, Insights and Forecast - by Size
- 6.1.1. Large Hydropower (Greater Than 100 MW)
- 6.1.2. Small Hydropower (Smaller Than 10 MW)
- 6.1.3. Other Sizes (10-100 MW)
- 6.1. Market Analysis, Insights and Forecast - by Size
- 7. Europe Hydropower Generation Market Analysis, Insights and Forecast, 2020-2032
- 7.1. Market Analysis, Insights and Forecast - by Size
- 7.1.1. Large Hydropower (Greater Than 100 MW)
- 7.1.2. Small Hydropower (Smaller Than 10 MW)
- 7.1.3. Other Sizes (10-100 MW)
- 7.1. Market Analysis, Insights and Forecast - by Size
- 8. Asia Pacific Hydropower Generation Market Analysis, Insights and Forecast, 2020-2032
- 8.1. Market Analysis, Insights and Forecast - by Size
- 8.1.1. Large Hydropower (Greater Than 100 MW)
- 8.1.2. Small Hydropower (Smaller Than 10 MW)
- 8.1.3. Other Sizes (10-100 MW)
- 8.1. Market Analysis, Insights and Forecast - by Size
- 9. South America Hydropower Generation Market Analysis, Insights and Forecast, 2020-2032
- 9.1. Market Analysis, Insights and Forecast - by Size
- 9.1.1. Large Hydropower (Greater Than 100 MW)
- 9.1.2. Small Hydropower (Smaller Than 10 MW)
- 9.1.3. Other Sizes (10-100 MW)
- 9.1. Market Analysis, Insights and Forecast - by Size
- 10. Middle East and Africa Hydropower Generation Market Analysis, Insights and Forecast, 2020-2032
- 10.1. Market Analysis, Insights and Forecast - by Size
- 10.1.1. Large Hydropower (Greater Than 100 MW)
- 10.1.2. Small Hydropower (Smaller Than 10 MW)
- 10.1.3. Other Sizes (10-100 MW)
- 10.1. Market Analysis, Insights and Forecast - by Size
- 11. Competitive Analysis
- 11.1. Global Market Share Analysis 2025
- 11.2. Company Profiles
- 11.2.1 Iberdrola SA*List Not Exhaustive 6 4 Market Ranking/Share Analysi
- 11.2.1.1. Overview
- 11.2.1.2. Products
- 11.2.1.3. SWOT Analysis
- 11.2.1.4. Recent Developments
- 11.2.1.5. Financials (Based on Availability)
- 11.2.2 China Yangtze Power Co Ltd
- 11.2.2.1. Overview
- 11.2.2.2. Products
- 11.2.2.3. SWOT Analysis
- 11.2.2.4. Recent Developments
- 11.2.2.5. Financials (Based on Availability)
- 11.2.3 Voith GmbH & Co KGaA
- 11.2.3.1. Overview
- 11.2.3.2. Products
- 11.2.3.3. SWOT Analysis
- 11.2.3.4. Recent Developments
- 11.2.3.5. Financials (Based on Availability)
- 11.2.4 PJSC RusHydro
- 11.2.4.1. Overview
- 11.2.4.2. Products
- 11.2.4.3. SWOT Analysis
- 11.2.4.4. Recent Developments
- 11.2.4.5. Financials (Based on Availability)
- 11.2.5 Siemens Energy AG
- 11.2.5.1. Overview
- 11.2.5.2. Products
- 11.2.5.3. SWOT Analysis
- 11.2.5.4. Recent Developments
- 11.2.5.5. Financials (Based on Availability)
- 11.2.6 GE Renewable Energy
- 11.2.6.1. Overview
- 11.2.6.2. Products
- 11.2.6.3. SWOT Analysis
- 11.2.6.4. Recent Developments
- 11.2.6.5. Financials (Based on Availability)
- 11.2.7 Andritz AG
- 11.2.7.1. Overview
- 11.2.7.2. Products
- 11.2.7.3. SWOT Analysis
- 11.2.7.4. Recent Developments
- 11.2.7.5. Financials (Based on Availability)
- 11.2.8 Électricité de France SA (EDF)
- 11.2.8.1. Overview
- 11.2.8.2. Products
- 11.2.8.3. SWOT Analysis
- 11.2.8.4. Recent Developments
- 11.2.8.5. Financials (Based on Availability)
- 11.2.1 Iberdrola SA*List Not Exhaustive 6 4 Market Ranking/Share Analysi
List of Figures
- Figure 1: Global Hydropower Generation Market Revenue Breakdown (billion, %) by Region 2025 & 2033
- Figure 2: Global Hydropower Generation Market Volume Breakdown (terawatt, %) by Region 2025 & 2033
- Figure 3: North America Hydropower Generation Market Revenue (billion), by Size 2025 & 2033
- Figure 4: North America Hydropower Generation Market Volume (terawatt), by Size 2025 & 2033
- Figure 5: North America Hydropower Generation Market Revenue Share (%), by Size 2025 & 2033
- Figure 6: North America Hydropower Generation Market Volume Share (%), by Size 2025 & 2033
- Figure 7: North America Hydropower Generation Market Revenue (billion), by Country 2025 & 2033
- Figure 8: North America Hydropower Generation Market Volume (terawatt), by Country 2025 & 2033
- Figure 9: North America Hydropower Generation Market Revenue Share (%), by Country 2025 & 2033
- Figure 10: North America Hydropower Generation Market Volume Share (%), by Country 2025 & 2033
- Figure 11: Europe Hydropower Generation Market Revenue (billion), by Size 2025 & 2033
- Figure 12: Europe Hydropower Generation Market Volume (terawatt), by Size 2025 & 2033
- Figure 13: Europe Hydropower Generation Market Revenue Share (%), by Size 2025 & 2033
- Figure 14: Europe Hydropower Generation Market Volume Share (%), by Size 2025 & 2033
- Figure 15: Europe Hydropower Generation Market Revenue (billion), by Country 2025 & 2033
- Figure 16: Europe Hydropower Generation Market Volume (terawatt), by Country 2025 & 2033
- Figure 17: Europe Hydropower Generation Market Revenue Share (%), by Country 2025 & 2033
- Figure 18: Europe Hydropower Generation Market Volume Share (%), by Country 2025 & 2033
- Figure 19: Asia Pacific Hydropower Generation Market Revenue (billion), by Size 2025 & 2033
- Figure 20: Asia Pacific Hydropower Generation Market Volume (terawatt), by Size 2025 & 2033
- Figure 21: Asia Pacific Hydropower Generation Market Revenue Share (%), by Size 2025 & 2033
- Figure 22: Asia Pacific Hydropower Generation Market Volume Share (%), by Size 2025 & 2033
- Figure 23: Asia Pacific Hydropower Generation Market Revenue (billion), by Country 2025 & 2033
- Figure 24: Asia Pacific Hydropower Generation Market Volume (terawatt), by Country 2025 & 2033
- Figure 25: Asia Pacific Hydropower Generation Market Revenue Share (%), by Country 2025 & 2033
- Figure 26: Asia Pacific Hydropower Generation Market Volume Share (%), by Country 2025 & 2033
- Figure 27: South America Hydropower Generation Market Revenue (billion), by Size 2025 & 2033
- Figure 28: South America Hydropower Generation Market Volume (terawatt), by Size 2025 & 2033
- Figure 29: South America Hydropower Generation Market Revenue Share (%), by Size 2025 & 2033
- Figure 30: South America Hydropower Generation Market Volume Share (%), by Size 2025 & 2033
- Figure 31: South America Hydropower Generation Market Revenue (billion), by Country 2025 & 2033
- Figure 32: South America Hydropower Generation Market Volume (terawatt), by Country 2025 & 2033
- Figure 33: South America Hydropower Generation Market Revenue Share (%), by Country 2025 & 2033
- Figure 34: South America Hydropower Generation Market Volume Share (%), by Country 2025 & 2033
- Figure 35: Middle East and Africa Hydropower Generation Market Revenue (billion), by Size 2025 & 2033
- Figure 36: Middle East and Africa Hydropower Generation Market Volume (terawatt), by Size 2025 & 2033
- Figure 37: Middle East and Africa Hydropower Generation Market Revenue Share (%), by Size 2025 & 2033
- Figure 38: Middle East and Africa Hydropower Generation Market Volume Share (%), by Size 2025 & 2033
- Figure 39: Middle East and Africa Hydropower Generation Market Revenue (billion), by Country 2025 & 2033
- Figure 40: Middle East and Africa Hydropower Generation Market Volume (terawatt), by Country 2025 & 2033
- Figure 41: Middle East and Africa Hydropower Generation Market Revenue Share (%), by Country 2025 & 2033
- Figure 42: Middle East and Africa Hydropower Generation Market Volume Share (%), by Country 2025 & 2033
List of Tables
- Table 1: Global Hydropower Generation Market Revenue billion Forecast, by Size 2020 & 2033
- Table 2: Global Hydropower Generation Market Volume terawatt Forecast, by Size 2020 & 2033
- Table 3: Global Hydropower Generation Market Revenue billion Forecast, by Region 2020 & 2033
- Table 4: Global Hydropower Generation Market Volume terawatt Forecast, by Region 2020 & 2033
- Table 5: Global Hydropower Generation Market Revenue billion Forecast, by Size 2020 & 2033
- Table 6: Global Hydropower Generation Market Volume terawatt Forecast, by Size 2020 & 2033
- Table 7: Global Hydropower Generation Market Revenue billion Forecast, by Country 2020 & 2033
- Table 8: Global Hydropower Generation Market Volume terawatt Forecast, by Country 2020 & 2033
- Table 9: United States Hydropower Generation Market Revenue (billion) Forecast, by Application 2020 & 2033
- Table 10: United States Hydropower Generation Market Volume (terawatt) Forecast, by Application 2020 & 2033
- Table 11: Canada Hydropower Generation Market Revenue (billion) Forecast, by Application 2020 & 2033
- Table 12: Canada Hydropower Generation Market Volume (terawatt) Forecast, by Application 2020 & 2033
- Table 13: Rest of North America Hydropower Generation Market Revenue (billion) Forecast, by Application 2020 & 2033
- Table 14: Rest of North America Hydropower Generation Market Volume (terawatt) Forecast, by Application 2020 & 2033
- Table 15: Global Hydropower Generation Market Revenue billion Forecast, by Size 2020 & 2033
- Table 16: Global Hydropower Generation Market Volume terawatt Forecast, by Size 2020 & 2033
- Table 17: Global Hydropower Generation Market Revenue billion Forecast, by Country 2020 & 2033
- Table 18: Global Hydropower Generation Market Volume terawatt Forecast, by Country 2020 & 2033
- Table 19: Germany Hydropower Generation Market Revenue (billion) Forecast, by Application 2020 & 2033
- Table 20: Germany Hydropower Generation Market Volume (terawatt) Forecast, by Application 2020 & 2033
- Table 21: France Hydropower Generation Market Revenue (billion) Forecast, by Application 2020 & 2033
- Table 22: France Hydropower Generation Market Volume (terawatt) Forecast, by Application 2020 & 2033
- Table 23: United Kingdom Hydropower Generation Market Revenue (billion) Forecast, by Application 2020 & 2033
- Table 24: United Kingdom Hydropower Generation Market Volume (terawatt) Forecast, by Application 2020 & 2033
- Table 25: Rest of Europe Hydropower Generation Market Revenue (billion) Forecast, by Application 2020 & 2033
- Table 26: Rest of Europe Hydropower Generation Market Volume (terawatt) Forecast, by Application 2020 & 2033
- Table 27: Global Hydropower Generation Market Revenue billion Forecast, by Size 2020 & 2033
- Table 28: Global Hydropower Generation Market Volume terawatt Forecast, by Size 2020 & 2033
- Table 29: Global Hydropower Generation Market Revenue billion Forecast, by Country 2020 & 2033
- Table 30: Global Hydropower Generation Market Volume terawatt Forecast, by Country 2020 & 2033
- Table 31: China Hydropower Generation Market Revenue (billion) Forecast, by Application 2020 & 2033
- Table 32: China Hydropower Generation Market Volume (terawatt) Forecast, by Application 2020 & 2033
- Table 33: India Hydropower Generation Market Revenue (billion) Forecast, by Application 2020 & 2033
- Table 34: India Hydropower Generation Market Volume (terawatt) Forecast, by Application 2020 & 2033
- Table 35: Japan Hydropower Generation Market Revenue (billion) Forecast, by Application 2020 & 2033
- Table 36: Japan Hydropower Generation Market Volume (terawatt) Forecast, by Application 2020 & 2033
- Table 37: South Korea Hydropower Generation Market Revenue (billion) Forecast, by Application 2020 & 2033
- Table 38: South Korea Hydropower Generation Market Volume (terawatt) Forecast, by Application 2020 & 2033
- Table 39: Rest of Asia Pacific Hydropower Generation Market Revenue (billion) Forecast, by Application 2020 & 2033
- Table 40: Rest of Asia Pacific Hydropower Generation Market Volume (terawatt) Forecast, by Application 2020 & 2033
- Table 41: Global Hydropower Generation Market Revenue billion Forecast, by Size 2020 & 2033
- Table 42: Global Hydropower Generation Market Volume terawatt Forecast, by Size 2020 & 2033
- Table 43: Global Hydropower Generation Market Revenue billion Forecast, by Country 2020 & 2033
- Table 44: Global Hydropower Generation Market Volume terawatt Forecast, by Country 2020 & 2033
- Table 45: Brazil Hydropower Generation Market Revenue (billion) Forecast, by Application 2020 & 2033
- Table 46: Brazil Hydropower Generation Market Volume (terawatt) Forecast, by Application 2020 & 2033
- Table 47: Argentina Hydropower Generation Market Revenue (billion) Forecast, by Application 2020 & 2033
- Table 48: Argentina Hydropower Generation Market Volume (terawatt) Forecast, by Application 2020 & 2033
- Table 49: Rest of South America Hydropower Generation Market Revenue (billion) Forecast, by Application 2020 & 2033
- Table 50: Rest of South America Hydropower Generation Market Volume (terawatt) Forecast, by Application 2020 & 2033
- Table 51: Global Hydropower Generation Market Revenue billion Forecast, by Size 2020 & 2033
- Table 52: Global Hydropower Generation Market Volume terawatt Forecast, by Size 2020 & 2033
- Table 53: Global Hydropower Generation Market Revenue billion Forecast, by Country 2020 & 2033
- Table 54: Global Hydropower Generation Market Volume terawatt Forecast, by Country 2020 & 2033
- Table 55: Saudi Arabia Hydropower Generation Market Revenue (billion) Forecast, by Application 2020 & 2033
- Table 56: Saudi Arabia Hydropower Generation Market Volume (terawatt) Forecast, by Application 2020 & 2033
- Table 57: United Arab Emirates Hydropower Generation Market Revenue (billion) Forecast, by Application 2020 & 2033
- Table 58: United Arab Emirates Hydropower Generation Market Volume (terawatt) Forecast, by Application 2020 & 2033
- Table 59: South Africa Hydropower Generation Market Revenue (billion) Forecast, by Application 2020 & 2033
- Table 60: South Africa Hydropower Generation Market Volume (terawatt) Forecast, by Application 2020 & 2033
- Table 61: Rest of Middle East and Africa Hydropower Generation Market Revenue (billion) Forecast, by Application 2020 & 2033
- Table 62: Rest of Middle East and Africa Hydropower Generation Market Volume (terawatt) Forecast, by Application 2020 & 2033
Frequently Asked Questions
1. What is the projected Compound Annual Growth Rate (CAGR) of the Hydropower Generation Market?
The projected CAGR is approximately 0.99%.
2. Which companies are prominent players in the Hydropower Generation Market?
Key companies in the market include Iberdrola SA*List Not Exhaustive 6 4 Market Ranking/Share Analysi, China Yangtze Power Co Ltd, Voith GmbH & Co KGaA, PJSC RusHydro, Siemens Energy AG, GE Renewable Energy, Andritz AG, Électricité de France SA (EDF).
3. What are the main segments of the Hydropower Generation Market?
The market segments include Size.
4. Can you provide details about the market size?
The market size is estimated to be USD 116.09 billion as of 2022.
5. What are some drivers contributing to market growth?
4.; Rising Demand for Reliable Electricity4.; Increasing Government Support for Hydropower Gneeration.
6. What are the notable trends driving market growth?
The Large Hydropower (Greater Than 100 MW) Segment to Dominate the Market.
7. Are there any restraints impacting market growth?
4.; Negative Environmental Consequences of Hydropower Projects.
8. Can you provide examples of recent developments in the market?
May 2023: Satluj Jal Vidyut Nigam (SJVN) of India has been granted permission by Nepal to develop a second hydropower project in the country. Currently, the firm is developing a 900-MW Arun-III hydroelectric project located on the Arun River in Eastern Nepal. This project is scheduled to be completed in 2024. Investment Board Nepal (IBN) has approved to build of the 669 MW Lower Arun hydropower project in eastern Nepal.
9. What pricing options are available for accessing the report?
Pricing options include single-user, multi-user, and enterprise licenses priced at USD 4750, USD 5250, and USD 8750 respectively.
10. Is the market size provided in terms of value or volume?
The market size is provided in terms of value, measured in billion and volume, measured in terawatt.
11. Are there any specific market keywords associated with the report?
Yes, the market keyword associated with the report is "Hydropower Generation Market," which aids in identifying and referencing the specific market segment covered.
12. How do I determine which pricing option suits my needs best?
The pricing options vary based on user requirements and access needs. Individual users may opt for single-user licenses, while businesses requiring broader access may choose multi-user or enterprise licenses for cost-effective access to the report.
13. Are there any additional resources or data provided in the Hydropower Generation Market report?
While the report offers comprehensive insights, it's advisable to review the specific contents or supplementary materials provided to ascertain if additional resources or data are available.
14. How can I stay updated on further developments or reports in the Hydropower Generation Market?
To stay informed about further developments, trends, and reports in the Hydropower Generation Market, consider subscribing to industry newsletters, following relevant companies and organizations, or regularly checking reputable industry news sources and publications.
Methodology
Step 1 - Identification of Relevant Samples Size from Population Database


Step 2 - Approaches for Defining Global Market Size (Value, Volume* & Price*)

Note*: In applicable scenarios
Step 3 - Data Sources
Primary Research
- Web Analytics
- Survey Reports
- Research Institute
- Latest Research Reports
- Opinion Leaders
Secondary Research
- Annual Reports
- White Paper
- Latest Press Release
- Industry Association
- Paid Database
- Investor Presentations

Step 4 - Data Triangulation
Involves using different sources of information in order to increase the validity of a study
These sources are likely to be stakeholders in a program - participants, other researchers, program staff, other community members, and so on.
Then we put all data in single framework & apply various statistical tools to find out the dynamic on the market.
During the analysis stage, feedback from the stakeholder groups would be compared to determine areas of agreement as well as areas of divergence