

Key Insights
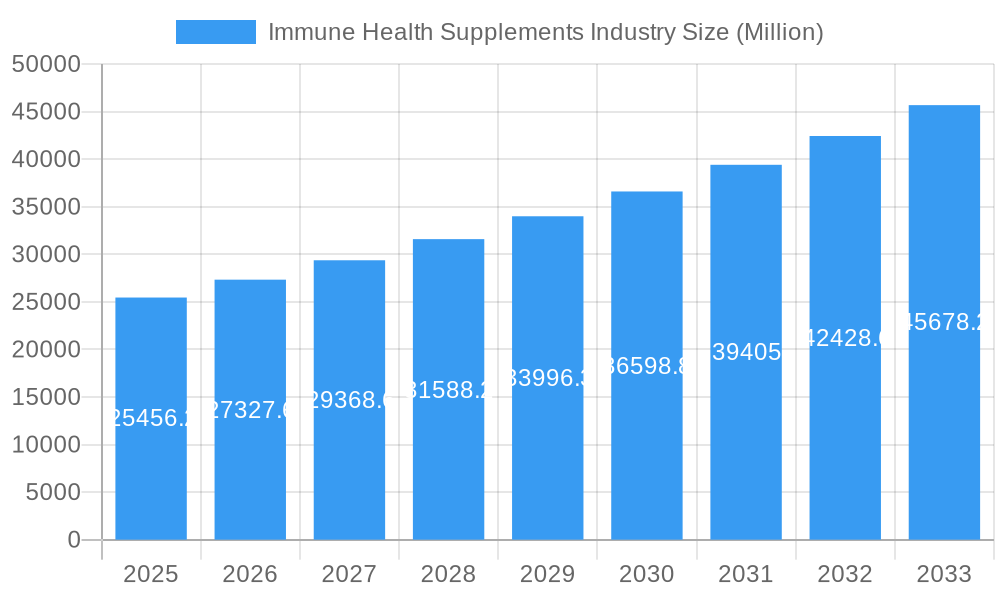
The global immune health supplements market, valued at $25,456.2 million in 2025, is projected to experience robust growth, driven by increasing consumer awareness of immunity and the preventative benefits of supplements. Rising prevalence of chronic diseases, coupled with a growing aging population susceptible to weakened immune systems, fuels demand for products like vitamins, minerals, probiotics, and herbal extracts. The market's segmentation reflects diverse consumer preferences, with soft gels and tablets maintaining popularity alongside the increasing adoption of powder and liquid formats for convenience. Online retail channels are experiencing rapid expansion, supplementing established distribution networks like supermarkets, pharmacies, and convenience stores. Key players like Bayer AG, Amway Corp, and DSM are actively involved in innovation and product diversification to capture market share. Geographic variations exist, with North America and Europe currently dominating the market due to higher disposable incomes and greater health consciousness. However, rapid growth is anticipated in the Asia-Pacific region driven by rising middle-class populations and increased awareness of health and wellness.
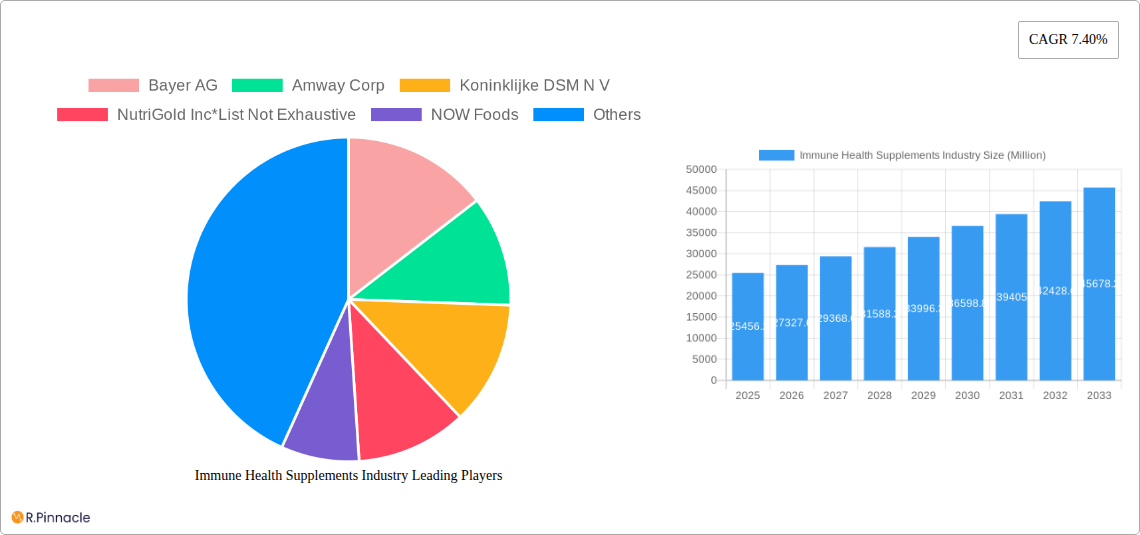
Immune Health Supplements Industry Market Size (In Billion)
The market's continued expansion is expected to be influenced by several factors. Technological advancements leading to improved supplement formulations and efficacy contribute significantly. Moreover, increasing government regulations focused on supplement quality and safety enhance consumer confidence. However, challenges remain, such as the potential for inconsistent quality among various brands and the need for greater consumer education to navigate the market effectively. The forecast period (2025-2033) anticipates a continuation of the positive trends, with the CAGR of 7.40% suggesting a substantial market expansion. Strategic partnerships between supplement manufacturers and healthcare providers are likely to play a pivotal role in further driving market growth and shaping future consumer behavior. Innovation in product delivery systems, such as personalized supplements and targeted immune support formulations, will also significantly influence market evolution over the next decade.
Immune Health Supplements Industry Company Market Share
Immune Health Supplements Industry Report: 2019-2033
This comprehensive report provides an in-depth analysis of the global Immune Health Supplements industry, offering valuable insights for industry professionals, investors, and strategic decision-makers. The report covers the period from 2019 to 2033, with a focus on the estimated year 2025 and a forecast period of 2025-2033. The market is valued at $XX Million in 2025 and is projected to reach $XX Million by 2033, exhibiting a CAGR of XX%. Key players analyzed include Bayer AG, Amway Corp, Koninklijke DSM N.V., NutriGold Inc, NOW Foods, Glanbia Plc, and The Himalayan Drug Company. This report is not exhaustive and may not include all market players.
Immune Health Supplements Industry Market Structure & Innovation Trends
The Immune Health Supplements market exhibits a moderately concentrated structure, with several major players holding significant market share. Bayer AG and Amway Corp are estimated to collectively control approximately XX% of the market in 2025. Innovation is driven by increasing consumer awareness of immune health, advancements in supplement formulation (e.g., targeted delivery systems), and the ongoing development of novel ingredients. Regulatory frameworks, varying across regions, significantly influence product development and market access. Competition from functional foods and beverages presents a key challenge, while mergers and acquisitions (M&A) activity, with deal values exceeding $XX Million in recent years, is reshaping the competitive landscape.
- Market Concentration: Moderately concentrated, with top 5 players holding XX% market share (2025 estimate).
- Innovation Drivers: Consumer awareness, advanced formulations, novel ingredients.
- Regulatory Frameworks: Vary across regions, impacting product approvals.
- Product Substitutes: Functional foods, beverages.
- M&A Activity: Significant activity with deal values exceeding $XX Million in recent years.
- End-User Demographics: Primarily adults aged 35-65, health-conscious individuals.
Immune Health Supplements Industry Market Dynamics & Trends
The Immune Health Supplements market is experiencing robust growth, fueled by several key factors. Rising prevalence of chronic diseases, increasing consumer health awareness, and growing demand for preventative healthcare are major drivers. Technological advancements, such as personalized nutrition and advanced extraction techniques, are further stimulating market expansion. Shifting consumer preferences towards natural and organic products are creating new opportunities, while intense competition, both from established players and new entrants, is shaping market dynamics. The market penetration rate for immune health supplements is estimated at XX% in 2025, projected to rise to XX% by 2033.
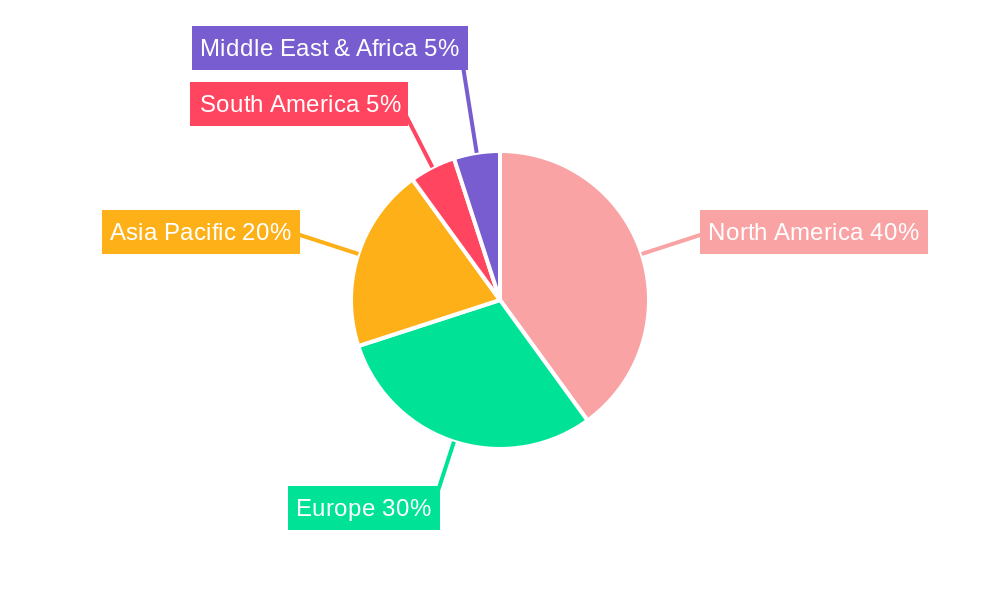
Dominant Regions & Segments in Immune Health Supplements Industry
North America continues to lead the immune health supplements market, propelled by robust consumer spending and a pronounced emphasis on proactive health management and preventative care. Within product categories, Vitamins & Minerals remain the cornerstone, with Probiotics and Herbal/Botanical Extracts also demonstrating significant market presence. A notable trend is the escalating demand for plant-based supplements, aligning with growing consumer preferences for natural and sustainable options. In terms of delivery, Tablets and Soft Gels are the most favored formats, while online retail channels are experiencing exponential growth, reflecting evolving consumer purchasing habits.
- Key Market Drivers (North America): High disposable income, well-established healthcare infrastructure, stringent regulatory oversight, and a highly informed consumer base prioritizing health and wellness.
- Dominant Product Segment: Vitamins & Minerals continue to capture the largest market share due to their widespread recognition and perceived efficacy.
- Growing Source Preference: Plant-based ingredients are increasingly sought after, driven by ethical considerations and a perception of natural wellness benefits.
- Preferred Formats: Tablets and Soft Gels offer convenience and ease of consumption, making them the preferred choice for a majority of consumers.
- Key Distribution Channels: While Pharmacies & drug stores maintain a strong presence, Online retail is rapidly expanding, offering greater accessibility and a wider product selection.
Immune Health Supplements Industry Product Innovations
The landscape of immune health supplements is being reshaped by cutting-edge innovations focused on enhancing efficacy and user experience. This includes the development of sophisticated targeted delivery systems designed to optimize the bioavailability of active ingredients. Furthermore, the industry is witnessing a rise in customized supplement formulations that leverage individual genetic profiles and specific health needs, moving towards a more personalized approach to wellness. The incorporation of novel bioactive compounds with scientifically validated immune-modulating properties is also a key area of advancement. These innovations are strategically designed to address evolving consumer demands, boost product effectiveness, and secure a competitive edge. A parallel and increasingly important development is the emphasis on sustainability and ethically sourced ingredients, which is profoundly influencing product development strategies and brand positioning.
Report Scope & Segmentation Analysis
This comprehensive report offers an in-depth analysis of the Immune Health Supplements market, meticulously segmented across a range of critical parameters to provide actionable insights:
- By Product Type: A granular breakdown including Vitamins & Minerals, Herbal/Botanical Extracts, Amino Acids, Probiotics, and Omega-3 Fatty Acids. Each sub-segment is accompanied by detailed growth projections and current market size estimations.
- By Source: Analysis differentiating between Animal Based and Plant Based ingredients, with individual growth trajectories and market valuation for each.
- By Format: Detailed segmentation across Soft Gels, Tablets, Powder, and Liquid forms, providing specific growth forecasts and market size data for each format.
- By Distribution Channel: An exhaustive analysis of Supermarkets and Hypermarkets, Convenience Stores, Pharmacies & drug stores, Online Retail, and other emerging channels. Each channel segment includes projected growth rates and its current contribution to the overall market size.
Furthermore, the report delves into the competitive dynamics and market size specific to each analyzed segment, offering a holistic view of the industry's structure and future potential.
Key Drivers of Immune Health Supplements Industry Growth
The growth of the immune health supplements industry is driven by several interconnected factors: rising prevalence of chronic diseases necessitates proactive health management, increasing consumer awareness emphasizes preventative health measures, and growing disposable incomes in developing economies expands market access. Furthermore, technological advancements in supplement formulations improve efficacy and appeal.
Challenges in the Immune Health Supplements Industry Sector
The industry faces challenges including stringent regulatory requirements across different regions, inconsistent product quality and standardization across manufacturers, and intense competition within the market leading to price pressure. Supply chain disruptions, particularly related to raw material sourcing, can significantly impact production and profitability. The prevalence of misinformation and unsubstantiated claims also poses a significant hurdle.
Emerging Opportunities in Immune Health Supplements Industry
Significant growth avenues for the immune health supplements industry lie within the burgeoning field of personalized nutrition. Advancements in genomics and nutrigenomics are paving the way for the development of highly tailored supplement recommendations that align with an individual's unique biological makeup and health objectives. The strategic integration of technology, including telemedicine platforms and advanced wearable health trackers, presents enhanced opportunities for delivering personalized interventions and facilitating data-driven product development cycles. Moreover, strategic expansion into new geographical markets characterized by rising health consciousness and an increasing demand for wellness solutions offers substantial untapped potential.
Leading Players in the Immune Health Supplements Industry Market
- Bayer AG
- Amway Corp
- Koninklijke DSM N.V.
- NutriGold Inc.
- NOW Foods
- Glanbia Plc
- The Himalayan Drug Company
Key Developments in Immune Health Supplements Industry
- 2022 Q4: Bayer AG launched a new line of immune-boosting supplements.
- 2023 Q1: Amway Corp acquired a smaller supplement manufacturer, expanding its product portfolio.
- 2023 Q3: Koninklijke DSM N.V. invested in research and development of novel immune-supporting ingredients.
Future Outlook for Immune Health Supplements Industry Market
The immune health supplements market is poised for continued growth, driven by ongoing consumer demand for preventative healthcare solutions and a rapidly evolving understanding of the complex interplay between diet, lifestyle, and immunity. Strategic partnerships and investments in research and development will be crucial for market leadership, with a focus on personalized solutions and innovative product formulations.
Immune Health Supplements Industry Segmentation
-
1. Product Type
- 1.1. Vitamins & Minerals
- 1.2. Herbal/Botanical Extracts
- 1.3. Amino Acids
- 1.4. Probiotics
- 1.5. Omega-3 Fatty Acids
-
2. Source
- 2.1. Animal Based
- 2.2. Plant Based
-
3. Format
- 3.1. Soft Gels
- 3.2. Tablets
- 3.3. Powder
- 3.4. Liquid
-
4. Distribution Channel
- 4.1. Supermarkets and Hypermarkets
- 4.2. Convenience Stores
- 4.3. Pharmacies & drug stores
- 4.4. Online Retail
- 4.5. Others
Immune Health Supplements Industry Segmentation By Geography
-
1. North America
- 1.1. United States
- 1.2. Canada
- 1.3. Mexico
- 1.4. Rest of North America
-
2. Europe
- 2.1. United Kingdom
- 2.2. Germany
- 2.3. Spain
- 2.4. France
- 2.5. Italy
- 2.6. Russia
- 2.7. Rest of Europe
-
3. Asia Pacific
- 3.1. China
- 3.2. India
- 3.3. Japan
- 3.4. Australia
- 3.5. Rest of Asia Pacific
-
4. South America
- 4.1. Brazil
- 4.2. Argentina
- 4.3. Rest of South America
- 5. Middle East
-
6. South Africa
- 6.1. Saudi Arabia
- 6.2. Rest of Middle East
Immune Health Supplements Industry Regional Market Share
Geographic Coverage of Immune Health Supplements Industry
Immune Health Supplements Industry REPORT HIGHLIGHTS
| Aspects | Details |
|---|---|
| Study Period | 2020-2034 |
| Base Year | 2025 |
| Estimated Year | 2026 |
| Forecast Period | 2026-2034 |
| Historical Period | 2020-2025 |
| Growth Rate | CAGR of 7.40% from 2020-2034 |
| Segmentation |
|
Table of Contents
- 1. Introduction
- 1.1. Research Scope
- 1.2. Market Segmentation
- 1.3. Research Objective
- 1.4. Definitions and Assumptions
- 2. Executive Summary
- 2.1. Market Snapshot
- 3. Market Dynamics
- 3.1. Market Drivers
- 3.2. Market Restrains
- 3.3. Market Trends
- 3.4. Market Opportunities
- 4. Market Factor Analysis
- 4.1. Porters Five Forces
- 4.1.1. Bargaining Power of Suppliers
- 4.1.2. Bargaining Power of Buyers
- 4.1.3. Threat of New Entrants
- 4.1.4. Threat of Substitutes
- 4.1.5. Competitive Rivalry
- 4.2. PESTEL analysis
- 4.3. BCG Analysis
- 4.3.1. Stars (High Growth, High Market Share)
- 4.3.2. Cash Cows (Low Growth, High Market Share)
- 4.3.3. Question Mark (High Growth, Low Market Share)
- 4.3.4. Dogs (Low Growth, Low Market Share)
- 4.4. Ansoff Matrix Analysis
- 4.5. Supply Chain Analysis
- 4.6. Regulatory Landscape
- 4.7. Current Market Potential and Opportunity Assessment (TAM–SAM–SOM Framework)
- 4.8. PRI Analyst Note
- 4.1. Porters Five Forces
- 5. Market Analysis, Insights and Forecast 2021-2033
- 5.1. Market Analysis, Insights and Forecast - by Product Type
- 5.1.1. Vitamins & Minerals
- 5.1.2. Herbal/Botanical Extracts
- 5.1.3. Amino Acids
- 5.1.4. Probiotics
- 5.1.5. Omega-3 Fatty Acids
- 5.2. Market Analysis, Insights and Forecast - by Source
- 5.2.1. Animal Based
- 5.2.2. Plant Based
- 5.3. Market Analysis, Insights and Forecast - by Format
- 5.3.1. Soft Gels
- 5.3.2. Tablets
- 5.3.3. Powder
- 5.3.4. Liquid
- 5.4. Market Analysis, Insights and Forecast - by Distribution Channel
- 5.4.1. Supermarkets and Hypermarkets
- 5.4.2. Convenience Stores
- 5.4.3. Pharmacies & drug stores
- 5.4.4. Online Retail
- 5.4.5. Others
- 5.5. Market Analysis, Insights and Forecast - by Region
- 5.5.1. North America
- 5.5.2. Europe
- 5.5.3. Asia Pacific
- 5.5.4. South America
- 5.5.5. Middle East
- 5.5.6. South Africa
- 5.1. Market Analysis, Insights and Forecast - by Product Type
- 6. Global Immune Health Supplements Industry Analysis, Insights and Forecast, 2021-2033
- 6.1. Market Analysis, Insights and Forecast - by Product Type
- 6.1.1. Vitamins & Minerals
- 6.1.2. Herbal/Botanical Extracts
- 6.1.3. Amino Acids
- 6.1.4. Probiotics
- 6.1.5. Omega-3 Fatty Acids
- 6.2. Market Analysis, Insights and Forecast - by Source
- 6.2.1. Animal Based
- 6.2.2. Plant Based
- 6.3. Market Analysis, Insights and Forecast - by Format
- 6.3.1. Soft Gels
- 6.3.2. Tablets
- 6.3.3. Powder
- 6.3.4. Liquid
- 6.4. Market Analysis, Insights and Forecast - by Distribution Channel
- 6.4.1. Supermarkets and Hypermarkets
- 6.4.2. Convenience Stores
- 6.4.3. Pharmacies & drug stores
- 6.4.4. Online Retail
- 6.4.5. Others
- 6.1. Market Analysis, Insights and Forecast - by Product Type
- 7. North America Immune Health Supplements Industry Analysis, Insights and Forecast, 2020-2032
- 7.1. Market Analysis, Insights and Forecast - by Product Type
- 7.1.1. Vitamins & Minerals
- 7.1.2. Herbal/Botanical Extracts
- 7.1.3. Amino Acids
- 7.1.4. Probiotics
- 7.1.5. Omega-3 Fatty Acids
- 7.2. Market Analysis, Insights and Forecast - by Source
- 7.2.1. Animal Based
- 7.2.2. Plant Based
- 7.3. Market Analysis, Insights and Forecast - by Format
- 7.3.1. Soft Gels
- 7.3.2. Tablets
- 7.3.3. Powder
- 7.3.4. Liquid
- 7.4. Market Analysis, Insights and Forecast - by Distribution Channel
- 7.4.1. Supermarkets and Hypermarkets
- 7.4.2. Convenience Stores
- 7.4.3. Pharmacies & drug stores
- 7.4.4. Online Retail
- 7.4.5. Others
- 7.1. Market Analysis, Insights and Forecast - by Product Type
- 8. Europe Immune Health Supplements Industry Analysis, Insights and Forecast, 2020-2032
- 8.1. Market Analysis, Insights and Forecast - by Product Type
- 8.1.1. Vitamins & Minerals
- 8.1.2. Herbal/Botanical Extracts
- 8.1.3. Amino Acids
- 8.1.4. Probiotics
- 8.1.5. Omega-3 Fatty Acids
- 8.2. Market Analysis, Insights and Forecast - by Source
- 8.2.1. Animal Based
- 8.2.2. Plant Based
- 8.3. Market Analysis, Insights and Forecast - by Format
- 8.3.1. Soft Gels
- 8.3.2. Tablets
- 8.3.3. Powder
- 8.3.4. Liquid
- 8.4. Market Analysis, Insights and Forecast - by Distribution Channel
- 8.4.1. Supermarkets and Hypermarkets
- 8.4.2. Convenience Stores
- 8.4.3. Pharmacies & drug stores
- 8.4.4. Online Retail
- 8.4.5. Others
- 8.1. Market Analysis, Insights and Forecast - by Product Type
- 9. Asia Pacific Immune Health Supplements Industry Analysis, Insights and Forecast, 2020-2032
- 9.1. Market Analysis, Insights and Forecast - by Product Type
- 9.1.1. Vitamins & Minerals
- 9.1.2. Herbal/Botanical Extracts
- 9.1.3. Amino Acids
- 9.1.4. Probiotics
- 9.1.5. Omega-3 Fatty Acids
- 9.2. Market Analysis, Insights and Forecast - by Source
- 9.2.1. Animal Based
- 9.2.2. Plant Based
- 9.3. Market Analysis, Insights and Forecast - by Format
- 9.3.1. Soft Gels
- 9.3.2. Tablets
- 9.3.3. Powder
- 9.3.4. Liquid
- 9.4. Market Analysis, Insights and Forecast - by Distribution Channel
- 9.4.1. Supermarkets and Hypermarkets
- 9.4.2. Convenience Stores
- 9.4.3. Pharmacies & drug stores
- 9.4.4. Online Retail
- 9.4.5. Others
- 9.1. Market Analysis, Insights and Forecast - by Product Type
- 10. South America Immune Health Supplements Industry Analysis, Insights and Forecast, 2020-2032
- 10.1. Market Analysis, Insights and Forecast - by Product Type
- 10.1.1. Vitamins & Minerals
- 10.1.2. Herbal/Botanical Extracts
- 10.1.3. Amino Acids
- 10.1.4. Probiotics
- 10.1.5. Omega-3 Fatty Acids
- 10.2. Market Analysis, Insights and Forecast - by Source
- 10.2.1. Animal Based
- 10.2.2. Plant Based
- 10.3. Market Analysis, Insights and Forecast - by Format
- 10.3.1. Soft Gels
- 10.3.2. Tablets
- 10.3.3. Powder
- 10.3.4. Liquid
- 10.4. Market Analysis, Insights and Forecast - by Distribution Channel
- 10.4.1. Supermarkets and Hypermarkets
- 10.4.2. Convenience Stores
- 10.4.3. Pharmacies & drug stores
- 10.4.4. Online Retail
- 10.4.5. Others
- 10.1. Market Analysis, Insights and Forecast - by Product Type
- 11. Middle East Immune Health Supplements Industry Analysis, Insights and Forecast, 2020-2032
- 11.1. Market Analysis, Insights and Forecast - by Product Type
- 11.1.1. Vitamins & Minerals
- 11.1.2. Herbal/Botanical Extracts
- 11.1.3. Amino Acids
- 11.1.4. Probiotics
- 11.1.5. Omega-3 Fatty Acids
- 11.2. Market Analysis, Insights and Forecast - by Source
- 11.2.1. Animal Based
- 11.2.2. Plant Based
- 11.3. Market Analysis, Insights and Forecast - by Format
- 11.3.1. Soft Gels
- 11.3.2. Tablets
- 11.3.3. Powder
- 11.3.4. Liquid
- 11.4. Market Analysis, Insights and Forecast - by Distribution Channel
- 11.4.1. Supermarkets and Hypermarkets
- 11.4.2. Convenience Stores
- 11.4.3. Pharmacies & drug stores
- 11.4.4. Online Retail
- 11.4.5. Others
- 11.1. Market Analysis, Insights and Forecast - by Product Type
- 12. South Africa Immune Health Supplements Industry Analysis, Insights and Forecast, 2020-2032
- 12.1. Market Analysis, Insights and Forecast - by Product Type
- 12.1.1. Vitamins & Minerals
- 12.1.2. Herbal/Botanical Extracts
- 12.1.3. Amino Acids
- 12.1.4. Probiotics
- 12.1.5. Omega-3 Fatty Acids
- 12.2. Market Analysis, Insights and Forecast - by Source
- 12.2.1. Animal Based
- 12.2.2. Plant Based
- 12.3. Market Analysis, Insights and Forecast - by Format
- 12.3.1. Soft Gels
- 12.3.2. Tablets
- 12.3.3. Powder
- 12.3.4. Liquid
- 12.4. Market Analysis, Insights and Forecast - by Distribution Channel
- 12.4.1. Supermarkets and Hypermarkets
- 12.4.2. Convenience Stores
- 12.4.3. Pharmacies & drug stores
- 12.4.4. Online Retail
- 12.4.5. Others
- 12.1. Market Analysis, Insights and Forecast - by Product Type
- 13. Competitive Analysis
- 13.1. Company Profiles
- 13.1.1 Bayer AG
- 13.1.1.1. Company Overview
- 13.1.1.2. Products
- 13.1.1.3. Company Financials
- 13.1.1.4. SWOT Analysis
- 13.1.2 Amway Corp
- 13.1.2.1. Company Overview
- 13.1.2.2. Products
- 13.1.2.3. Company Financials
- 13.1.2.4. SWOT Analysis
- 13.1.3 Koninklijke DSM N V
- 13.1.3.1. Company Overview
- 13.1.3.2. Products
- 13.1.3.3. Company Financials
- 13.1.3.4. SWOT Analysis
- 13.1.4 NutriGold Inc*List Not Exhaustive
- 13.1.4.1. Company Overview
- 13.1.4.2. Products
- 13.1.4.3. Company Financials
- 13.1.4.4. SWOT Analysis
- 13.1.5 NOW Foods
- 13.1.5.1. Company Overview
- 13.1.5.2. Products
- 13.1.5.3. Company Financials
- 13.1.5.4. SWOT Analysis
- 13.1.6 Glanbia Plc
- 13.1.6.1. Company Overview
- 13.1.6.2. Products
- 13.1.6.3. Company Financials
- 13.1.6.4. SWOT Analysis
- 13.1.7 The Himalayan Drug Company
- 13.1.7.1. Company Overview
- 13.1.7.2. Products
- 13.1.7.3. Company Financials
- 13.1.7.4. SWOT Analysis
- 13.1.1 Bayer AG
- 13.2. Market Entropy
- 13.2.1 Company's Key Areas Served
- 13.2.2 Recent Developments
- 13.3. Company Market Share Analysis 2025
- 13.3.1 Top 5 Companies Market Share Analysis
- 13.3.2 Top 3 Companies Market Share Analysis
- 13.4. List of Potential Customers
- 14. Research Methodology
List of Figures
- Figure 1: Global Immune Health Supplements Industry Revenue Breakdown (Million, %) by Region 2025 & 2033
- Figure 2: North America Immune Health Supplements Industry Revenue (Million), by Product Type 2025 & 2033
- Figure 3: North America Immune Health Supplements Industry Revenue Share (%), by Product Type 2025 & 2033
- Figure 4: North America Immune Health Supplements Industry Revenue (Million), by Source 2025 & 2033
- Figure 5: North America Immune Health Supplements Industry Revenue Share (%), by Source 2025 & 2033
- Figure 6: North America Immune Health Supplements Industry Revenue (Million), by Format 2025 & 2033
- Figure 7: North America Immune Health Supplements Industry Revenue Share (%), by Format 2025 & 2033
- Figure 8: North America Immune Health Supplements Industry Revenue (Million), by Distribution Channel 2025 & 2033
- Figure 9: North America Immune Health Supplements Industry Revenue Share (%), by Distribution Channel 2025 & 2033
- Figure 10: North America Immune Health Supplements Industry Revenue (Million), by Country 2025 & 2033
- Figure 11: North America Immune Health Supplements Industry Revenue Share (%), by Country 2025 & 2033
- Figure 12: Europe Immune Health Supplements Industry Revenue (Million), by Product Type 2025 & 2033
- Figure 13: Europe Immune Health Supplements Industry Revenue Share (%), by Product Type 2025 & 2033
- Figure 14: Europe Immune Health Supplements Industry Revenue (Million), by Source 2025 & 2033
- Figure 15: Europe Immune Health Supplements Industry Revenue Share (%), by Source 2025 & 2033
- Figure 16: Europe Immune Health Supplements Industry Revenue (Million), by Format 2025 & 2033
- Figure 17: Europe Immune Health Supplements Industry Revenue Share (%), by Format 2025 & 2033
- Figure 18: Europe Immune Health Supplements Industry Revenue (Million), by Distribution Channel 2025 & 2033
- Figure 19: Europe Immune Health Supplements Industry Revenue Share (%), by Distribution Channel 2025 & 2033
- Figure 20: Europe Immune Health Supplements Industry Revenue (Million), by Country 2025 & 2033
- Figure 21: Europe Immune Health Supplements Industry Revenue Share (%), by Country 2025 & 2033
- Figure 22: Asia Pacific Immune Health Supplements Industry Revenue (Million), by Product Type 2025 & 2033
- Figure 23: Asia Pacific Immune Health Supplements Industry Revenue Share (%), by Product Type 2025 & 2033
- Figure 24: Asia Pacific Immune Health Supplements Industry Revenue (Million), by Source 2025 & 2033
- Figure 25: Asia Pacific Immune Health Supplements Industry Revenue Share (%), by Source 2025 & 2033
- Figure 26: Asia Pacific Immune Health Supplements Industry Revenue (Million), by Format 2025 & 2033
- Figure 27: Asia Pacific Immune Health Supplements Industry Revenue Share (%), by Format 2025 & 2033
- Figure 28: Asia Pacific Immune Health Supplements Industry Revenue (Million), by Distribution Channel 2025 & 2033
- Figure 29: Asia Pacific Immune Health Supplements Industry Revenue Share (%), by Distribution Channel 2025 & 2033
- Figure 30: Asia Pacific Immune Health Supplements Industry Revenue (Million), by Country 2025 & 2033
- Figure 31: Asia Pacific Immune Health Supplements Industry Revenue Share (%), by Country 2025 & 2033
- Figure 32: South America Immune Health Supplements Industry Revenue (Million), by Product Type 2025 & 2033
- Figure 33: South America Immune Health Supplements Industry Revenue Share (%), by Product Type 2025 & 2033
- Figure 34: South America Immune Health Supplements Industry Revenue (Million), by Source 2025 & 2033
- Figure 35: South America Immune Health Supplements Industry Revenue Share (%), by Source 2025 & 2033
- Figure 36: South America Immune Health Supplements Industry Revenue (Million), by Format 2025 & 2033
- Figure 37: South America Immune Health Supplements Industry Revenue Share (%), by Format 2025 & 2033
- Figure 38: South America Immune Health Supplements Industry Revenue (Million), by Distribution Channel 2025 & 2033
- Figure 39: South America Immune Health Supplements Industry Revenue Share (%), by Distribution Channel 2025 & 2033
- Figure 40: South America Immune Health Supplements Industry Revenue (Million), by Country 2025 & 2033
- Figure 41: South America Immune Health Supplements Industry Revenue Share (%), by Country 2025 & 2033
- Figure 42: Middle East Immune Health Supplements Industry Revenue (Million), by Product Type 2025 & 2033
- Figure 43: Middle East Immune Health Supplements Industry Revenue Share (%), by Product Type 2025 & 2033
- Figure 44: Middle East Immune Health Supplements Industry Revenue (Million), by Source 2025 & 2033
- Figure 45: Middle East Immune Health Supplements Industry Revenue Share (%), by Source 2025 & 2033
- Figure 46: Middle East Immune Health Supplements Industry Revenue (Million), by Format 2025 & 2033
- Figure 47: Middle East Immune Health Supplements Industry Revenue Share (%), by Format 2025 & 2033
- Figure 48: Middle East Immune Health Supplements Industry Revenue (Million), by Distribution Channel 2025 & 2033
- Figure 49: Middle East Immune Health Supplements Industry Revenue Share (%), by Distribution Channel 2025 & 2033
- Figure 50: Middle East Immune Health Supplements Industry Revenue (Million), by Country 2025 & 2033
- Figure 51: Middle East Immune Health Supplements Industry Revenue Share (%), by Country 2025 & 2033
- Figure 52: South Africa Immune Health Supplements Industry Revenue (Million), by Product Type 2025 & 2033
- Figure 53: South Africa Immune Health Supplements Industry Revenue Share (%), by Product Type 2025 & 2033
- Figure 54: South Africa Immune Health Supplements Industry Revenue (Million), by Source 2025 & 2033
- Figure 55: South Africa Immune Health Supplements Industry Revenue Share (%), by Source 2025 & 2033
- Figure 56: South Africa Immune Health Supplements Industry Revenue (Million), by Format 2025 & 2033
- Figure 57: South Africa Immune Health Supplements Industry Revenue Share (%), by Format 2025 & 2033
- Figure 58: South Africa Immune Health Supplements Industry Revenue (Million), by Distribution Channel 2025 & 2033
- Figure 59: South Africa Immune Health Supplements Industry Revenue Share (%), by Distribution Channel 2025 & 2033
- Figure 60: South Africa Immune Health Supplements Industry Revenue (Million), by Country 2025 & 2033
- Figure 61: South Africa Immune Health Supplements Industry Revenue Share (%), by Country 2025 & 2033
List of Tables
- Table 1: Global Immune Health Supplements Industry Revenue Million Forecast, by Product Type 2020 & 2033
- Table 2: Global Immune Health Supplements Industry Revenue Million Forecast, by Source 2020 & 2033
- Table 3: Global Immune Health Supplements Industry Revenue Million Forecast, by Format 2020 & 2033
- Table 4: Global Immune Health Supplements Industry Revenue Million Forecast, by Distribution Channel 2020 & 2033
- Table 5: Global Immune Health Supplements Industry Revenue Million Forecast, by Region 2020 & 2033
- Table 6: Global Immune Health Supplements Industry Revenue Million Forecast, by Product Type 2020 & 2033
- Table 7: Global Immune Health Supplements Industry Revenue Million Forecast, by Source 2020 & 2033
- Table 8: Global Immune Health Supplements Industry Revenue Million Forecast, by Format 2020 & 2033
- Table 9: Global Immune Health Supplements Industry Revenue Million Forecast, by Distribution Channel 2020 & 2033
- Table 10: Global Immune Health Supplements Industry Revenue Million Forecast, by Country 2020 & 2033
- Table 11: United States Immune Health Supplements Industry Revenue (Million) Forecast, by Application 2020 & 2033
- Table 12: Canada Immune Health Supplements Industry Revenue (Million) Forecast, by Application 2020 & 2033
- Table 13: Mexico Immune Health Supplements Industry Revenue (Million) Forecast, by Application 2020 & 2033
- Table 14: Rest of North America Immune Health Supplements Industry Revenue (Million) Forecast, by Application 2020 & 2033
- Table 15: Global Immune Health Supplements Industry Revenue Million Forecast, by Product Type 2020 & 2033
- Table 16: Global Immune Health Supplements Industry Revenue Million Forecast, by Source 2020 & 2033
- Table 17: Global Immune Health Supplements Industry Revenue Million Forecast, by Format 2020 & 2033
- Table 18: Global Immune Health Supplements Industry Revenue Million Forecast, by Distribution Channel 2020 & 2033
- Table 19: Global Immune Health Supplements Industry Revenue Million Forecast, by Country 2020 & 2033
- Table 20: United Kingdom Immune Health Supplements Industry Revenue (Million) Forecast, by Application 2020 & 2033
- Table 21: Germany Immune Health Supplements Industry Revenue (Million) Forecast, by Application 2020 & 2033
- Table 22: Spain Immune Health Supplements Industry Revenue (Million) Forecast, by Application 2020 & 2033
- Table 23: France Immune Health Supplements Industry Revenue (Million) Forecast, by Application 2020 & 2033
- Table 24: Italy Immune Health Supplements Industry Revenue (Million) Forecast, by Application 2020 & 2033
- Table 25: Russia Immune Health Supplements Industry Revenue (Million) Forecast, by Application 2020 & 2033
- Table 26: Rest of Europe Immune Health Supplements Industry Revenue (Million) Forecast, by Application 2020 & 2033
- Table 27: Global Immune Health Supplements Industry Revenue Million Forecast, by Product Type 2020 & 2033
- Table 28: Global Immune Health Supplements Industry Revenue Million Forecast, by Source 2020 & 2033
- Table 29: Global Immune Health Supplements Industry Revenue Million Forecast, by Format 2020 & 2033
- Table 30: Global Immune Health Supplements Industry Revenue Million Forecast, by Distribution Channel 2020 & 2033
- Table 31: Global Immune Health Supplements Industry Revenue Million Forecast, by Country 2020 & 2033
- Table 32: China Immune Health Supplements Industry Revenue (Million) Forecast, by Application 2020 & 2033
- Table 33: India Immune Health Supplements Industry Revenue (Million) Forecast, by Application 2020 & 2033
- Table 34: Japan Immune Health Supplements Industry Revenue (Million) Forecast, by Application 2020 & 2033
- Table 35: Australia Immune Health Supplements Industry Revenue (Million) Forecast, by Application 2020 & 2033
- Table 36: Rest of Asia Pacific Immune Health Supplements Industry Revenue (Million) Forecast, by Application 2020 & 2033
- Table 37: Global Immune Health Supplements Industry Revenue Million Forecast, by Product Type 2020 & 2033
- Table 38: Global Immune Health Supplements Industry Revenue Million Forecast, by Source 2020 & 2033
- Table 39: Global Immune Health Supplements Industry Revenue Million Forecast, by Format 2020 & 2033
- Table 40: Global Immune Health Supplements Industry Revenue Million Forecast, by Distribution Channel 2020 & 2033
- Table 41: Global Immune Health Supplements Industry Revenue Million Forecast, by Country 2020 & 2033
- Table 42: Brazil Immune Health Supplements Industry Revenue (Million) Forecast, by Application 2020 & 2033
- Table 43: Argentina Immune Health Supplements Industry Revenue (Million) Forecast, by Application 2020 & 2033
- Table 44: Rest of South America Immune Health Supplements Industry Revenue (Million) Forecast, by Application 2020 & 2033
- Table 45: Global Immune Health Supplements Industry Revenue Million Forecast, by Product Type 2020 & 2033
- Table 46: Global Immune Health Supplements Industry Revenue Million Forecast, by Source 2020 & 2033
- Table 47: Global Immune Health Supplements Industry Revenue Million Forecast, by Format 2020 & 2033
- Table 48: Global Immune Health Supplements Industry Revenue Million Forecast, by Distribution Channel 2020 & 2033
- Table 49: Global Immune Health Supplements Industry Revenue Million Forecast, by Country 2020 & 2033
- Table 50: Global Immune Health Supplements Industry Revenue Million Forecast, by Product Type 2020 & 2033
- Table 51: Global Immune Health Supplements Industry Revenue Million Forecast, by Source 2020 & 2033
- Table 52: Global Immune Health Supplements Industry Revenue Million Forecast, by Format 2020 & 2033
- Table 53: Global Immune Health Supplements Industry Revenue Million Forecast, by Distribution Channel 2020 & 2033
- Table 54: Global Immune Health Supplements Industry Revenue Million Forecast, by Country 2020 & 2033
- Table 55: Saudi Arabia Immune Health Supplements Industry Revenue (Million) Forecast, by Application 2020 & 2033
- Table 56: Rest of Middle East Immune Health Supplements Industry Revenue (Million) Forecast, by Application 2020 & 2033
Frequently Asked Questions
1. What is the projected Compound Annual Growth Rate (CAGR) of the Immune Health Supplements Industry?
The projected CAGR is approximately 7.40%.
2. Which companies are prominent players in the Immune Health Supplements Industry?
Key companies in the market include Bayer AG, Amway Corp, Koninklijke DSM N V, NutriGold Inc*List Not Exhaustive, NOW Foods, Glanbia Plc, The Himalayan Drug Company.
3. What are the main segments of the Immune Health Supplements Industry?
The market segments include Product Type, Source, Format, Distribution Channel.
4. Can you provide details about the market size?
The market size is estimated to be USD 25,456.2 Million as of 2022.
5. What are some drivers contributing to market growth?
Popularity of Convenient and On the Go Snacking Options; Product Differentiation Playing a Key Role in Market Expansion.
6. What are the notable trends driving market growth?
Increasing Healthcare Costs and Growing Dependence on Supplements.
7. Are there any restraints impacting market growth?
Associated Health Risks; Easy Availability of Healthy Substitutes.
8. Can you provide examples of recent developments in the market?
N/A
9. What pricing options are available for accessing the report?
Pricing options include single-user, multi-user, and enterprise licenses priced at USD 4750, USD 5250, and USD 8750 respectively.
10. Is the market size provided in terms of value or volume?
The market size is provided in terms of value, measured in Million.
11. Are there any specific market keywords associated with the report?
Yes, the market keyword associated with the report is "Immune Health Supplements Industry," which aids in identifying and referencing the specific market segment covered.
12. How do I determine which pricing option suits my needs best?
The pricing options vary based on user requirements and access needs. Individual users may opt for single-user licenses, while businesses requiring broader access may choose multi-user or enterprise licenses for cost-effective access to the report.
13. Are there any additional resources or data provided in the Immune Health Supplements Industry report?
While the report offers comprehensive insights, it's advisable to review the specific contents or supplementary materials provided to ascertain if additional resources or data are available.
14. How can I stay updated on further developments or reports in the Immune Health Supplements Industry?
To stay informed about further developments, trends, and reports in the Immune Health Supplements Industry, consider subscribing to industry newsletters, following relevant companies and organizations, or regularly checking reputable industry news sources and publications.
Methodology
Step 1 - Identification of Relevant Samples Size from Population Database


Step 2 - Approaches for Defining Global Market Size (Value, Volume* & Price*)

Note*: In applicable scenarios
Step 3 - Data Sources
Primary Research
- Web Analytics
- Survey Reports
- Research Institute
- Latest Research Reports
- Opinion Leaders
Secondary Research
- Annual Reports
- White Paper
- Latest Press Release
- Industry Association
- Paid Database
- Investor Presentations

Step 4 - Data Triangulation
Involves using different sources of information in order to increase the validity of a study
These sources are likely to be stakeholders in a program - participants, other researchers, program staff, other community members, and so on.
Then we put all data in single framework & apply various statistical tools to find out the dynamic on the market.
During the analysis stage, feedback from the stakeholder groups would be compared to determine areas of agreement as well as areas of divergence