

Key Insights
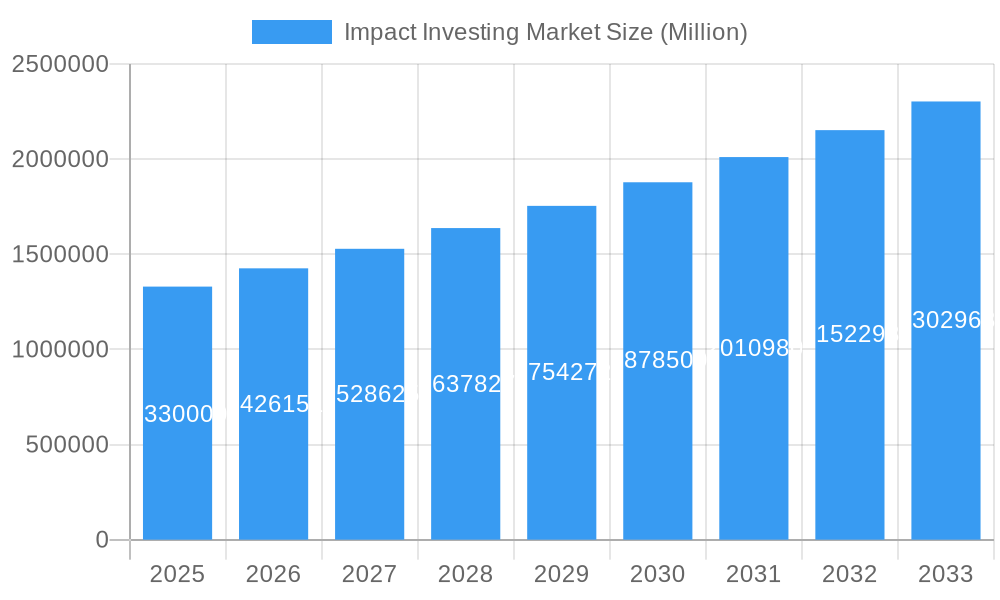
The impact investing market, currently valued at $1.33 trillion in 2025, is projected to experience robust growth, exhibiting a Compound Annual Growth Rate (CAGR) of 7.17% from 2025 to 2033. This expansion is driven by a confluence of factors. Increasing awareness of environmental, social, and governance (ESG) issues among investors is a primary catalyst. Growing concerns about climate change, social inequality, and ethical business practices are pushing institutional and individual investors towards impact investments, aligning their financial returns with positive social and environmental outcomes. Furthermore, the development of innovative financial instruments and sophisticated impact measurement methodologies is facilitating greater transparency and accountability within the sector, fostering increased investor confidence. Government policies promoting sustainable development and incentivizing impact investing also contribute significantly to market growth. The market is segmented by investment strategy (e.g., venture capital, private equity, debt financing), target sector (e.g., renewable energy, affordable housing, sustainable agriculture), and geographic region. Leading players like Vital Capital, BlueOrchard Finance, BlackRock, and Goldman Sachs are actively shaping the market landscape through their significant investments and innovative approaches.
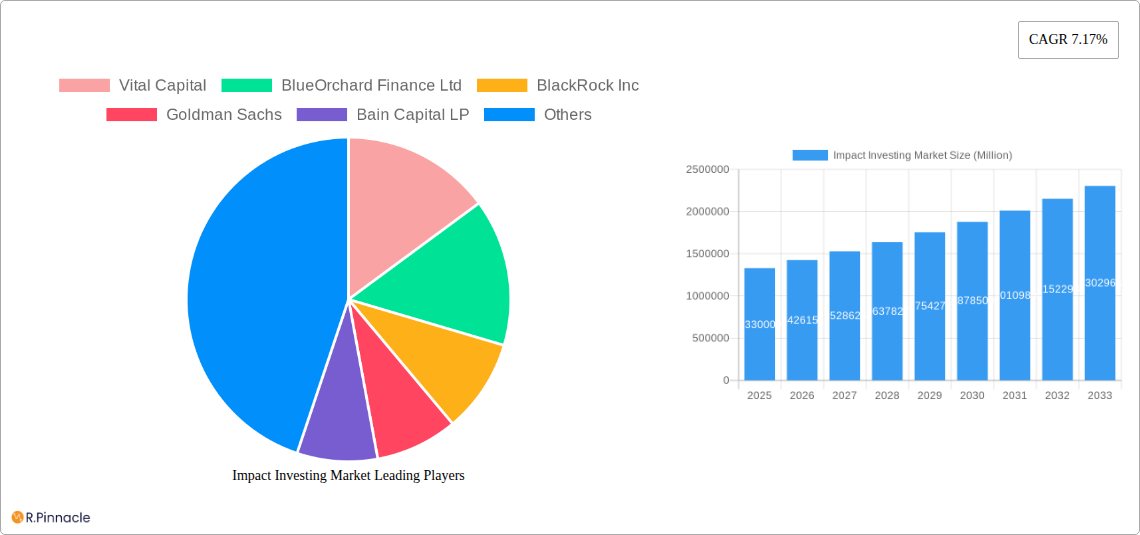
Impact Investing Market Market Size (In Million)
The continued growth of the impact investing market is expected despite potential headwinds. While increased regulatory scrutiny and the challenge of accurately measuring social and environmental impact remain concerns, the overarching trend points towards sustained expansion. The increasing availability of data and advanced analytics will enhance impact measurement capabilities, thereby mitigating some of these challenges. Moreover, the integration of ESG factors into mainstream investment strategies is expected to drive further mainstream adoption of impact investing, leading to a broader investor base and larger market capitalization in the coming years. The consistent rise of sustainable finance initiatives globally will further bolster this growth trajectory. Competition among impact investing firms is likely to intensify, prompting innovation and a greater focus on achieving superior risk-adjusted returns while delivering measurable social and environmental benefits.
Impact Investing Market Company Market Share
Impact Investing Market Report: 2019-2033 Forecast
This comprehensive report provides a detailed analysis of the Impact Investing Market from 2019 to 2033, offering invaluable insights for industry professionals, investors, and strategists. The report covers market structure, dynamics, key players, and future growth potential, incorporating recent significant industry developments. The study period is 2019-2033, with the base year being 2025 and the forecast period 2025-2033. The historical period covered is 2019-2024.
Impact Investing Market Structure & Innovation Trends
This section analyzes the Impact Investing Market's competitive landscape, focusing on market concentration, innovation drivers, regulatory frameworks, and M&A activities. The report includes estimations of market share for key players and quantifies the value of significant M&A deals.
- Market Concentration: The market exhibits a moderately concentrated structure with several large players holding significant market share. BlackRock Inc., Goldman Sachs, and Bain Capital LP are among the prominent firms, though the exact market share distribution will be detailed in the full report.
- Innovation Drivers: Technological advancements in data analytics, fintech, and ESG (Environmental, Social, and Governance) reporting drive innovation, enabling more effective impact measurement and portfolio management.
- Regulatory Frameworks: Evolving regulatory landscapes globally influence investment strategies and reporting requirements, impacting market growth and player strategies.
- Product Substitutes: Traditional investment vehicles compete with impact investments; the report analyzes the comparative advantages and disadvantages of each.
- End-User Demographics: The report analyzes the diversity of end-users, including institutional investors, high-net-worth individuals, and foundations.
- M&A Activities: Recent significant mergers and acquisitions, such as BlackRock's acquisition of Kreos Capital for an undisclosed amount and the USD 3 Billion acquisition of GIP, highlight the market's consolidation and growth trajectory. Further details on M&A deal values and their impact on market dynamics will be provided in the full report. The total M&A deal value in the period 2019-2024 is estimated at xx Million.
Impact Investing Market Dynamics & Trends
This section examines the factors driving market growth, including technological disruptions, evolving consumer preferences, and competitive dynamics. The report provides a comprehensive analysis of market growth drivers and estimates CAGR and market penetration rates for key segments. The predicted CAGR for the forecast period (2025-2033) is xx%. Market penetration is expected to reach xx% by 2033.
Dominant Regions & Segments in Impact Investing Market
This section identifies the leading regions and segments within the Impact Investing Market. The report will provide a detailed analysis, pinpointing the reasons for market dominance in specific regions and segments. Data on market size by region will be included.
- Key Drivers of Dominance:
- North America: Strong regulatory support, a large pool of capital, and a focus on ESG investing contribute to North America's dominance.
- Europe: Growing awareness of sustainability issues and supportive government policies drive market growth in Europe.
- Asia-Pacific: Rapid economic growth and increasing awareness of ESG factors contribute to the growing market in this region.
- Dominant Segments: Further details on the dominant segments (e.g., renewable energy, affordable housing, etc.) with projected growth rates will be provided in the full report.
Impact Investing Market Product Innovations
This section summarizes recent product developments, emphasizing technological advancements and their impact on market competition. The focus will be on innovative approaches to impact measurement and reporting, as well as new investment strategies tailored to specific Sustainable Development Goals.
Report Scope & Segmentation Analysis
This section outlines the various market segmentations analyzed in the report, including regional segmentation, investment strategy segmentation, and impact area segmentation. Growth projections and market sizes will be provided for each segment, along with a competitive analysis of each segment.
Key Drivers of Impact Investing Market Growth
This section details the key factors driving market growth, including technological advancements (e.g., improved impact measurement tools), supportive government policies (e.g., tax incentives for impact investments), and increasing awareness of Environmental, Social, and Governance (ESG) factors among investors.
Challenges in the Impact Investing Market Sector
This section discusses the key challenges faced by the impact investing market, including standardization issues for impact measurement, a lack of universally accepted standards, and the potential for "greenwashing". The report will quantify the impact of these challenges on market growth.
Emerging Opportunities in Impact Investing Market
This section highlights emerging opportunities within the Impact Investing Market, such as growth in emerging markets and new technologies that facilitate better impact measurement and reporting, leading to increased investor interest.
Leading Players in the Impact Investing Market Market
- Vital Capital
- BlueOrchard Finance Ltd
- BlackRock Inc
- Goldman Sachs
- Bain Capital LP
- Morgan Stanley
- Prudential Financial Inc
- Manulife Investment Management Holdings (Canada) Inc
- Leapfrog Investments
- Community Investment Management LLC (Website unavailable)
- List Not Exhaustive
Key Developments in Impact Investing Market Industry
- August 2023: BlackRock Inc. finalized the acquisition of Kreos Capital, strengthening its position in the global credit asset management market.
- January 2024: Staley Point Capital and Bain Capital Real Estate completed the sale of a Southern California industrial property for USD 38.4 Million, demonstrating strong demand in the sector.
- January 2024: BlackRock Inc. acquired Global Infrastructure Partners (GIP) for USD 3 Billion in cash and 12 Million shares, significantly impacting market consolidation.
Future Outlook for Impact Investing Market Market
The Impact Investing Market is poised for significant growth over the forecast period, driven by increasing investor interest in ESG factors, technological advancements, and supportive regulatory frameworks. The market is expected to attract further institutional capital and witness continued innovation in impact measurement and reporting. The full report will provide specific growth projections and strategic recommendations for market players.
Impact Investing Market Segmentation
-
1. Type
- 1.1. Institutional Investors
- 1.2. Individual Investors
-
2. End User
- 2.1. Education
- 2.2. Agriculture
- 2.3. Healthcare
- 2.4. Climate Tech
Impact Investing Market Segmentation By Geography
-
1. North America
- 1.1. United States
- 1.2. Canada
- 1.3. Mexico
-
2. South America
- 2.1. Brazil
- 2.2. Argentina
- 2.3. Rest of South America
-
3. Europe
- 3.1. United Kingdom
- 3.2. Germany
- 3.3. France
- 3.4. Italy
- 3.5. Spain
- 3.6. Russia
- 3.7. Benelux
- 3.8. Nordics
- 3.9. Rest of Europe
-
4. Middle East & Africa
- 4.1. Turkey
- 4.2. Israel
- 4.3. GCC
- 4.4. North Africa
- 4.5. South Africa
- 4.6. Rest of Middle East & Africa
-
5. Asia Pacific
- 5.1. China
- 5.2. India
- 5.3. Japan
- 5.4. South Korea
- 5.5. ASEAN
- 5.6. Oceania
- 5.7. Rest of Asia Pacific

Impact Investing Market Regional Market Share
Geographic Coverage of Impact Investing Market
Impact Investing Market REPORT HIGHLIGHTS
| Aspects | Details |
|---|---|
| Study Period | 2020-2034 |
| Base Year | 2025 |
| Estimated Year | 2026 |
| Forecast Period | 2026-2034 |
| Historical Period | 2020-2025 |
| Growth Rate | CAGR of 7.17% from 2020-2034 |
| Segmentation |
|
Table of Contents
- 1. Introduction
- 1.1. Research Scope
- 1.2. Market Segmentation
- 1.3. Research Objective
- 1.4. Definitions and Assumptions
- 2. Executive Summary
- 2.1. Market Snapshot
- 3. Market Dynamics
- 3.1. Market Drivers
- 3.2. Market Restrains
- 3.3. Market Trends
- 3.4. Market Opportunities
- 4. Market Factor Analysis
- 4.1. Porters Five Forces
- 4.1.1. Bargaining Power of Suppliers
- 4.1.2. Bargaining Power of Buyers
- 4.1.3. Threat of New Entrants
- 4.1.4. Threat of Substitutes
- 4.1.5. Competitive Rivalry
- 4.2. PESTEL analysis
- 4.3. BCG Analysis
- 4.3.1. Stars (High Growth, High Market Share)
- 4.3.2. Cash Cows (Low Growth, High Market Share)
- 4.3.3. Question Mark (High Growth, Low Market Share)
- 4.3.4. Dogs (Low Growth, Low Market Share)
- 4.4. Ansoff Matrix Analysis
- 4.5. Supply Chain Analysis
- 4.6. Regulatory Landscape
- 4.7. Current Market Potential and Opportunity Assessment (TAM–SAM–SOM Framework)
- 4.8. PRI Analyst Note
- 4.1. Porters Five Forces
- 5. Market Analysis, Insights and Forecast 2021-2033
- 5.1. Market Analysis, Insights and Forecast - by Type
- 5.1.1. Institutional Investors
- 5.1.2. Individual Investors
- 5.2. Market Analysis, Insights and Forecast - by End User
- 5.2.1. Education
- 5.2.2. Agriculture
- 5.2.3. Healthcare
- 5.2.4. Climate Tech
- 5.3. Market Analysis, Insights and Forecast - by Region
- 5.3.1. North America
- 5.3.2. South America
- 5.3.3. Europe
- 5.3.4. Middle East & Africa
- 5.3.5. Asia Pacific
- 5.1. Market Analysis, Insights and Forecast - by Type
- 6. Global Impact Investing Market Analysis, Insights and Forecast, 2021-2033
- 6.1. Market Analysis, Insights and Forecast - by Type
- 6.1.1. Institutional Investors
- 6.1.2. Individual Investors
- 6.2. Market Analysis, Insights and Forecast - by End User
- 6.2.1. Education
- 6.2.2. Agriculture
- 6.2.3. Healthcare
- 6.2.4. Climate Tech
- 6.1. Market Analysis, Insights and Forecast - by Type
- 7. North America Impact Investing Market Analysis, Insights and Forecast, 2020-2032
- 7.1. Market Analysis, Insights and Forecast - by Type
- 7.1.1. Institutional Investors
- 7.1.2. Individual Investors
- 7.2. Market Analysis, Insights and Forecast - by End User
- 7.2.1. Education
- 7.2.2. Agriculture
- 7.2.3. Healthcare
- 7.2.4. Climate Tech
- 7.1. Market Analysis, Insights and Forecast - by Type
- 8. South America Impact Investing Market Analysis, Insights and Forecast, 2020-2032
- 8.1. Market Analysis, Insights and Forecast - by Type
- 8.1.1. Institutional Investors
- 8.1.2. Individual Investors
- 8.2. Market Analysis, Insights and Forecast - by End User
- 8.2.1. Education
- 8.2.2. Agriculture
- 8.2.3. Healthcare
- 8.2.4. Climate Tech
- 8.1. Market Analysis, Insights and Forecast - by Type
- 9. Europe Impact Investing Market Analysis, Insights and Forecast, 2020-2032
- 9.1. Market Analysis, Insights and Forecast - by Type
- 9.1.1. Institutional Investors
- 9.1.2. Individual Investors
- 9.2. Market Analysis, Insights and Forecast - by End User
- 9.2.1. Education
- 9.2.2. Agriculture
- 9.2.3. Healthcare
- 9.2.4. Climate Tech
- 9.1. Market Analysis, Insights and Forecast - by Type
- 10. Middle East & Africa Impact Investing Market Analysis, Insights and Forecast, 2020-2032
- 10.1. Market Analysis, Insights and Forecast - by Type
- 10.1.1. Institutional Investors
- 10.1.2. Individual Investors
- 10.2. Market Analysis, Insights and Forecast - by End User
- 10.2.1. Education
- 10.2.2. Agriculture
- 10.2.3. Healthcare
- 10.2.4. Climate Tech
- 10.1. Market Analysis, Insights and Forecast - by Type
- 11. Asia Pacific Impact Investing Market Analysis, Insights and Forecast, 2020-2032
- 11.1. Market Analysis, Insights and Forecast - by Type
- 11.1.1. Institutional Investors
- 11.1.2. Individual Investors
- 11.2. Market Analysis, Insights and Forecast - by End User
- 11.2.1. Education
- 11.2.2. Agriculture
- 11.2.3. Healthcare
- 11.2.4. Climate Tech
- 11.1. Market Analysis, Insights and Forecast - by Type
- 12. Competitive Analysis
- 12.1. Company Profiles
- 12.1.1 Vital Capital
- 12.1.1.1. Company Overview
- 12.1.1.2. Products
- 12.1.1.3. Company Financials
- 12.1.1.4. SWOT Analysis
- 12.1.2 BlueOrchard Finance Ltd
- 12.1.2.1. Company Overview
- 12.1.2.2. Products
- 12.1.2.3. Company Financials
- 12.1.2.4. SWOT Analysis
- 12.1.3 BlackRock Inc
- 12.1.3.1. Company Overview
- 12.1.3.2. Products
- 12.1.3.3. Company Financials
- 12.1.3.4. SWOT Analysis
- 12.1.4 Goldman Sachs
- 12.1.4.1. Company Overview
- 12.1.4.2. Products
- 12.1.4.3. Company Financials
- 12.1.4.4. SWOT Analysis
- 12.1.5 Bain Capital LP
- 12.1.5.1. Company Overview
- 12.1.5.2. Products
- 12.1.5.3. Company Financials
- 12.1.5.4. SWOT Analysis
- 12.1.6 Morgan Stanley
- 12.1.6.1. Company Overview
- 12.1.6.2. Products
- 12.1.6.3. Company Financials
- 12.1.6.4. SWOT Analysis
- 12.1.7 Prudential Financial Inc
- 12.1.7.1. Company Overview
- 12.1.7.2. Products
- 12.1.7.3. Company Financials
- 12.1.7.4. SWOT Analysis
- 12.1.8 Manulife Investment Management Holdings (Canada) Inc
- 12.1.8.1. Company Overview
- 12.1.8.2. Products
- 12.1.8.3. Company Financials
- 12.1.8.4. SWOT Analysis
- 12.1.9 Leapfrog Investments
- 12.1.9.1. Company Overview
- 12.1.9.2. Products
- 12.1.9.3. Company Financials
- 12.1.9.4. SWOT Analysis
- 12.1.10 Community Investment Management LLC**List Not Exhaustive
- 12.1.10.1. Company Overview
- 12.1.10.2. Products
- 12.1.10.3. Company Financials
- 12.1.10.4. SWOT Analysis
- 12.1.1 Vital Capital
- 12.2. Market Entropy
- 12.2.1 Company's Key Areas Served
- 12.2.2 Recent Developments
- 12.3. Company Market Share Analysis 2025
- 12.3.1 Top 5 Companies Market Share Analysis
- 12.3.2 Top 3 Companies Market Share Analysis
- 12.4. List of Potential Customers
- 13. Research Methodology
List of Figures
- Figure 1: Global Impact Investing Market Revenue Breakdown (Million, %) by Region 2025 & 2033
- Figure 2: Global Impact Investing Market Volume Breakdown (Trillion, %) by Region 2025 & 2033
- Figure 3: North America Impact Investing Market Revenue (Million), by Type 2025 & 2033
- Figure 4: North America Impact Investing Market Volume (Trillion), by Type 2025 & 2033
- Figure 5: North America Impact Investing Market Revenue Share (%), by Type 2025 & 2033
- Figure 6: North America Impact Investing Market Volume Share (%), by Type 2025 & 2033
- Figure 7: North America Impact Investing Market Revenue (Million), by End User 2025 & 2033
- Figure 8: North America Impact Investing Market Volume (Trillion), by End User 2025 & 2033
- Figure 9: North America Impact Investing Market Revenue Share (%), by End User 2025 & 2033
- Figure 10: North America Impact Investing Market Volume Share (%), by End User 2025 & 2033
- Figure 11: North America Impact Investing Market Revenue (Million), by Country 2025 & 2033
- Figure 12: North America Impact Investing Market Volume (Trillion), by Country 2025 & 2033
- Figure 13: North America Impact Investing Market Revenue Share (%), by Country 2025 & 2033
- Figure 14: North America Impact Investing Market Volume Share (%), by Country 2025 & 2033
- Figure 15: South America Impact Investing Market Revenue (Million), by Type 2025 & 2033
- Figure 16: South America Impact Investing Market Volume (Trillion), by Type 2025 & 2033
- Figure 17: South America Impact Investing Market Revenue Share (%), by Type 2025 & 2033
- Figure 18: South America Impact Investing Market Volume Share (%), by Type 2025 & 2033
- Figure 19: South America Impact Investing Market Revenue (Million), by End User 2025 & 2033
- Figure 20: South America Impact Investing Market Volume (Trillion), by End User 2025 & 2033
- Figure 21: South America Impact Investing Market Revenue Share (%), by End User 2025 & 2033
- Figure 22: South America Impact Investing Market Volume Share (%), by End User 2025 & 2033
- Figure 23: South America Impact Investing Market Revenue (Million), by Country 2025 & 2033
- Figure 24: South America Impact Investing Market Volume (Trillion), by Country 2025 & 2033
- Figure 25: South America Impact Investing Market Revenue Share (%), by Country 2025 & 2033
- Figure 26: South America Impact Investing Market Volume Share (%), by Country 2025 & 2033
- Figure 27: Europe Impact Investing Market Revenue (Million), by Type 2025 & 2033
- Figure 28: Europe Impact Investing Market Volume (Trillion), by Type 2025 & 2033
- Figure 29: Europe Impact Investing Market Revenue Share (%), by Type 2025 & 2033
- Figure 30: Europe Impact Investing Market Volume Share (%), by Type 2025 & 2033
- Figure 31: Europe Impact Investing Market Revenue (Million), by End User 2025 & 2033
- Figure 32: Europe Impact Investing Market Volume (Trillion), by End User 2025 & 2033
- Figure 33: Europe Impact Investing Market Revenue Share (%), by End User 2025 & 2033
- Figure 34: Europe Impact Investing Market Volume Share (%), by End User 2025 & 2033
- Figure 35: Europe Impact Investing Market Revenue (Million), by Country 2025 & 2033
- Figure 36: Europe Impact Investing Market Volume (Trillion), by Country 2025 & 2033
- Figure 37: Europe Impact Investing Market Revenue Share (%), by Country 2025 & 2033
- Figure 38: Europe Impact Investing Market Volume Share (%), by Country 2025 & 2033
- Figure 39: Middle East & Africa Impact Investing Market Revenue (Million), by Type 2025 & 2033
- Figure 40: Middle East & Africa Impact Investing Market Volume (Trillion), by Type 2025 & 2033
- Figure 41: Middle East & Africa Impact Investing Market Revenue Share (%), by Type 2025 & 2033
- Figure 42: Middle East & Africa Impact Investing Market Volume Share (%), by Type 2025 & 2033
- Figure 43: Middle East & Africa Impact Investing Market Revenue (Million), by End User 2025 & 2033
- Figure 44: Middle East & Africa Impact Investing Market Volume (Trillion), by End User 2025 & 2033
- Figure 45: Middle East & Africa Impact Investing Market Revenue Share (%), by End User 2025 & 2033
- Figure 46: Middle East & Africa Impact Investing Market Volume Share (%), by End User 2025 & 2033
- Figure 47: Middle East & Africa Impact Investing Market Revenue (Million), by Country 2025 & 2033
- Figure 48: Middle East & Africa Impact Investing Market Volume (Trillion), by Country 2025 & 2033
- Figure 49: Middle East & Africa Impact Investing Market Revenue Share (%), by Country 2025 & 2033
- Figure 50: Middle East & Africa Impact Investing Market Volume Share (%), by Country 2025 & 2033
- Figure 51: Asia Pacific Impact Investing Market Revenue (Million), by Type 2025 & 2033
- Figure 52: Asia Pacific Impact Investing Market Volume (Trillion), by Type 2025 & 2033
- Figure 53: Asia Pacific Impact Investing Market Revenue Share (%), by Type 2025 & 2033
- Figure 54: Asia Pacific Impact Investing Market Volume Share (%), by Type 2025 & 2033
- Figure 55: Asia Pacific Impact Investing Market Revenue (Million), by End User 2025 & 2033
- Figure 56: Asia Pacific Impact Investing Market Volume (Trillion), by End User 2025 & 2033
- Figure 57: Asia Pacific Impact Investing Market Revenue Share (%), by End User 2025 & 2033
- Figure 58: Asia Pacific Impact Investing Market Volume Share (%), by End User 2025 & 2033
- Figure 59: Asia Pacific Impact Investing Market Revenue (Million), by Country 2025 & 2033
- Figure 60: Asia Pacific Impact Investing Market Volume (Trillion), by Country 2025 & 2033
- Figure 61: Asia Pacific Impact Investing Market Revenue Share (%), by Country 2025 & 2033
- Figure 62: Asia Pacific Impact Investing Market Volume Share (%), by Country 2025 & 2033
List of Tables
- Table 1: Global Impact Investing Market Revenue Million Forecast, by Type 2020 & 2033
- Table 2: Global Impact Investing Market Volume Trillion Forecast, by Type 2020 & 2033
- Table 3: Global Impact Investing Market Revenue Million Forecast, by End User 2020 & 2033
- Table 4: Global Impact Investing Market Volume Trillion Forecast, by End User 2020 & 2033
- Table 5: Global Impact Investing Market Revenue Million Forecast, by Region 2020 & 2033
- Table 6: Global Impact Investing Market Volume Trillion Forecast, by Region 2020 & 2033
- Table 7: Global Impact Investing Market Revenue Million Forecast, by Type 2020 & 2033
- Table 8: Global Impact Investing Market Volume Trillion Forecast, by Type 2020 & 2033
- Table 9: Global Impact Investing Market Revenue Million Forecast, by End User 2020 & 2033
- Table 10: Global Impact Investing Market Volume Trillion Forecast, by End User 2020 & 2033
- Table 11: Global Impact Investing Market Revenue Million Forecast, by Country 2020 & 2033
- Table 12: Global Impact Investing Market Volume Trillion Forecast, by Country 2020 & 2033
- Table 13: United States Impact Investing Market Revenue (Million) Forecast, by Application 2020 & 2033
- Table 14: United States Impact Investing Market Volume (Trillion) Forecast, by Application 2020 & 2033
- Table 15: Canada Impact Investing Market Revenue (Million) Forecast, by Application 2020 & 2033
- Table 16: Canada Impact Investing Market Volume (Trillion) Forecast, by Application 2020 & 2033
- Table 17: Mexico Impact Investing Market Revenue (Million) Forecast, by Application 2020 & 2033
- Table 18: Mexico Impact Investing Market Volume (Trillion) Forecast, by Application 2020 & 2033
- Table 19: Global Impact Investing Market Revenue Million Forecast, by Type 2020 & 2033
- Table 20: Global Impact Investing Market Volume Trillion Forecast, by Type 2020 & 2033
- Table 21: Global Impact Investing Market Revenue Million Forecast, by End User 2020 & 2033
- Table 22: Global Impact Investing Market Volume Trillion Forecast, by End User 2020 & 2033
- Table 23: Global Impact Investing Market Revenue Million Forecast, by Country 2020 & 2033
- Table 24: Global Impact Investing Market Volume Trillion Forecast, by Country 2020 & 2033
- Table 25: Brazil Impact Investing Market Revenue (Million) Forecast, by Application 2020 & 2033
- Table 26: Brazil Impact Investing Market Volume (Trillion) Forecast, by Application 2020 & 2033
- Table 27: Argentina Impact Investing Market Revenue (Million) Forecast, by Application 2020 & 2033
- Table 28: Argentina Impact Investing Market Volume (Trillion) Forecast, by Application 2020 & 2033
- Table 29: Rest of South America Impact Investing Market Revenue (Million) Forecast, by Application 2020 & 2033
- Table 30: Rest of South America Impact Investing Market Volume (Trillion) Forecast, by Application 2020 & 2033
- Table 31: Global Impact Investing Market Revenue Million Forecast, by Type 2020 & 2033
- Table 32: Global Impact Investing Market Volume Trillion Forecast, by Type 2020 & 2033
- Table 33: Global Impact Investing Market Revenue Million Forecast, by End User 2020 & 2033
- Table 34: Global Impact Investing Market Volume Trillion Forecast, by End User 2020 & 2033
- Table 35: Global Impact Investing Market Revenue Million Forecast, by Country 2020 & 2033
- Table 36: Global Impact Investing Market Volume Trillion Forecast, by Country 2020 & 2033
- Table 37: United Kingdom Impact Investing Market Revenue (Million) Forecast, by Application 2020 & 2033
- Table 38: United Kingdom Impact Investing Market Volume (Trillion) Forecast, by Application 2020 & 2033
- Table 39: Germany Impact Investing Market Revenue (Million) Forecast, by Application 2020 & 2033
- Table 40: Germany Impact Investing Market Volume (Trillion) Forecast, by Application 2020 & 2033
- Table 41: France Impact Investing Market Revenue (Million) Forecast, by Application 2020 & 2033
- Table 42: France Impact Investing Market Volume (Trillion) Forecast, by Application 2020 & 2033
- Table 43: Italy Impact Investing Market Revenue (Million) Forecast, by Application 2020 & 2033
- Table 44: Italy Impact Investing Market Volume (Trillion) Forecast, by Application 2020 & 2033
- Table 45: Spain Impact Investing Market Revenue (Million) Forecast, by Application 2020 & 2033
- Table 46: Spain Impact Investing Market Volume (Trillion) Forecast, by Application 2020 & 2033
- Table 47: Russia Impact Investing Market Revenue (Million) Forecast, by Application 2020 & 2033
- Table 48: Russia Impact Investing Market Volume (Trillion) Forecast, by Application 2020 & 2033
- Table 49: Benelux Impact Investing Market Revenue (Million) Forecast, by Application 2020 & 2033
- Table 50: Benelux Impact Investing Market Volume (Trillion) Forecast, by Application 2020 & 2033
- Table 51: Nordics Impact Investing Market Revenue (Million) Forecast, by Application 2020 & 2033
- Table 52: Nordics Impact Investing Market Volume (Trillion) Forecast, by Application 2020 & 2033
- Table 53: Rest of Europe Impact Investing Market Revenue (Million) Forecast, by Application 2020 & 2033
- Table 54: Rest of Europe Impact Investing Market Volume (Trillion) Forecast, by Application 2020 & 2033
- Table 55: Global Impact Investing Market Revenue Million Forecast, by Type 2020 & 2033
- Table 56: Global Impact Investing Market Volume Trillion Forecast, by Type 2020 & 2033
- Table 57: Global Impact Investing Market Revenue Million Forecast, by End User 2020 & 2033
- Table 58: Global Impact Investing Market Volume Trillion Forecast, by End User 2020 & 2033
- Table 59: Global Impact Investing Market Revenue Million Forecast, by Country 2020 & 2033
- Table 60: Global Impact Investing Market Volume Trillion Forecast, by Country 2020 & 2033
- Table 61: Turkey Impact Investing Market Revenue (Million) Forecast, by Application 2020 & 2033
- Table 62: Turkey Impact Investing Market Volume (Trillion) Forecast, by Application 2020 & 2033
- Table 63: Israel Impact Investing Market Revenue (Million) Forecast, by Application 2020 & 2033
- Table 64: Israel Impact Investing Market Volume (Trillion) Forecast, by Application 2020 & 2033
- Table 65: GCC Impact Investing Market Revenue (Million) Forecast, by Application 2020 & 2033
- Table 66: GCC Impact Investing Market Volume (Trillion) Forecast, by Application 2020 & 2033
- Table 67: North Africa Impact Investing Market Revenue (Million) Forecast, by Application 2020 & 2033
- Table 68: North Africa Impact Investing Market Volume (Trillion) Forecast, by Application 2020 & 2033
- Table 69: South Africa Impact Investing Market Revenue (Million) Forecast, by Application 2020 & 2033
- Table 70: South Africa Impact Investing Market Volume (Trillion) Forecast, by Application 2020 & 2033
- Table 71: Rest of Middle East & Africa Impact Investing Market Revenue (Million) Forecast, by Application 2020 & 2033
- Table 72: Rest of Middle East & Africa Impact Investing Market Volume (Trillion) Forecast, by Application 2020 & 2033
- Table 73: Global Impact Investing Market Revenue Million Forecast, by Type 2020 & 2033
- Table 74: Global Impact Investing Market Volume Trillion Forecast, by Type 2020 & 2033
- Table 75: Global Impact Investing Market Revenue Million Forecast, by End User 2020 & 2033
- Table 76: Global Impact Investing Market Volume Trillion Forecast, by End User 2020 & 2033
- Table 77: Global Impact Investing Market Revenue Million Forecast, by Country 2020 & 2033
- Table 78: Global Impact Investing Market Volume Trillion Forecast, by Country 2020 & 2033
- Table 79: China Impact Investing Market Revenue (Million) Forecast, by Application 2020 & 2033
- Table 80: China Impact Investing Market Volume (Trillion) Forecast, by Application 2020 & 2033
- Table 81: India Impact Investing Market Revenue (Million) Forecast, by Application 2020 & 2033
- Table 82: India Impact Investing Market Volume (Trillion) Forecast, by Application 2020 & 2033
- Table 83: Japan Impact Investing Market Revenue (Million) Forecast, by Application 2020 & 2033
- Table 84: Japan Impact Investing Market Volume (Trillion) Forecast, by Application 2020 & 2033
- Table 85: South Korea Impact Investing Market Revenue (Million) Forecast, by Application 2020 & 2033
- Table 86: South Korea Impact Investing Market Volume (Trillion) Forecast, by Application 2020 & 2033
- Table 87: ASEAN Impact Investing Market Revenue (Million) Forecast, by Application 2020 & 2033
- Table 88: ASEAN Impact Investing Market Volume (Trillion) Forecast, by Application 2020 & 2033
- Table 89: Oceania Impact Investing Market Revenue (Million) Forecast, by Application 2020 & 2033
- Table 90: Oceania Impact Investing Market Volume (Trillion) Forecast, by Application 2020 & 2033
- Table 91: Rest of Asia Pacific Impact Investing Market Revenue (Million) Forecast, by Application 2020 & 2033
- Table 92: Rest of Asia Pacific Impact Investing Market Volume (Trillion) Forecast, by Application 2020 & 2033
Frequently Asked Questions
1. What is the projected Compound Annual Growth Rate (CAGR) of the Impact Investing Market?
The projected CAGR is approximately 7.17%.
2. Which companies are prominent players in the Impact Investing Market?
Key companies in the market include Vital Capital, BlueOrchard Finance Ltd, BlackRock Inc, Goldman Sachs, Bain Capital LP, Morgan Stanley, Prudential Financial Inc, Manulife Investment Management Holdings (Canada) Inc, Leapfrog Investments, Community Investment Management LLC**List Not Exhaustive.
3. What are the main segments of the Impact Investing Market?
The market segments include Type, End User.
4. Can you provide details about the market size?
The market size is estimated to be USD 1.33 Million as of 2022.
5. What are some drivers contributing to market growth?
Growing Awareness of Environmental and Social Issues is Fueling the Desire for Impact Investment; Rising Interest from Traditional Not-for-Profit Fund Managers.
6. What are the notable trends driving market growth?
Rising Investments from Institutional Investors.
7. Are there any restraints impacting market growth?
Growing Awareness of Environmental and Social Issues is Fueling the Desire for Impact Investment; Rising Interest from Traditional Not-for-Profit Fund Managers.
8. Can you provide examples of recent developments in the market?
January 2024: BlackRock Inc. and Global Infrastructure Partners (GIP), a prominent independent manager of infrastructure funds, jointly announced an agreement. As per this agreement, BlackRock would acquire GIP for a total value of USD 3 billion in cash and roughly 12 million shares of BlackRock's common stock.
9. What pricing options are available for accessing the report?
Pricing options include single-user, multi-user, and enterprise licenses priced at USD 3800, USD 4500, and USD 5800 respectively.
10. Is the market size provided in terms of value or volume?
The market size is provided in terms of value, measured in Million and volume, measured in Trillion.
11. Are there any specific market keywords associated with the report?
Yes, the market keyword associated with the report is "Impact Investing Market," which aids in identifying and referencing the specific market segment covered.
12. How do I determine which pricing option suits my needs best?
The pricing options vary based on user requirements and access needs. Individual users may opt for single-user licenses, while businesses requiring broader access may choose multi-user or enterprise licenses for cost-effective access to the report.
13. Are there any additional resources or data provided in the Impact Investing Market report?
While the report offers comprehensive insights, it's advisable to review the specific contents or supplementary materials provided to ascertain if additional resources or data are available.
14. How can I stay updated on further developments or reports in the Impact Investing Market?
To stay informed about further developments, trends, and reports in the Impact Investing Market, consider subscribing to industry newsletters, following relevant companies and organizations, or regularly checking reputable industry news sources and publications.
Methodology
Step 1 - Identification of Relevant Samples Size from Population Database


Step 2 - Approaches for Defining Global Market Size (Value, Volume* & Price*)

Note*: In applicable scenarios
Step 3 - Data Sources
Primary Research
- Web Analytics
- Survey Reports
- Research Institute
- Latest Research Reports
- Opinion Leaders
Secondary Research
- Annual Reports
- White Paper
- Latest Press Release
- Industry Association
- Paid Database
- Investor Presentations

Step 4 - Data Triangulation
Involves using different sources of information in order to increase the validity of a study
These sources are likely to be stakeholders in a program - participants, other researchers, program staff, other community members, and so on.
Then we put all data in single framework & apply various statistical tools to find out the dynamic on the market.
During the analysis stage, feedback from the stakeholder groups would be compared to determine areas of agreement as well as areas of divergence