
Key Insights
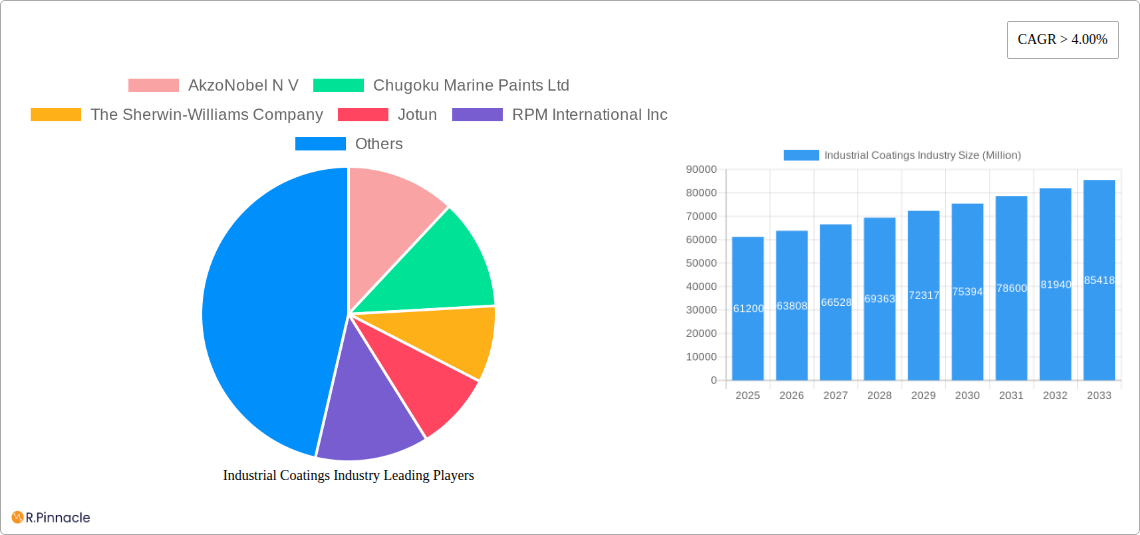
The global industrial coatings market, valued at $61.2 billion in 2025, is projected to experience robust growth, driven by a compound annual growth rate (CAGR) exceeding 4.00% from 2025 to 2033. This expansion is fueled by several key factors. Firstly, the increasing demand for protective coatings across diverse industrial sectors, including automotive, construction, and infrastructure, is a significant driver. Advancements in coating technologies, particularly the rising adoption of water-borne coatings due to their environmentally friendly nature and improved performance characteristics, are further accelerating market growth. The shift towards sustainable practices and stricter environmental regulations are also influencing the demand for eco-friendly coatings. Finally, the expanding global industrialization and infrastructure development projects in emerging economies like those in Asia-Pacific, particularly China and India, provide significant growth opportunities for industrial coatings manufacturers.
However, the market faces certain restraints. Fluctuations in raw material prices, particularly resins, can impact profitability and pricing strategies for manufacturers. Furthermore, intense competition among established players and the emergence of new entrants necessitate continuous innovation and efficient cost management. Nevertheless, the overall market outlook remains positive, driven by ongoing technological advancements, growing industrial activity, and a sustained focus on sustainability within the coatings industry. The market segmentation reveals strong demand across resin types (epoxy, polyurethane, acrylic, polyester being dominant), with water-borne coating technologies gaining traction. Major end-user industries include general industrial applications and protective coatings for diverse infrastructure needs. Key players like AkzoNobel, Sherwin-Williams, and BASF are strategically positioning themselves to capitalize on these market trends through product innovation, expansion into new markets, and strategic mergers and acquisitions.
Industrial Coatings Industry Market Report: 2019-2033
This comprehensive report provides a detailed analysis of the Industrial Coatings market, offering invaluable insights for industry professionals, investors, and strategic decision-makers. With a study period spanning 2019-2033 (base year 2025, forecast period 2025-2033), this report meticulously examines market dynamics, key players, technological advancements, and future growth prospects. The market size is estimated to be in the billions of USD.
Industrial Coatings Industry Market Structure & Innovation Trends
The industrial coatings market is moderately consolidated, with several major players commanding significant market share. AkzoNobel N V, Sherwin-Williams, PPG Industries, Jotun, and BASF SE are among the leading companies, collectively holding an estimated xx% of the global market share in 2025. However, a number of smaller, specialized companies also contribute significantly to market innovation.
- Market Concentration: High, with top 5 players holding xx% market share.
- Innovation Drivers: Growing demand for sustainable coatings, stringent environmental regulations, and advancements in materials science.
- Regulatory Frameworks: Increasingly stringent regulations regarding VOC emissions and hazardous substances are shaping product development.
- Product Substitutes: Limited direct substitutes exist, but alternative technologies and materials are constantly being explored.
- End-User Demographics: The market is driven by diverse end-users across various industries, including automotive, construction, and manufacturing.
- M&A Activities: The past few years have witnessed significant M&A activity, with deals totaling in the hundreds of millions of USD. For example, Sherwin-Williams’ acquisition of Sika AG's European industrial coatings business illustrates the trend of consolidation.
Industrial Coatings Industry Market Dynamics & Trends
The industrial coatings market is experiencing robust growth, driven by a combination of factors. The global market is projected to achieve a CAGR of xx% during the forecast period (2025-2033). This growth is fueled by several key factors, including increasing infrastructure development globally, rising demand from the construction and automotive sectors, and the growing preference for protective and aesthetically pleasing coatings. Technological advancements, such as the development of water-borne coatings and powder coatings, are also contributing to this growth. Market penetration of water-borne coatings is expected to reach xx% by 2033, surpassing solvent-borne coatings. However, pricing pressures and intense competition remain key challenges.
Dominant Regions & Segments in Industrial Coatings Industry
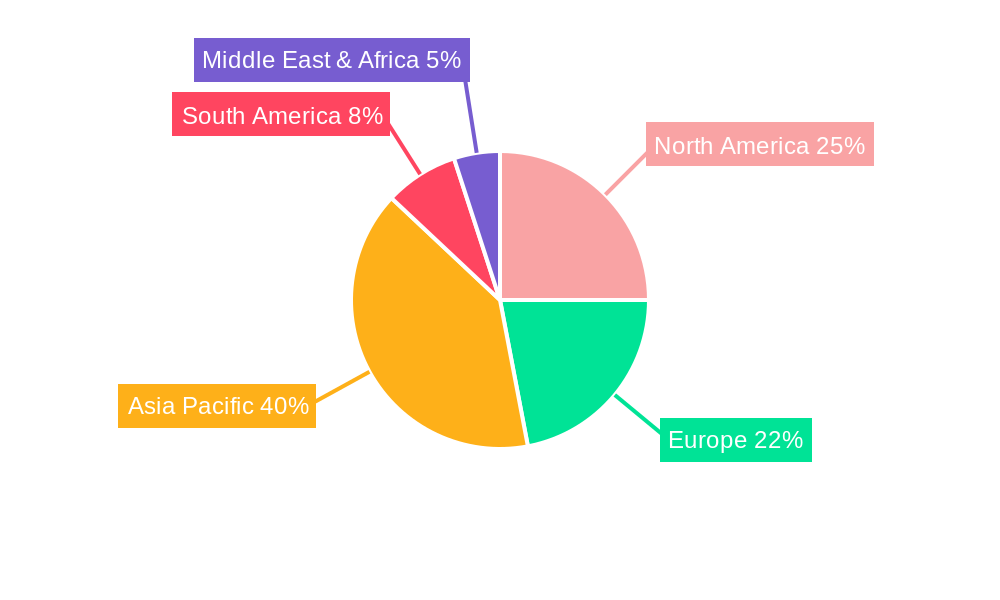
The Asia-Pacific region is currently the dominant market for industrial coatings, driven by rapid industrialization and infrastructure development. Within this region, China and India are particularly significant.
- Resin Segment: Epoxy resins hold the largest market share due to their high performance characteristics, followed by polyurethane and acrylic resins.
- Technology Segment: Water-borne coatings are experiencing faster growth compared to solvent-borne coatings due to increased environmental regulations and sustainability concerns.
- End-user Industry: The general industrial segment holds a significant share, followed by the protective coatings segment which is driven by increasing demand from infrastructure projects.
Key drivers for regional dominance include:
- Economic Policies: Government investments in infrastructure projects significantly boost demand.
- Infrastructure Development: Rapid urbanization and industrial expansion create substantial coating requirements.
Industrial Coatings Industry Product Innovations
Recent innovations include the development of high-performance, eco-friendly coatings with enhanced durability, corrosion resistance, and aesthetic appeal. There's a strong focus on water-borne and powder coatings that meet stricter environmental regulations while delivering superior performance. The incorporation of nanotechnology and advanced materials is further enhancing product properties and market competitiveness.
Report Scope & Segmentation Analysis
This report segments the market by resin type (Epoxy, Polyurethane, Acrylic, Polyester, Other Resins), technology (Water-borne Coatings, Solvent-borne Coatings, Other Technologies), and end-user industry (General Industrial, Protective Coatings). Each segment's growth projection, market size, and competitive dynamics are analyzed comprehensively, offering a granular understanding of the market landscape. The market size for each segment is estimated in the billions of USD.
Key Drivers of Industrial Coatings Industry Growth
Several key factors propel the growth of the industrial coatings industry, including:
- Technological Advancements: Development of sustainable and high-performance coatings.
- Economic Growth: Increased industrialization and infrastructure development in emerging economies.
- Stringent Environmental Regulations: Driving demand for eco-friendly coatings.
Challenges in the Industrial Coatings Industry Sector
The industry faces challenges such as:
- Fluctuating Raw Material Prices: Impacting profitability and pricing strategies.
- Stringent Environmental Regulations: Increasing compliance costs.
- Intense Competition: Requiring constant innovation and cost optimization.
Emerging Opportunities in Industrial Coatings Industry
Emerging opportunities include:
- Growth in Emerging Markets: Untapped potential in developing economies.
- Demand for Specialized Coatings: Expanding applications in niche industries.
- Advancements in Nanotechnology: Enabling the development of high-performance coatings.
Leading Players in the Industrial Coatings Industry Market
- AkzoNobel N V
- Chugoku Marine Paints Ltd
- The Sherwin-Williams Company
- Jotun
- RPM International Inc
- Beckers Group
- BASF SE
- Axalta Coating Systems
- Hempel A/S
- Sika AG
- PPG Industries
- Kansai Paint Co Ltd
- Wacker Chemie AG
- Nippon Paint (NIPSEA GROUP)
Key Developments in Industrial Coatings Industry Industry
- August 2022: PPG announced a USD 11 million investment to expand its powder coatings production capacity in Mexico.
- June 2022: Sherwin-Williams completed the acquisition of Sika AG's European industrial coatings business.
- April 2022: PPG completed the acquisition of Arsonsisi, an industrial coatings company in Italy.
Future Outlook for Industrial Coatings Industry Market
The industrial coatings market is poised for continued growth, driven by ongoing industrialization, infrastructure development, and technological advancements. Strategic investments in research and development, along with mergers and acquisitions, will further shape the market landscape. The focus on sustainable and high-performance coatings will remain a key driver of future growth.
Industrial Coatings Industry Segmentation
-
1. Resin
- 1.1. Epoxy
- 1.2. Polyurethane
- 1.3. Acrylic
- 1.4. Polyester
- 1.5. Other Resins
-
2. Technology
- 2.1. Water-borne Coatings
- 2.2. Solvent-borne Coatings
- 2.3. Other Technologies
-
3. End-user Industry
- 3.1. General Industrial
-
3.2. Protective Coatings
- 3.2.1. Oil and Gas
- 3.2.2. Mining
- 3.2.3. Power
- 3.2.4. Infrastructure
- 3.2.5. Other Protective Coatings
Industrial Coatings Industry Segmentation By Geography
-
1. Asia Pacific
- 1.1. China
- 1.2. India
- 1.3. Japan
- 1.4. South Korea
- 1.5. Rest of Asia Pacific
-
2. North America
- 2.1. United States
- 2.2. Canada
- 2.3. Mexico
-
3. Europe
- 3.1. Germany
- 3.2. United Kingdom
- 3.3. Italy
- 3.4. France
- 3.5. Russia
- 3.6. Rest of Europe
-
4. South America
- 4.1. Brazil
- 4.2. Argentina
- 4.3. Rest of South America
- 5. Middle East
-
6. Saudi Arabia
- 6.1. South Africa
- 6.2. Rest of Middle East
Industrial Coatings Industry REPORT HIGHLIGHTS
| Aspects | Details |
|---|---|
| Study Period | 2019-2033 |
| Base Year | 2024 |
| Estimated Year | 2025 |
| Forecast Period | 2025-2033 |
| Historical Period | 2019-2024 |
| Growth Rate | CAGR of > 4.00% from 2019-2033 |
| Segmentation |
|
Table of Contents
- 1. Introduction
- 1.1. Research Scope
- 1.2. Market Segmentation
- 1.3. Research Methodology
- 1.4. Definitions and Assumptions
- 2. Executive Summary
- 2.1. Introduction
- 3. Market Dynamics
- 3.1. Introduction
- 3.2. Market Drivers
- 3.2.1. Rising Demand for Protective Coatings; Increasing Applications in Oil and Gas Industry
- 3.3. Market Restrains
- 3.3.1. Harmful Environmental Impact Of Solvent-borne Coatings; Impact of COVID-19 Outbreak
- 3.4. Market Trends
- 3.4.1. Increasing Applications in Oil and Gas Industry
- 4. Market Factor Analysis
- 4.1. Porters Five Forces
- 4.2. Supply/Value Chain
- 4.3. PESTEL analysis
- 4.4. Market Entropy
- 4.5. Patent/Trademark Analysis
- 5. Global Industrial Coatings Industry Analysis, Insights and Forecast, 2019-2031
- 5.1. Market Analysis, Insights and Forecast - by Resin
- 5.1.1. Epoxy
- 5.1.2. Polyurethane
- 5.1.3. Acrylic
- 5.1.4. Polyester
- 5.1.5. Other Resins
- 5.2. Market Analysis, Insights and Forecast - by Technology
- 5.2.1. Water-borne Coatings
- 5.2.2. Solvent-borne Coatings
- 5.2.3. Other Technologies
- 5.3. Market Analysis, Insights and Forecast - by End-user Industry
- 5.3.1. General Industrial
- 5.3.2. Protective Coatings
- 5.3.2.1. Oil and Gas
- 5.3.2.2. Mining
- 5.3.2.3. Power
- 5.3.2.4. Infrastructure
- 5.3.2.5. Other Protective Coatings
- 5.4. Market Analysis, Insights and Forecast - by Region
- 5.4.1. Asia Pacific
- 5.4.2. North America
- 5.4.3. Europe
- 5.4.4. South America
- 5.4.5. Middle East
- 5.4.6. Saudi Arabia
- 5.1. Market Analysis, Insights and Forecast - by Resin
- 6. Asia Pacific Industrial Coatings Industry Analysis, Insights and Forecast, 2019-2031
- 6.1. Market Analysis, Insights and Forecast - by Resin
- 6.1.1. Epoxy
- 6.1.2. Polyurethane
- 6.1.3. Acrylic
- 6.1.4. Polyester
- 6.1.5. Other Resins
- 6.2. Market Analysis, Insights and Forecast - by Technology
- 6.2.1. Water-borne Coatings
- 6.2.2. Solvent-borne Coatings
- 6.2.3. Other Technologies
- 6.3. Market Analysis, Insights and Forecast - by End-user Industry
- 6.3.1. General Industrial
- 6.3.2. Protective Coatings
- 6.3.2.1. Oil and Gas
- 6.3.2.2. Mining
- 6.3.2.3. Power
- 6.3.2.4. Infrastructure
- 6.3.2.5. Other Protective Coatings
- 6.1. Market Analysis, Insights and Forecast - by Resin
- 7. North America Industrial Coatings Industry Analysis, Insights and Forecast, 2019-2031
- 7.1. Market Analysis, Insights and Forecast - by Resin
- 7.1.1. Epoxy
- 7.1.2. Polyurethane
- 7.1.3. Acrylic
- 7.1.4. Polyester
- 7.1.5. Other Resins
- 7.2. Market Analysis, Insights and Forecast - by Technology
- 7.2.1. Water-borne Coatings
- 7.2.2. Solvent-borne Coatings
- 7.2.3. Other Technologies
- 7.3. Market Analysis, Insights and Forecast - by End-user Industry
- 7.3.1. General Industrial
- 7.3.2. Protective Coatings
- 7.3.2.1. Oil and Gas
- 7.3.2.2. Mining
- 7.3.2.3. Power
- 7.3.2.4. Infrastructure
- 7.3.2.5. Other Protective Coatings
- 7.1. Market Analysis, Insights and Forecast - by Resin
- 8. Europe Industrial Coatings Industry Analysis, Insights and Forecast, 2019-2031
- 8.1. Market Analysis, Insights and Forecast - by Resin
- 8.1.1. Epoxy
- 8.1.2. Polyurethane
- 8.1.3. Acrylic
- 8.1.4. Polyester
- 8.1.5. Other Resins
- 8.2. Market Analysis, Insights and Forecast - by Technology
- 8.2.1. Water-borne Coatings
- 8.2.2. Solvent-borne Coatings
- 8.2.3. Other Technologies
- 8.3. Market Analysis, Insights and Forecast - by End-user Industry
- 8.3.1. General Industrial
- 8.3.2. Protective Coatings
- 8.3.2.1. Oil and Gas
- 8.3.2.2. Mining
- 8.3.2.3. Power
- 8.3.2.4. Infrastructure
- 8.3.2.5. Other Protective Coatings
- 8.1. Market Analysis, Insights and Forecast - by Resin
- 9. South America Industrial Coatings Industry Analysis, Insights and Forecast, 2019-2031
- 9.1. Market Analysis, Insights and Forecast - by Resin
- 9.1.1. Epoxy
- 9.1.2. Polyurethane
- 9.1.3. Acrylic
- 9.1.4. Polyester
- 9.1.5. Other Resins
- 9.2. Market Analysis, Insights and Forecast - by Technology
- 9.2.1. Water-borne Coatings
- 9.2.2. Solvent-borne Coatings
- 9.2.3. Other Technologies
- 9.3. Market Analysis, Insights and Forecast - by End-user Industry
- 9.3.1. General Industrial
- 9.3.2. Protective Coatings
- 9.3.2.1. Oil and Gas
- 9.3.2.2. Mining
- 9.3.2.3. Power
- 9.3.2.4. Infrastructure
- 9.3.2.5. Other Protective Coatings
- 9.1. Market Analysis, Insights and Forecast - by Resin
- 10. Middle East Industrial Coatings Industry Analysis, Insights and Forecast, 2019-2031
- 10.1. Market Analysis, Insights and Forecast - by Resin
- 10.1.1. Epoxy
- 10.1.2. Polyurethane
- 10.1.3. Acrylic
- 10.1.4. Polyester
- 10.1.5. Other Resins
- 10.2. Market Analysis, Insights and Forecast - by Technology
- 10.2.1. Water-borne Coatings
- 10.2.2. Solvent-borne Coatings
- 10.2.3. Other Technologies
- 10.3. Market Analysis, Insights and Forecast - by End-user Industry
- 10.3.1. General Industrial
- 10.3.2. Protective Coatings
- 10.3.2.1. Oil and Gas
- 10.3.2.2. Mining
- 10.3.2.3. Power
- 10.3.2.4. Infrastructure
- 10.3.2.5. Other Protective Coatings
- 10.1. Market Analysis, Insights and Forecast - by Resin
- 11. Saudi Arabia Industrial Coatings Industry Analysis, Insights and Forecast, 2019-2031
- 11.1. Market Analysis, Insights and Forecast - by Resin
- 11.1.1. Epoxy
- 11.1.2. Polyurethane
- 11.1.3. Acrylic
- 11.1.4. Polyester
- 11.1.5. Other Resins
- 11.2. Market Analysis, Insights and Forecast - by Technology
- 11.2.1. Water-borne Coatings
- 11.2.2. Solvent-borne Coatings
- 11.2.3. Other Technologies
- 11.3. Market Analysis, Insights and Forecast - by End-user Industry
- 11.3.1. General Industrial
- 11.3.2. Protective Coatings
- 11.3.2.1. Oil and Gas
- 11.3.2.2. Mining
- 11.3.2.3. Power
- 11.3.2.4. Infrastructure
- 11.3.2.5. Other Protective Coatings
- 11.1. Market Analysis, Insights and Forecast - by Resin
- 12. Asia Pacific Industrial Coatings Industry Analysis, Insights and Forecast, 2019-2031
- 12.1. Market Analysis, Insights and Forecast - By Country/Sub-region
- 12.1.1 China
- 12.1.2 India
- 12.1.3 Japan
- 12.1.4 South Korea
- 12.1.5 Rest of Asia Pacific
- 13. North America Industrial Coatings Industry Analysis, Insights and Forecast, 2019-2031
- 13.1. Market Analysis, Insights and Forecast - By Country/Sub-region
- 13.1.1 United States
- 13.1.2 Canada
- 13.1.3 Mexico
- 14. Europe Industrial Coatings Industry Analysis, Insights and Forecast, 2019-2031
- 14.1. Market Analysis, Insights and Forecast - By Country/Sub-region
- 14.1.1 Germany
- 14.1.2 United Kingdom
- 14.1.3 Italy
- 14.1.4 France
- 14.1.5 Russia
- 14.1.6 Rest of Europe
- 15. South America Industrial Coatings Industry Analysis, Insights and Forecast, 2019-2031
- 15.1. Market Analysis, Insights and Forecast - By Country/Sub-region
- 15.1.1 Brazil
- 15.1.2 Argentina
- 15.1.3 Rest of South America
- 16. Middle East Industrial Coatings Industry Analysis, Insights and Forecast, 2019-2031
- 16.1. Market Analysis, Insights and Forecast - By Country/Sub-region
- 16.1.1 Middle East
- 16.1.2 Africa
- 17. Saudi Arabia Industrial Coatings Industry Analysis, Insights and Forecast, 2019-2031
- 17.1. Market Analysis, Insights and Forecast - By Country/Sub-region
- 17.1.1 South Africa
- 17.1.2 Rest of Middle East
- 18. Competitive Analysis
- 18.1. Global Market Share Analysis 2024
- 18.2. Company Profiles
- 18.2.1 AkzoNobel N V
- 18.2.1.1. Overview
- 18.2.1.2. Products
- 18.2.1.3. SWOT Analysis
- 18.2.1.4. Recent Developments
- 18.2.1.5. Financials (Based on Availability)
- 18.2.2 Chugoku Marine Paints Ltd
- 18.2.2.1. Overview
- 18.2.2.2. Products
- 18.2.2.3. SWOT Analysis
- 18.2.2.4. Recent Developments
- 18.2.2.5. Financials (Based on Availability)
- 18.2.3 The Sherwin-Williams Company
- 18.2.3.1. Overview
- 18.2.3.2. Products
- 18.2.3.3. SWOT Analysis
- 18.2.3.4. Recent Developments
- 18.2.3.5. Financials (Based on Availability)
- 18.2.4 Jotun
- 18.2.4.1. Overview
- 18.2.4.2. Products
- 18.2.4.3. SWOT Analysis
- 18.2.4.4. Recent Developments
- 18.2.4.5. Financials (Based on Availability)
- 18.2.5 RPM International Inc
- 18.2.5.1. Overview
- 18.2.5.2. Products
- 18.2.5.3. SWOT Analysis
- 18.2.5.4. Recent Developments
- 18.2.5.5. Financials (Based on Availability)
- 18.2.6 Beckers Group
- 18.2.6.1. Overview
- 18.2.6.2. Products
- 18.2.6.3. SWOT Analysis
- 18.2.6.4. Recent Developments
- 18.2.6.5. Financials (Based on Availability)
- 18.2.7 BASF SE
- 18.2.7.1. Overview
- 18.2.7.2. Products
- 18.2.7.3. SWOT Analysis
- 18.2.7.4. Recent Developments
- 18.2.7.5. Financials (Based on Availability)
- 18.2.8 Axalta Coating Systems
- 18.2.8.1. Overview
- 18.2.8.2. Products
- 18.2.8.3. SWOT Analysis
- 18.2.8.4. Recent Developments
- 18.2.8.5. Financials (Based on Availability)
- 18.2.9 Hempel A/S
- 18.2.9.1. Overview
- 18.2.9.2. Products
- 18.2.9.3. SWOT Analysis
- 18.2.9.4. Recent Developments
- 18.2.9.5. Financials (Based on Availability)
- 18.2.10 Sika AG
- 18.2.10.1. Overview
- 18.2.10.2. Products
- 18.2.10.3. SWOT Analysis
- 18.2.10.4. Recent Developments
- 18.2.10.5. Financials (Based on Availability)
- 18.2.11 PPG Industries
- 18.2.11.1. Overview
- 18.2.11.2. Products
- 18.2.11.3. SWOT Analysis
- 18.2.11.4. Recent Developments
- 18.2.11.5. Financials (Based on Availability)
- 18.2.12 Kansai Paint Co Ltd
- 18.2.12.1. Overview
- 18.2.12.2. Products
- 18.2.12.3. SWOT Analysis
- 18.2.12.4. Recent Developments
- 18.2.12.5. Financials (Based on Availability)
- 18.2.13 Wacker Chemie AG*List Not Exhaustive
- 18.2.13.1. Overview
- 18.2.13.2. Products
- 18.2.13.3. SWOT Analysis
- 18.2.13.4. Recent Developments
- 18.2.13.5. Financials (Based on Availability)
- 18.2.14 Nippon Paint ( NIPSEA GROUP)
- 18.2.14.1. Overview
- 18.2.14.2. Products
- 18.2.14.3. SWOT Analysis
- 18.2.14.4. Recent Developments
- 18.2.14.5. Financials (Based on Availability)
- 18.2.1 AkzoNobel N V
List of Figures
- Figure 1: Global Industrial Coatings Industry Revenue Breakdown (Million, %) by Region 2024 & 2032
- Figure 2: Global Industrial Coatings Industry Volume Breakdown (liter , %) by Region 2024 & 2032
- Figure 3: Asia Pacific Industrial Coatings Industry Revenue (Million), by Country 2024 & 2032
- Figure 4: Asia Pacific Industrial Coatings Industry Volume (liter ), by Country 2024 & 2032
- Figure 5: Asia Pacific Industrial Coatings Industry Revenue Share (%), by Country 2024 & 2032
- Figure 6: Asia Pacific Industrial Coatings Industry Volume Share (%), by Country 2024 & 2032
- Figure 7: North America Industrial Coatings Industry Revenue (Million), by Country 2024 & 2032
- Figure 8: North America Industrial Coatings Industry Volume (liter ), by Country 2024 & 2032
- Figure 9: North America Industrial Coatings Industry Revenue Share (%), by Country 2024 & 2032
- Figure 10: North America Industrial Coatings Industry Volume Share (%), by Country 2024 & 2032
- Figure 11: Europe Industrial Coatings Industry Revenue (Million), by Country 2024 & 2032
- Figure 12: Europe Industrial Coatings Industry Volume (liter ), by Country 2024 & 2032
- Figure 13: Europe Industrial Coatings Industry Revenue Share (%), by Country 2024 & 2032
- Figure 14: Europe Industrial Coatings Industry Volume Share (%), by Country 2024 & 2032
- Figure 15: South America Industrial Coatings Industry Revenue (Million), by Country 2024 & 2032
- Figure 16: South America Industrial Coatings Industry Volume (liter ), by Country 2024 & 2032
- Figure 17: South America Industrial Coatings Industry Revenue Share (%), by Country 2024 & 2032
- Figure 18: South America Industrial Coatings Industry Volume Share (%), by Country 2024 & 2032
- Figure 19: Middle East Industrial Coatings Industry Revenue (Million), by Country 2024 & 2032
- Figure 20: Middle East Industrial Coatings Industry Volume (liter ), by Country 2024 & 2032
- Figure 21: Middle East Industrial Coatings Industry Revenue Share (%), by Country 2024 & 2032
- Figure 22: Middle East Industrial Coatings Industry Volume Share (%), by Country 2024 & 2032
- Figure 23: Saudi Arabia Industrial Coatings Industry Revenue (Million), by Country 2024 & 2032
- Figure 24: Saudi Arabia Industrial Coatings Industry Volume (liter ), by Country 2024 & 2032
- Figure 25: Saudi Arabia Industrial Coatings Industry Revenue Share (%), by Country 2024 & 2032
- Figure 26: Saudi Arabia Industrial Coatings Industry Volume Share (%), by Country 2024 & 2032
- Figure 27: Asia Pacific Industrial Coatings Industry Revenue (Million), by Resin 2024 & 2032
- Figure 28: Asia Pacific Industrial Coatings Industry Volume (liter ), by Resin 2024 & 2032
- Figure 29: Asia Pacific Industrial Coatings Industry Revenue Share (%), by Resin 2024 & 2032
- Figure 30: Asia Pacific Industrial Coatings Industry Volume Share (%), by Resin 2024 & 2032
- Figure 31: Asia Pacific Industrial Coatings Industry Revenue (Million), by Technology 2024 & 2032
- Figure 32: Asia Pacific Industrial Coatings Industry Volume (liter ), by Technology 2024 & 2032
- Figure 33: Asia Pacific Industrial Coatings Industry Revenue Share (%), by Technology 2024 & 2032
- Figure 34: Asia Pacific Industrial Coatings Industry Volume Share (%), by Technology 2024 & 2032
- Figure 35: Asia Pacific Industrial Coatings Industry Revenue (Million), by End-user Industry 2024 & 2032
- Figure 36: Asia Pacific Industrial Coatings Industry Volume (liter ), by End-user Industry 2024 & 2032
- Figure 37: Asia Pacific Industrial Coatings Industry Revenue Share (%), by End-user Industry 2024 & 2032
- Figure 38: Asia Pacific Industrial Coatings Industry Volume Share (%), by End-user Industry 2024 & 2032
- Figure 39: Asia Pacific Industrial Coatings Industry Revenue (Million), by Country 2024 & 2032
- Figure 40: Asia Pacific Industrial Coatings Industry Volume (liter ), by Country 2024 & 2032
- Figure 41: Asia Pacific Industrial Coatings Industry Revenue Share (%), by Country 2024 & 2032
- Figure 42: Asia Pacific Industrial Coatings Industry Volume Share (%), by Country 2024 & 2032
- Figure 43: North America Industrial Coatings Industry Revenue (Million), by Resin 2024 & 2032
- Figure 44: North America Industrial Coatings Industry Volume (liter ), by Resin 2024 & 2032
- Figure 45: North America Industrial Coatings Industry Revenue Share (%), by Resin 2024 & 2032
- Figure 46: North America Industrial Coatings Industry Volume Share (%), by Resin 2024 & 2032
- Figure 47: North America Industrial Coatings Industry Revenue (Million), by Technology 2024 & 2032
- Figure 48: North America Industrial Coatings Industry Volume (liter ), by Technology 2024 & 2032
- Figure 49: North America Industrial Coatings Industry Revenue Share (%), by Technology 2024 & 2032
- Figure 50: North America Industrial Coatings Industry Volume Share (%), by Technology 2024 & 2032
- Figure 51: North America Industrial Coatings Industry Revenue (Million), by End-user Industry 2024 & 2032
- Figure 52: North America Industrial Coatings Industry Volume (liter ), by End-user Industry 2024 & 2032
- Figure 53: North America Industrial Coatings Industry Revenue Share (%), by End-user Industry 2024 & 2032
- Figure 54: North America Industrial Coatings Industry Volume Share (%), by End-user Industry 2024 & 2032
- Figure 55: North America Industrial Coatings Industry Revenue (Million), by Country 2024 & 2032
- Figure 56: North America Industrial Coatings Industry Volume (liter ), by Country 2024 & 2032
- Figure 57: North America Industrial Coatings Industry Revenue Share (%), by Country 2024 & 2032
- Figure 58: North America Industrial Coatings Industry Volume Share (%), by Country 2024 & 2032
- Figure 59: Europe Industrial Coatings Industry Revenue (Million), by Resin 2024 & 2032
- Figure 60: Europe Industrial Coatings Industry Volume (liter ), by Resin 2024 & 2032
- Figure 61: Europe Industrial Coatings Industry Revenue Share (%), by Resin 2024 & 2032
- Figure 62: Europe Industrial Coatings Industry Volume Share (%), by Resin 2024 & 2032
- Figure 63: Europe Industrial Coatings Industry Revenue (Million), by Technology 2024 & 2032
- Figure 64: Europe Industrial Coatings Industry Volume (liter ), by Technology 2024 & 2032
- Figure 65: Europe Industrial Coatings Industry Revenue Share (%), by Technology 2024 & 2032
- Figure 66: Europe Industrial Coatings Industry Volume Share (%), by Technology 2024 & 2032
- Figure 67: Europe Industrial Coatings Industry Revenue (Million), by End-user Industry 2024 & 2032
- Figure 68: Europe Industrial Coatings Industry Volume (liter ), by End-user Industry 2024 & 2032
- Figure 69: Europe Industrial Coatings Industry Revenue Share (%), by End-user Industry 2024 & 2032
- Figure 70: Europe Industrial Coatings Industry Volume Share (%), by End-user Industry 2024 & 2032
- Figure 71: Europe Industrial Coatings Industry Revenue (Million), by Country 2024 & 2032
- Figure 72: Europe Industrial Coatings Industry Volume (liter ), by Country 2024 & 2032
- Figure 73: Europe Industrial Coatings Industry Revenue Share (%), by Country 2024 & 2032
- Figure 74: Europe Industrial Coatings Industry Volume Share (%), by Country 2024 & 2032
- Figure 75: South America Industrial Coatings Industry Revenue (Million), by Resin 2024 & 2032
- Figure 76: South America Industrial Coatings Industry Volume (liter ), by Resin 2024 & 2032
- Figure 77: South America Industrial Coatings Industry Revenue Share (%), by Resin 2024 & 2032
- Figure 78: South America Industrial Coatings Industry Volume Share (%), by Resin 2024 & 2032
- Figure 79: South America Industrial Coatings Industry Revenue (Million), by Technology 2024 & 2032
- Figure 80: South America Industrial Coatings Industry Volume (liter ), by Technology 2024 & 2032
- Figure 81: South America Industrial Coatings Industry Revenue Share (%), by Technology 2024 & 2032
- Figure 82: South America Industrial Coatings Industry Volume Share (%), by Technology 2024 & 2032
- Figure 83: South America Industrial Coatings Industry Revenue (Million), by End-user Industry 2024 & 2032
- Figure 84: South America Industrial Coatings Industry Volume (liter ), by End-user Industry 2024 & 2032
- Figure 85: South America Industrial Coatings Industry Revenue Share (%), by End-user Industry 2024 & 2032
- Figure 86: South America Industrial Coatings Industry Volume Share (%), by End-user Industry 2024 & 2032
- Figure 87: South America Industrial Coatings Industry Revenue (Million), by Country 2024 & 2032
- Figure 88: South America Industrial Coatings Industry Volume (liter ), by Country 2024 & 2032
- Figure 89: South America Industrial Coatings Industry Revenue Share (%), by Country 2024 & 2032
- Figure 90: South America Industrial Coatings Industry Volume Share (%), by Country 2024 & 2032
- Figure 91: Middle East Industrial Coatings Industry Revenue (Million), by Resin 2024 & 2032
- Figure 92: Middle East Industrial Coatings Industry Volume (liter ), by Resin 2024 & 2032
- Figure 93: Middle East Industrial Coatings Industry Revenue Share (%), by Resin 2024 & 2032
- Figure 94: Middle East Industrial Coatings Industry Volume Share (%), by Resin 2024 & 2032
- Figure 95: Middle East Industrial Coatings Industry Revenue (Million), by Technology 2024 & 2032
- Figure 96: Middle East Industrial Coatings Industry Volume (liter ), by Technology 2024 & 2032
- Figure 97: Middle East Industrial Coatings Industry Revenue Share (%), by Technology 2024 & 2032
- Figure 98: Middle East Industrial Coatings Industry Volume Share (%), by Technology 2024 & 2032
- Figure 99: Middle East Industrial Coatings Industry Revenue (Million), by End-user Industry 2024 & 2032
- Figure 100: Middle East Industrial Coatings Industry Volume (liter ), by End-user Industry 2024 & 2032
- Figure 101: Middle East Industrial Coatings Industry Revenue Share (%), by End-user Industry 2024 & 2032
- Figure 102: Middle East Industrial Coatings Industry Volume Share (%), by End-user Industry 2024 & 2032
- Figure 103: Middle East Industrial Coatings Industry Revenue (Million), by Country 2024 & 2032
- Figure 104: Middle East Industrial Coatings Industry Volume (liter ), by Country 2024 & 2032
- Figure 105: Middle East Industrial Coatings Industry Revenue Share (%), by Country 2024 & 2032
- Figure 106: Middle East Industrial Coatings Industry Volume Share (%), by Country 2024 & 2032
- Figure 107: Saudi Arabia Industrial Coatings Industry Revenue (Million), by Resin 2024 & 2032
- Figure 108: Saudi Arabia Industrial Coatings Industry Volume (liter ), by Resin 2024 & 2032
- Figure 109: Saudi Arabia Industrial Coatings Industry Revenue Share (%), by Resin 2024 & 2032
- Figure 110: Saudi Arabia Industrial Coatings Industry Volume Share (%), by Resin 2024 & 2032
- Figure 111: Saudi Arabia Industrial Coatings Industry Revenue (Million), by Technology 2024 & 2032
- Figure 112: Saudi Arabia Industrial Coatings Industry Volume (liter ), by Technology 2024 & 2032
- Figure 113: Saudi Arabia Industrial Coatings Industry Revenue Share (%), by Technology 2024 & 2032
- Figure 114: Saudi Arabia Industrial Coatings Industry Volume Share (%), by Technology 2024 & 2032
- Figure 115: Saudi Arabia Industrial Coatings Industry Revenue (Million), by End-user Industry 2024 & 2032
- Figure 116: Saudi Arabia Industrial Coatings Industry Volume (liter ), by End-user Industry 2024 & 2032
- Figure 117: Saudi Arabia Industrial Coatings Industry Revenue Share (%), by End-user Industry 2024 & 2032
- Figure 118: Saudi Arabia Industrial Coatings Industry Volume Share (%), by End-user Industry 2024 & 2032
- Figure 119: Saudi Arabia Industrial Coatings Industry Revenue (Million), by Country 2024 & 2032
- Figure 120: Saudi Arabia Industrial Coatings Industry Volume (liter ), by Country 2024 & 2032
- Figure 121: Saudi Arabia Industrial Coatings Industry Revenue Share (%), by Country 2024 & 2032
- Figure 122: Saudi Arabia Industrial Coatings Industry Volume Share (%), by Country 2024 & 2032
List of Tables
- Table 1: Global Industrial Coatings Industry Revenue Million Forecast, by Region 2019 & 2032
- Table 2: Global Industrial Coatings Industry Volume liter Forecast, by Region 2019 & 2032
- Table 3: Global Industrial Coatings Industry Revenue Million Forecast, by Resin 2019 & 2032
- Table 4: Global Industrial Coatings Industry Volume liter Forecast, by Resin 2019 & 2032
- Table 5: Global Industrial Coatings Industry Revenue Million Forecast, by Technology 2019 & 2032
- Table 6: Global Industrial Coatings Industry Volume liter Forecast, by Technology 2019 & 2032
- Table 7: Global Industrial Coatings Industry Revenue Million Forecast, by End-user Industry 2019 & 2032
- Table 8: Global Industrial Coatings Industry Volume liter Forecast, by End-user Industry 2019 & 2032
- Table 9: Global Industrial Coatings Industry Revenue Million Forecast, by Region 2019 & 2032
- Table 10: Global Industrial Coatings Industry Volume liter Forecast, by Region 2019 & 2032
- Table 11: Global Industrial Coatings Industry Revenue Million Forecast, by Country 2019 & 2032
- Table 12: Global Industrial Coatings Industry Volume liter Forecast, by Country 2019 & 2032
- Table 13: China Industrial Coatings Industry Revenue (Million) Forecast, by Application 2019 & 2032
- Table 14: China Industrial Coatings Industry Volume (liter ) Forecast, by Application 2019 & 2032
- Table 15: India Industrial Coatings Industry Revenue (Million) Forecast, by Application 2019 & 2032
- Table 16: India Industrial Coatings Industry Volume (liter ) Forecast, by Application 2019 & 2032
- Table 17: Japan Industrial Coatings Industry Revenue (Million) Forecast, by Application 2019 & 2032
- Table 18: Japan Industrial Coatings Industry Volume (liter ) Forecast, by Application 2019 & 2032
- Table 19: South Korea Industrial Coatings Industry Revenue (Million) Forecast, by Application 2019 & 2032
- Table 20: South Korea Industrial Coatings Industry Volume (liter ) Forecast, by Application 2019 & 2032
- Table 21: Rest of Asia Pacific Industrial Coatings Industry Revenue (Million) Forecast, by Application 2019 & 2032
- Table 22: Rest of Asia Pacific Industrial Coatings Industry Volume (liter ) Forecast, by Application 2019 & 2032
- Table 23: Global Industrial Coatings Industry Revenue Million Forecast, by Country 2019 & 2032
- Table 24: Global Industrial Coatings Industry Volume liter Forecast, by Country 2019 & 2032
- Table 25: United States Industrial Coatings Industry Revenue (Million) Forecast, by Application 2019 & 2032
- Table 26: United States Industrial Coatings Industry Volume (liter ) Forecast, by Application 2019 & 2032
- Table 27: Canada Industrial Coatings Industry Revenue (Million) Forecast, by Application 2019 & 2032
- Table 28: Canada Industrial Coatings Industry Volume (liter ) Forecast, by Application 2019 & 2032
- Table 29: Mexico Industrial Coatings Industry Revenue (Million) Forecast, by Application 2019 & 2032
- Table 30: Mexico Industrial Coatings Industry Volume (liter ) Forecast, by Application 2019 & 2032
- Table 31: Global Industrial Coatings Industry Revenue Million Forecast, by Country 2019 & 2032
- Table 32: Global Industrial Coatings Industry Volume liter Forecast, by Country 2019 & 2032
- Table 33: Germany Industrial Coatings Industry Revenue (Million) Forecast, by Application 2019 & 2032
- Table 34: Germany Industrial Coatings Industry Volume (liter ) Forecast, by Application 2019 & 2032
- Table 35: United Kingdom Industrial Coatings Industry Revenue (Million) Forecast, by Application 2019 & 2032
- Table 36: United Kingdom Industrial Coatings Industry Volume (liter ) Forecast, by Application 2019 & 2032
- Table 37: Italy Industrial Coatings Industry Revenue (Million) Forecast, by Application 2019 & 2032
- Table 38: Italy Industrial Coatings Industry Volume (liter ) Forecast, by Application 2019 & 2032
- Table 39: France Industrial Coatings Industry Revenue (Million) Forecast, by Application 2019 & 2032
- Table 40: France Industrial Coatings Industry Volume (liter ) Forecast, by Application 2019 & 2032
- Table 41: Russia Industrial Coatings Industry Revenue (Million) Forecast, by Application 2019 & 2032
- Table 42: Russia Industrial Coatings Industry Volume (liter ) Forecast, by Application 2019 & 2032
- Table 43: Rest of Europe Industrial Coatings Industry Revenue (Million) Forecast, by Application 2019 & 2032
- Table 44: Rest of Europe Industrial Coatings Industry Volume (liter ) Forecast, by Application 2019 & 2032
- Table 45: Global Industrial Coatings Industry Revenue Million Forecast, by Country 2019 & 2032
- Table 46: Global Industrial Coatings Industry Volume liter Forecast, by Country 2019 & 2032
- Table 47: Brazil Industrial Coatings Industry Revenue (Million) Forecast, by Application 2019 & 2032
- Table 48: Brazil Industrial Coatings Industry Volume (liter ) Forecast, by Application 2019 & 2032
- Table 49: Argentina Industrial Coatings Industry Revenue (Million) Forecast, by Application 2019 & 2032
- Table 50: Argentina Industrial Coatings Industry Volume (liter ) Forecast, by Application 2019 & 2032
- Table 51: Rest of South America Industrial Coatings Industry Revenue (Million) Forecast, by Application 2019 & 2032
- Table 52: Rest of South America Industrial Coatings Industry Volume (liter ) Forecast, by Application 2019 & 2032
- Table 53: Global Industrial Coatings Industry Revenue Million Forecast, by Country 2019 & 2032
- Table 54: Global Industrial Coatings Industry Volume liter Forecast, by Country 2019 & 2032
- Table 55: Middle East Industrial Coatings Industry Revenue (Million) Forecast, by Application 2019 & 2032
- Table 56: Middle East Industrial Coatings Industry Volume (liter ) Forecast, by Application 2019 & 2032
- Table 57: Africa Industrial Coatings Industry Revenue (Million) Forecast, by Application 2019 & 2032
- Table 58: Africa Industrial Coatings Industry Volume (liter ) Forecast, by Application 2019 & 2032
- Table 59: Global Industrial Coatings Industry Revenue Million Forecast, by Country 2019 & 2032
- Table 60: Global Industrial Coatings Industry Volume liter Forecast, by Country 2019 & 2032
- Table 61: South Africa Industrial Coatings Industry Revenue (Million) Forecast, by Application 2019 & 2032
- Table 62: South Africa Industrial Coatings Industry Volume (liter ) Forecast, by Application 2019 & 2032
- Table 63: Rest of Middle East Industrial Coatings Industry Revenue (Million) Forecast, by Application 2019 & 2032
- Table 64: Rest of Middle East Industrial Coatings Industry Volume (liter ) Forecast, by Application 2019 & 2032
- Table 65: Global Industrial Coatings Industry Revenue Million Forecast, by Resin 2019 & 2032
- Table 66: Global Industrial Coatings Industry Volume liter Forecast, by Resin 2019 & 2032
- Table 67: Global Industrial Coatings Industry Revenue Million Forecast, by Technology 2019 & 2032
- Table 68: Global Industrial Coatings Industry Volume liter Forecast, by Technology 2019 & 2032
- Table 69: Global Industrial Coatings Industry Revenue Million Forecast, by End-user Industry 2019 & 2032
- Table 70: Global Industrial Coatings Industry Volume liter Forecast, by End-user Industry 2019 & 2032
- Table 71: Global Industrial Coatings Industry Revenue Million Forecast, by Country 2019 & 2032
- Table 72: Global Industrial Coatings Industry Volume liter Forecast, by Country 2019 & 2032
- Table 73: China Industrial Coatings Industry Revenue (Million) Forecast, by Application 2019 & 2032
- Table 74: China Industrial Coatings Industry Volume (liter ) Forecast, by Application 2019 & 2032
- Table 75: India Industrial Coatings Industry Revenue (Million) Forecast, by Application 2019 & 2032
- Table 76: India Industrial Coatings Industry Volume (liter ) Forecast, by Application 2019 & 2032
- Table 77: Japan Industrial Coatings Industry Revenue (Million) Forecast, by Application 2019 & 2032
- Table 78: Japan Industrial Coatings Industry Volume (liter ) Forecast, by Application 2019 & 2032
- Table 79: South Korea Industrial Coatings Industry Revenue (Million) Forecast, by Application 2019 & 2032
- Table 80: South Korea Industrial Coatings Industry Volume (liter ) Forecast, by Application 2019 & 2032
- Table 81: Rest of Asia Pacific Industrial Coatings Industry Revenue (Million) Forecast, by Application 2019 & 2032
- Table 82: Rest of Asia Pacific Industrial Coatings Industry Volume (liter ) Forecast, by Application 2019 & 2032
- Table 83: Global Industrial Coatings Industry Revenue Million Forecast, by Resin 2019 & 2032
- Table 84: Global Industrial Coatings Industry Volume liter Forecast, by Resin 2019 & 2032
- Table 85: Global Industrial Coatings Industry Revenue Million Forecast, by Technology 2019 & 2032
- Table 86: Global Industrial Coatings Industry Volume liter Forecast, by Technology 2019 & 2032
- Table 87: Global Industrial Coatings Industry Revenue Million Forecast, by End-user Industry 2019 & 2032
- Table 88: Global Industrial Coatings Industry Volume liter Forecast, by End-user Industry 2019 & 2032
- Table 89: Global Industrial Coatings Industry Revenue Million Forecast, by Country 2019 & 2032
- Table 90: Global Industrial Coatings Industry Volume liter Forecast, by Country 2019 & 2032
- Table 91: United States Industrial Coatings Industry Revenue (Million) Forecast, by Application 2019 & 2032
- Table 92: United States Industrial Coatings Industry Volume (liter ) Forecast, by Application 2019 & 2032
- Table 93: Canada Industrial Coatings Industry Revenue (Million) Forecast, by Application 2019 & 2032
- Table 94: Canada Industrial Coatings Industry Volume (liter ) Forecast, by Application 2019 & 2032
- Table 95: Mexico Industrial Coatings Industry Revenue (Million) Forecast, by Application 2019 & 2032
- Table 96: Mexico Industrial Coatings Industry Volume (liter ) Forecast, by Application 2019 & 2032
- Table 97: Global Industrial Coatings Industry Revenue Million Forecast, by Resin 2019 & 2032
- Table 98: Global Industrial Coatings Industry Volume liter Forecast, by Resin 2019 & 2032
- Table 99: Global Industrial Coatings Industry Revenue Million Forecast, by Technology 2019 & 2032
- Table 100: Global Industrial Coatings Industry Volume liter Forecast, by Technology 2019 & 2032
- Table 101: Global Industrial Coatings Industry Revenue Million Forecast, by End-user Industry 2019 & 2032
- Table 102: Global Industrial Coatings Industry Volume liter Forecast, by End-user Industry 2019 & 2032
- Table 103: Global Industrial Coatings Industry Revenue Million Forecast, by Country 2019 & 2032
- Table 104: Global Industrial Coatings Industry Volume liter Forecast, by Country 2019 & 2032
- Table 105: Germany Industrial Coatings Industry Revenue (Million) Forecast, by Application 2019 & 2032
- Table 106: Germany Industrial Coatings Industry Volume (liter ) Forecast, by Application 2019 & 2032
- Table 107: United Kingdom Industrial Coatings Industry Revenue (Million) Forecast, by Application 2019 & 2032
- Table 108: United Kingdom Industrial Coatings Industry Volume (liter ) Forecast, by Application 2019 & 2032
- Table 109: Italy Industrial Coatings Industry Revenue (Million) Forecast, by Application 2019 & 2032
- Table 110: Italy Industrial Coatings Industry Volume (liter ) Forecast, by Application 2019 & 2032
- Table 111: France Industrial Coatings Industry Revenue (Million) Forecast, by Application 2019 & 2032
- Table 112: France Industrial Coatings Industry Volume (liter ) Forecast, by Application 2019 & 2032
- Table 113: Russia Industrial Coatings Industry Revenue (Million) Forecast, by Application 2019 & 2032
- Table 114: Russia Industrial Coatings Industry Volume (liter ) Forecast, by Application 2019 & 2032
- Table 115: Rest of Europe Industrial Coatings Industry Revenue (Million) Forecast, by Application 2019 & 2032
- Table 116: Rest of Europe Industrial Coatings Industry Volume (liter ) Forecast, by Application 2019 & 2032
- Table 117: Global Industrial Coatings Industry Revenue Million Forecast, by Resin 2019 & 2032
- Table 118: Global Industrial Coatings Industry Volume liter Forecast, by Resin 2019 & 2032
- Table 119: Global Industrial Coatings Industry Revenue Million Forecast, by Technology 2019 & 2032
- Table 120: Global Industrial Coatings Industry Volume liter Forecast, by Technology 2019 & 2032
- Table 121: Global Industrial Coatings Industry Revenue Million Forecast, by End-user Industry 2019 & 2032
- Table 122: Global Industrial Coatings Industry Volume liter Forecast, by End-user Industry 2019 & 2032
- Table 123: Global Industrial Coatings Industry Revenue Million Forecast, by Country 2019 & 2032
- Table 124: Global Industrial Coatings Industry Volume liter Forecast, by Country 2019 & 2032
- Table 125: Brazil Industrial Coatings Industry Revenue (Million) Forecast, by Application 2019 & 2032
- Table 126: Brazil Industrial Coatings Industry Volume (liter ) Forecast, by Application 2019 & 2032
- Table 127: Argentina Industrial Coatings Industry Revenue (Million) Forecast, by Application 2019 & 2032
- Table 128: Argentina Industrial Coatings Industry Volume (liter ) Forecast, by Application 2019 & 2032
- Table 129: Rest of South America Industrial Coatings Industry Revenue (Million) Forecast, by Application 2019 & 2032
- Table 130: Rest of South America Industrial Coatings Industry Volume (liter ) Forecast, by Application 2019 & 2032
- Table 131: Global Industrial Coatings Industry Revenue Million Forecast, by Resin 2019 & 2032
- Table 132: Global Industrial Coatings Industry Volume liter Forecast, by Resin 2019 & 2032
- Table 133: Global Industrial Coatings Industry Revenue Million Forecast, by Technology 2019 & 2032
- Table 134: Global Industrial Coatings Industry Volume liter Forecast, by Technology 2019 & 2032
- Table 135: Global Industrial Coatings Industry Revenue Million Forecast, by End-user Industry 2019 & 2032
- Table 136: Global Industrial Coatings Industry Volume liter Forecast, by End-user Industry 2019 & 2032
- Table 137: Global Industrial Coatings Industry Revenue Million Forecast, by Country 2019 & 2032
- Table 138: Global Industrial Coatings Industry Volume liter Forecast, by Country 2019 & 2032
- Table 139: Global Industrial Coatings Industry Revenue Million Forecast, by Resin 2019 & 2032
- Table 140: Global Industrial Coatings Industry Volume liter Forecast, by Resin 2019 & 2032
- Table 141: Global Industrial Coatings Industry Revenue Million Forecast, by Technology 2019 & 2032
- Table 142: Global Industrial Coatings Industry Volume liter Forecast, by Technology 2019 & 2032
- Table 143: Global Industrial Coatings Industry Revenue Million Forecast, by End-user Industry 2019 & 2032
- Table 144: Global Industrial Coatings Industry Volume liter Forecast, by End-user Industry 2019 & 2032
- Table 145: Global Industrial Coatings Industry Revenue Million Forecast, by Country 2019 & 2032
- Table 146: Global Industrial Coatings Industry Volume liter Forecast, by Country 2019 & 2032
- Table 147: South Africa Industrial Coatings Industry Revenue (Million) Forecast, by Application 2019 & 2032
- Table 148: South Africa Industrial Coatings Industry Volume (liter ) Forecast, by Application 2019 & 2032
- Table 149: Rest of Middle East Industrial Coatings Industry Revenue (Million) Forecast, by Application 2019 & 2032
- Table 150: Rest of Middle East Industrial Coatings Industry Volume (liter ) Forecast, by Application 2019 & 2032
Frequently Asked Questions
1. What is the projected Compound Annual Growth Rate (CAGR) of the Industrial Coatings Industry?
The projected CAGR is approximately > 4.00%.
2. Which companies are prominent players in the Industrial Coatings Industry?
Key companies in the market include AkzoNobel N V, Chugoku Marine Paints Ltd, The Sherwin-Williams Company, Jotun, RPM International Inc, Beckers Group, BASF SE, Axalta Coating Systems, Hempel A/S, Sika AG, PPG Industries, Kansai Paint Co Ltd, Wacker Chemie AG*List Not Exhaustive, Nippon Paint ( NIPSEA GROUP).
3. What are the main segments of the Industrial Coatings Industry?
The market segments include Resin, Technology, End-user Industry.
4. Can you provide details about the market size?
The market size is estimated to be USD 61200 Million as of 2022.
5. What are some drivers contributing to market growth?
Rising Demand for Protective Coatings; Increasing Applications in Oil and Gas Industry.
6. What are the notable trends driving market growth?
Increasing Applications in Oil and Gas Industry.
7. Are there any restraints impacting market growth?
Harmful Environmental Impact Of Solvent-borne Coatings; Impact of COVID-19 Outbreak.
8. Can you provide examples of recent developments in the market?
August 2022: PPG said it would spend USD 11 million to double the amount of powder coatings it can make at its plant in San Juan del Rio, Mexico.The project to expand should be done by the middle of 2023. This will allow the plant to meet the expected demand for powder coatings in Mexico in the future.
9. What pricing options are available for accessing the report?
Pricing options include single-user, multi-user, and enterprise licenses priced at USD 4750, USD 5250, and USD 8750 respectively.
10. Is the market size provided in terms of value or volume?
The market size is provided in terms of value, measured in Million and volume, measured in liter .
11. Are there any specific market keywords associated with the report?
Yes, the market keyword associated with the report is "Industrial Coatings Industry," which aids in identifying and referencing the specific market segment covered.
12. How do I determine which pricing option suits my needs best?
The pricing options vary based on user requirements and access needs. Individual users may opt for single-user licenses, while businesses requiring broader access may choose multi-user or enterprise licenses for cost-effective access to the report.
13. Are there any additional resources or data provided in the Industrial Coatings Industry report?
While the report offers comprehensive insights, it's advisable to review the specific contents or supplementary materials provided to ascertain if additional resources or data are available.
14. How can I stay updated on further developments or reports in the Industrial Coatings Industry?
To stay informed about further developments, trends, and reports in the Industrial Coatings Industry, consider subscribing to industry newsletters, following relevant companies and organizations, or regularly checking reputable industry news sources and publications.
Methodology
Step 1 - Identification of Relevant Samples Size from Population Database


Step 2 - Approaches for Defining Global Market Size (Value, Volume* & Price*)

Note*: In applicable scenarios
Step 3 - Data Sources
Primary Research
- Web Analytics
- Survey Reports
- Research Institute
- Latest Research Reports
- Opinion Leaders
Secondary Research
- Annual Reports
- White Paper
- Latest Press Release
- Industry Association
- Paid Database
- Investor Presentations

Step 4 - Data Triangulation
Involves using different sources of information in order to increase the validity of a study
These sources are likely to be stakeholders in a program - participants, other researchers, program staff, other community members, and so on.
Then we put all data in single framework & apply various statistical tools to find out the dynamic on the market.
During the analysis stage, feedback from the stakeholder groups would be compared to determine areas of agreement as well as areas of divergence


