

Key Insights
The global industrial pumps market is projected for robust expansion, with an estimated market size of $48.2 billion in the base year 2025. The market is forecast to grow at a compound annual growth rate (CAGR) of 4.75% between 2025 and 2033. Key growth drivers include the expanding oil and gas sector, increased investment in water and wastewater infrastructure in emerging economies, and rising demand for efficient pumps in the chemical, petrochemical, and power generation industries. Technological advancements, such as energy-efficient and smart pumps with IoT integration, are creating new opportunities. However, restraints such as fluctuating raw material prices, stringent environmental regulations, and potential supply chain disruptions exist. Centrifugal pumps dominate the type segment, while the oil and gas industry is a significant end-user. North America and Europe currently lead, with the Asia-Pacific region expected to experience the fastest growth due to substantial industrialization and infrastructure development in China and India. Major market players, including Danfoss AS, Sulzer Ltd, Ruhrpumpen Group, Flowserve Corporation, and Weir Group PLC, are actively innovating to capture market share.
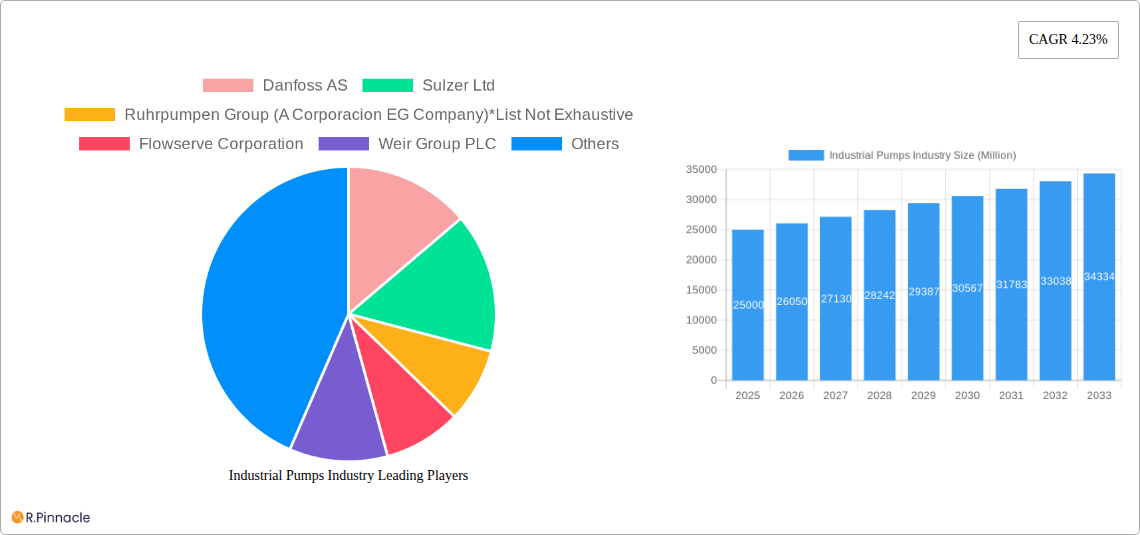
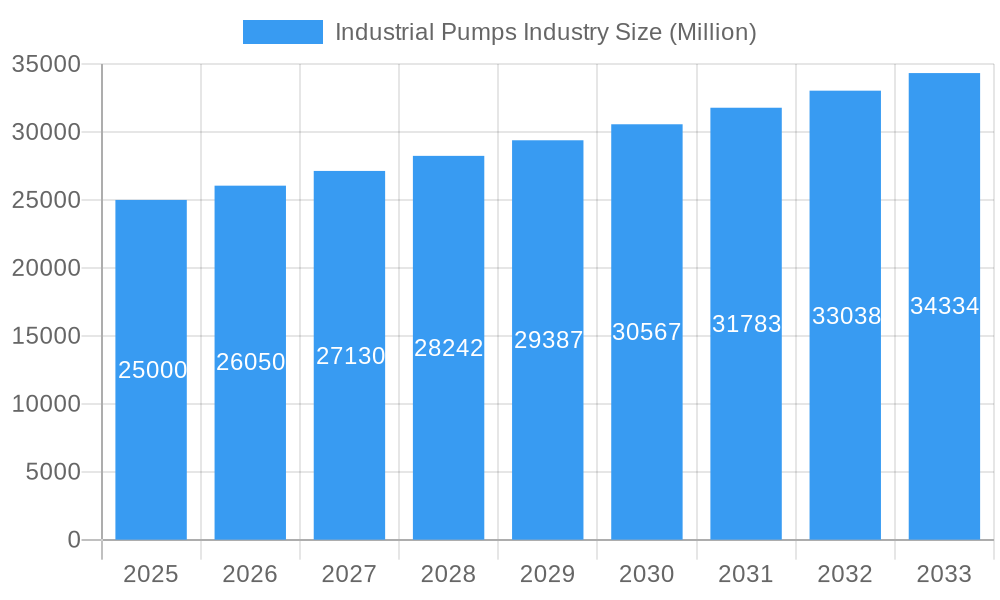
Industrial Pumps Industry Market Size (In Billion)
The future trajectory of the industrial pumps market will be influenced by global economic conditions, government policies supporting sustainable development and infrastructure investment, and the pace of technological innovation. The adoption of Industry 4.0 technologies, such as predictive maintenance and remote monitoring, will further reshape the market. Competitive dynamics among established and emerging players will define market structure. Navigating this dynamic market requires careful consideration of these factors for industry participants and investors. Projections indicate significant market size growth by 2033, reflecting sustained expansion.
Industrial Pumps Industry Company Market Share
Industrial Pumps Industry: Market Analysis & Forecast Report (2019-2033)
This comprehensive report provides a detailed analysis of the global industrial pumps market, offering invaluable insights for industry professionals, investors, and strategic decision-makers. With a focus on market dynamics, technological advancements, and competitive landscapes, this report covers the period from 2019 to 2033, featuring a base year of 2025 and a forecast period of 2025-2033. The market is valued at xx Million in 2025 and is projected to reach xx Million by 2033, exhibiting a CAGR of xx%.
Industrial Pumps Industry Market Structure & Innovation Trends
This section analyzes the competitive landscape of the industrial pumps market, encompassing market concentration, innovation drivers, regulatory frameworks, product substitutes, end-user demographics, and mergers & acquisitions (M&A) activities. The market is moderately concentrated, with several key players holding significant market share. However, smaller specialized companies also thrive in niche segments.
- Market Concentration: The top 10 players account for approximately xx% of the global market share in 2025.
- Innovation Drivers: Stringent environmental regulations, increasing demand for energy efficiency, and advancements in materials science are driving innovation in pump design and manufacturing.
- Regulatory Frameworks: Regulations concerning energy consumption, emissions, and safety standards significantly impact the industrial pump market. Compliance costs and technological advancements to meet these regulations are key considerations.
- Product Substitutes: While industrial pumps are essential in numerous applications, alternative technologies like pneumatic systems or advanced fluid handling techniques represent potential substitutes in certain specialized niches. However, their market penetration remains limited.
- End-User Demographics: The primary end-users are spread across various sectors including Oil and Gas, Water and Wastewater, Chemicals and Petrochemicals, Mining, Power Generation, and other industries. The growth of each sector directly impacts the demand for specific types of industrial pumps.
- M&A Activities: The industrial pumps market has witnessed significant M&A activity in recent years, with deal values exceeding xx Million in the period 2019-2024. These activities are driven by consolidation efforts, acquisition of specialized technologies, and expansion into new geographic markets. Examples include [Specific M&A examples with values if available, otherwise state “Specific examples of M&A activity are not publicly available.”].
Industrial Pumps Industry Market Dynamics & Trends
This section delves into the key factors driving market growth, technological disruptions, evolving consumer preferences, and competitive dynamics within the industrial pumps sector. The market is experiencing robust growth, fueled by several factors. Increasing industrialization across emerging economies, coupled with the modernization of existing infrastructure in developed nations, creates a surge in demand for reliable and efficient industrial pumps. Technological advancements, such as the integration of smart sensors and improved automation, are enhancing pump performance and reducing operational costs. Further, the stringent environmental regulations pushing for energy-efficient pumps and sustainable practices are also contributing to market growth. Competition is fierce, with both established players and new entrants constantly vying for market share. This competitiveness results in continuous innovation and a focus on offering cost-effective, high-performance solutions.
Dominant Regions & Segments in Industrial Pumps Industry
This section identifies the leading regions and segments within the industrial pumps market.
Dominant End-user Industries:
- Oil and Gas: This segment is a significant driver, particularly in regions with robust oil and gas extraction activities. Growth is linked to exploration and production activities, pipeline infrastructure, and refining processes.
- Water and Wastewater: Increasing urbanization and industrialization lead to rising demand for efficient water treatment and distribution systems, boosting this segment's growth.
- Chemicals and Petrochemicals: This segment requires specialized pumps capable of handling corrosive and hazardous materials, creating opportunities for specialized pump manufacturers.
- Mining: The mining industry demands robust pumps for various applications, including dewatering and slurry transport, making it a significant market segment.
- Power Generation: The expansion of power generation capacity, particularly in renewable energy sources, necessitates efficient and reliable pumps for various processes.
Dominant Pump Types:
- Centrifugal Pumps: This type dominates due to its versatility, efficiency, and relatively low cost.
- Reciprocating Pumps: These pumps are critical in high-pressure applications requiring precise flow control, even though they are less efficient than centrifugal pumps.
- Rotary Pumps: These are ideal for handling viscous fluids and slurries.
(Detailed analysis of dominance within each segment will follow, outlining key drivers like economic policies, infrastructure development, and government regulations.)
Industrial Pumps Industry Product Innovations
Recent years have seen significant advancements in industrial pump technology, including the integration of smart sensors for predictive maintenance, the development of energy-efficient designs, and the use of advanced materials for enhanced durability and corrosion resistance. These innovations are improving pump performance, reliability, and reducing lifecycle costs, making them more appealing to end-users. The market is witnessing a shift toward customized pump solutions tailored to specific application needs, driven by the growing demand for optimized efficiency and reduced operational costs.
Report Scope & Segmentation Analysis
This report comprehensively segments the industrial pumps market by end-user industry (Oil and Gas, Water and Wastewater, Chemicals and Petrochemicals, Mining, Power Generation, Other End-user Industries) and pump type (Centrifugal Pump, Reciprocating Pump, Rotary Pump, Other Pump Types). Each segment's growth projections, market size, and competitive dynamics are detailed within the report. The analysis considers historical data (2019-2024), the base year (2025), and forecasts for the future (2025-2033).
Key Drivers of Industrial Pumps Industry Growth
The growth of the industrial pumps market is primarily driven by increasing industrialization, particularly in emerging economies. The demand for reliable water management solutions is further accelerating market growth. Government initiatives promoting infrastructure development and energy efficiency are creating opportunities for innovative pump technologies. Technological advancements, like the use of advanced materials and smart sensors, are improving pump efficiency and lifespan, thus contributing to sustained market expansion.
Challenges in the Industrial Pumps Industry Sector
The industrial pumps sector faces challenges including intense competition, fluctuating raw material prices, stringent environmental regulations, and supply chain disruptions. These factors can impact profitability and hinder growth. Meeting increasingly demanding regulatory compliance requirements can increase operational costs for manufacturers.
Emerging Opportunities in Industrial Pumps Industry
Emerging opportunities in the industrial pumps sector include the growth of renewable energy sources, the increasing demand for water treatment solutions, and the adoption of smart technologies for predictive maintenance. The expansion into developing economies presents substantial growth potential, requiring companies to adapt to local market needs and regulatory frameworks.
Leading Players in the Industrial Pumps Industry Market
- Danfoss AS
- Sulzer Ltd
- Ruhrpumpen Group (A Corporacion EG Company)
- Flowserve Corporation
- Weir Group PLC
- Xylem Inc
- SPP Pumps Inc
- Clyde Union Inc
- Schlumberger Ltd
- Ebara Corp
- ITT Inc
- Grundfos Holding AS
- Dover Corporation
- SPX Flow Inc
- Baker Hughes Company
- Wilo Mather & Platt Pumps Pvt Ltd
- KSB AG
- General Electric Company
Key Developments in Industrial Pumps Industry Industry
- February 2023: EBARA Corporation successfully developed one of the world's first liquid hydrogen booster pumps for hydrogen power generation, reflecting the growing hydrogen market.
- January 2023: Sulzer launched an updated submersible recirculation pump with a 20% hydraulic efficiency improvement and a new 25 kW unit, enhancing performance for larger applications.
- June 2022: Flowserve Corporation secured a contract to provide pumps for TMGcore Inc.'s liquid immersion cooling technology, highlighting the expanding role of pumps in data centers.
Future Outlook for Industrial Pumps Industry Market
The industrial pumps market is poised for continued growth, driven by ongoing industrialization, infrastructure development, and the increasing adoption of energy-efficient and technologically advanced pump solutions. The focus on sustainability and environmental regulations will further drive innovation and demand for eco-friendly pumps. Strategic partnerships and acquisitions will continue to shape the competitive landscape. The market’s future prospects appear positive, with significant opportunities for growth across various end-user industries and geographical regions.
Industrial Pumps Industry Segmentation
-
1. Type
- 1.1. Centrifugal Pump
- 1.2. Reciprocating Pump
- 1.3. Rotary Pump
- 1.4. Other Pump Types
-
2. End-user Industry
- 2.1. Oil and Gas
- 2.2. Water and Wastewater
- 2.3. Chemicals and Petrochemicals
- 2.4. Mining
- 2.5. Power Generation
- 2.6. Other End-user Industries
Industrial Pumps Industry Segmentation By Geography
-
1. North America
- 1.1. United States of America
- 1.2. Canada
- 1.3. Rest of the North America
-
2. Asia Pacific
- 2.1. India
- 2.2. China
- 2.3. South Korea
- 2.4. Rest of the Asia Pacific
-
3. Europe
- 3.1. Germany
- 3.2. United Kingdom
- 3.3. France
- 3.4. Italy
- 3.5. Rest of the Europe
-
4. South America
- 4.1. Brazil
- 4.2. Argentina
- 4.3. Rest of the South America
-
5. Middle East and Africa
- 5.1. United Arab Emirates
- 5.2. Saudi Arabia
- 5.3. Iraq
- 5.4. Rest of the Middle East and Africa
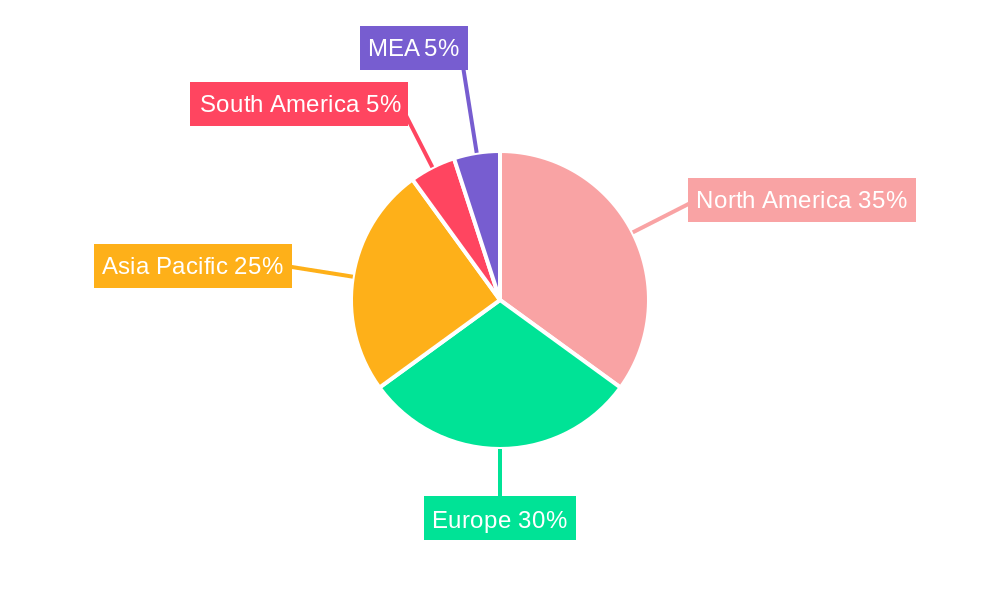
Industrial Pumps Industry Regional Market Share
Geographic Coverage of Industrial Pumps Industry
Industrial Pumps Industry REPORT HIGHLIGHTS
| Aspects | Details |
|---|---|
| Study Period | 2020-2034 |
| Base Year | 2025 |
| Estimated Year | 2026 |
| Forecast Period | 2026-2034 |
| Historical Period | 2020-2025 |
| Growth Rate | CAGR of 4.75% from 2020-2034 |
| Segmentation |
|
Table of Contents
- 1. Introduction
- 1.1. Research Scope
- 1.2. Market Segmentation
- 1.3. Research Objective
- 1.4. Definitions and Assumptions
- 2. Executive Summary
- 2.1. Market Snapshot
- 3. Market Dynamics
- 3.1. Market Drivers
- 3.2. Market Restrains
- 3.3. Market Trends
- 3.4. Market Opportunities
- 4. Market Factor Analysis
- 4.1. Porters Five Forces
- 4.1.1. Bargaining Power of Suppliers
- 4.1.2. Bargaining Power of Buyers
- 4.1.3. Threat of New Entrants
- 4.1.4. Threat of Substitutes
- 4.1.5. Competitive Rivalry
- 4.2. PESTEL analysis
- 4.3. BCG Analysis
- 4.3.1. Stars (High Growth, High Market Share)
- 4.3.2. Cash Cows (Low Growth, High Market Share)
- 4.3.3. Question Mark (High Growth, Low Market Share)
- 4.3.4. Dogs (Low Growth, Low Market Share)
- 4.4. Ansoff Matrix Analysis
- 4.5. Supply Chain Analysis
- 4.6. Regulatory Landscape
- 4.7. Current Market Potential and Opportunity Assessment (TAM–SAM–SOM Framework)
- 4.8. PRI Analyst Note
- 4.1. Porters Five Forces
- 5. Market Analysis, Insights and Forecast 2021-2033
- 5.1. Market Analysis, Insights and Forecast - by Type
- 5.1.1. Centrifugal Pump
- 5.1.2. Reciprocating Pump
- 5.1.3. Rotary Pump
- 5.1.4. Other Pump Types
- 5.2. Market Analysis, Insights and Forecast - by End-user Industry
- 5.2.1. Oil and Gas
- 5.2.2. Water and Wastewater
- 5.2.3. Chemicals and Petrochemicals
- 5.2.4. Mining
- 5.2.5. Power Generation
- 5.2.6. Other End-user Industries
- 5.3. Market Analysis, Insights and Forecast - by Region
- 5.3.1. North America
- 5.3.2. Asia Pacific
- 5.3.3. Europe
- 5.3.4. South America
- 5.3.5. Middle East and Africa
- 5.1. Market Analysis, Insights and Forecast - by Type
- 6. Global Industrial Pumps Industry Analysis, Insights and Forecast, 2021-2033
- 6.1. Market Analysis, Insights and Forecast - by Type
- 6.1.1. Centrifugal Pump
- 6.1.2. Reciprocating Pump
- 6.1.3. Rotary Pump
- 6.1.4. Other Pump Types
- 6.2. Market Analysis, Insights and Forecast - by End-user Industry
- 6.2.1. Oil and Gas
- 6.2.2. Water and Wastewater
- 6.2.3. Chemicals and Petrochemicals
- 6.2.4. Mining
- 6.2.5. Power Generation
- 6.2.6. Other End-user Industries
- 6.1. Market Analysis, Insights and Forecast - by Type
- 7. North America Industrial Pumps Industry Analysis, Insights and Forecast, 2020-2032
- 7.1. Market Analysis, Insights and Forecast - by Type
- 7.1.1. Centrifugal Pump
- 7.1.2. Reciprocating Pump
- 7.1.3. Rotary Pump
- 7.1.4. Other Pump Types
- 7.2. Market Analysis, Insights and Forecast - by End-user Industry
- 7.2.1. Oil and Gas
- 7.2.2. Water and Wastewater
- 7.2.3. Chemicals and Petrochemicals
- 7.2.4. Mining
- 7.2.5. Power Generation
- 7.2.6. Other End-user Industries
- 7.1. Market Analysis, Insights and Forecast - by Type
- 8. Asia Pacific Industrial Pumps Industry Analysis, Insights and Forecast, 2020-2032
- 8.1. Market Analysis, Insights and Forecast - by Type
- 8.1.1. Centrifugal Pump
- 8.1.2. Reciprocating Pump
- 8.1.3. Rotary Pump
- 8.1.4. Other Pump Types
- 8.2. Market Analysis, Insights and Forecast - by End-user Industry
- 8.2.1. Oil and Gas
- 8.2.2. Water and Wastewater
- 8.2.3. Chemicals and Petrochemicals
- 8.2.4. Mining
- 8.2.5. Power Generation
- 8.2.6. Other End-user Industries
- 8.1. Market Analysis, Insights and Forecast - by Type
- 9. Europe Industrial Pumps Industry Analysis, Insights and Forecast, 2020-2032
- 9.1. Market Analysis, Insights and Forecast - by Type
- 9.1.1. Centrifugal Pump
- 9.1.2. Reciprocating Pump
- 9.1.3. Rotary Pump
- 9.1.4. Other Pump Types
- 9.2. Market Analysis, Insights and Forecast - by End-user Industry
- 9.2.1. Oil and Gas
- 9.2.2. Water and Wastewater
- 9.2.3. Chemicals and Petrochemicals
- 9.2.4. Mining
- 9.2.5. Power Generation
- 9.2.6. Other End-user Industries
- 9.1. Market Analysis, Insights and Forecast - by Type
- 10. South America Industrial Pumps Industry Analysis, Insights and Forecast, 2020-2032
- 10.1. Market Analysis, Insights and Forecast - by Type
- 10.1.1. Centrifugal Pump
- 10.1.2. Reciprocating Pump
- 10.1.3. Rotary Pump
- 10.1.4. Other Pump Types
- 10.2. Market Analysis, Insights and Forecast - by End-user Industry
- 10.2.1. Oil and Gas
- 10.2.2. Water and Wastewater
- 10.2.3. Chemicals and Petrochemicals
- 10.2.4. Mining
- 10.2.5. Power Generation
- 10.2.6. Other End-user Industries
- 10.1. Market Analysis, Insights and Forecast - by Type
- 11. Middle East and Africa Industrial Pumps Industry Analysis, Insights and Forecast, 2020-2032
- 11.1. Market Analysis, Insights and Forecast - by Type
- 11.1.1. Centrifugal Pump
- 11.1.2. Reciprocating Pump
- 11.1.3. Rotary Pump
- 11.1.4. Other Pump Types
- 11.2. Market Analysis, Insights and Forecast - by End-user Industry
- 11.2.1. Oil and Gas
- 11.2.2. Water and Wastewater
- 11.2.3. Chemicals and Petrochemicals
- 11.2.4. Mining
- 11.2.5. Power Generation
- 11.2.6. Other End-user Industries
- 11.1. Market Analysis, Insights and Forecast - by Type
- 12. Competitive Analysis
- 12.1. Company Profiles
- 12.1.1 Danfoss AS
- 12.1.1.1. Company Overview
- 12.1.1.2. Products
- 12.1.1.3. Company Financials
- 12.1.1.4. SWOT Analysis
- 12.1.2 Sulzer Ltd
- 12.1.2.1. Company Overview
- 12.1.2.2. Products
- 12.1.2.3. Company Financials
- 12.1.2.4. SWOT Analysis
- 12.1.3 Ruhrpumpen Group (A Corporacion EG Company)*List Not Exhaustive
- 12.1.3.1. Company Overview
- 12.1.3.2. Products
- 12.1.3.3. Company Financials
- 12.1.3.4. SWOT Analysis
- 12.1.4 Flowserve Corporation
- 12.1.4.1. Company Overview
- 12.1.4.2. Products
- 12.1.4.3. Company Financials
- 12.1.4.4. SWOT Analysis
- 12.1.5 Weir Group PLC
- 12.1.5.1. Company Overview
- 12.1.5.2. Products
- 12.1.5.3. Company Financials
- 12.1.5.4. SWOT Analysis
- 12.1.6 Xylem Inc
- 12.1.6.1. Company Overview
- 12.1.6.2. Products
- 12.1.6.3. Company Financials
- 12.1.6.4. SWOT Analysis
- 12.1.7 SPP Pumps Inc
- 12.1.7.1. Company Overview
- 12.1.7.2. Products
- 12.1.7.3. Company Financials
- 12.1.7.4. SWOT Analysis
- 12.1.8 Clyde Union Inc
- 12.1.8.1. Company Overview
- 12.1.8.2. Products
- 12.1.8.3. Company Financials
- 12.1.8.4. SWOT Analysis
- 12.1.9 Schlumberger Ltd
- 12.1.9.1. Company Overview
- 12.1.9.2. Products
- 12.1.9.3. Company Financials
- 12.1.9.4. SWOT Analysis
- 12.1.10 Ebara Corp
- 12.1.10.1. Company Overview
- 12.1.10.2. Products
- 12.1.10.3. Company Financials
- 12.1.10.4. SWOT Analysis
- 12.1.11 ITT Inc
- 12.1.11.1. Company Overview
- 12.1.11.2. Products
- 12.1.11.3. Company Financials
- 12.1.11.4. SWOT Analysis
- 12.1.12 Grundfos Holding AS
- 12.1.12.1. Company Overview
- 12.1.12.2. Products
- 12.1.12.3. Company Financials
- 12.1.12.4. SWOT Analysis
- 12.1.13 Dover Corporation
- 12.1.13.1. Company Overview
- 12.1.13.2. Products
- 12.1.13.3. Company Financials
- 12.1.13.4. SWOT Analysis
- 12.1.14 SPX Flow Inc
- 12.1.14.1. Company Overview
- 12.1.14.2. Products
- 12.1.14.3. Company Financials
- 12.1.14.4. SWOT Analysis
- 12.1.15 Baker Hughes Company
- 12.1.15.1. Company Overview
- 12.1.15.2. Products
- 12.1.15.3. Company Financials
- 12.1.15.4. SWOT Analysis
- 12.1.16 Wilo Mather & Platt Pumps Pvt Ltd
- 12.1.16.1. Company Overview
- 12.1.16.2. Products
- 12.1.16.3. Company Financials
- 12.1.16.4. SWOT Analysis
- 12.1.17 KSB AG
- 12.1.17.1. Company Overview
- 12.1.17.2. Products
- 12.1.17.3. Company Financials
- 12.1.17.4. SWOT Analysis
- 12.1.18 General Electric Company
- 12.1.18.1. Company Overview
- 12.1.18.2. Products
- 12.1.18.3. Company Financials
- 12.1.18.4. SWOT Analysis
- 12.1.1 Danfoss AS
- 12.2. Market Entropy
- 12.2.1 Company's Key Areas Served
- 12.2.2 Recent Developments
- 12.3. Company Market Share Analysis 2025
- 12.3.1 Top 5 Companies Market Share Analysis
- 12.3.2 Top 3 Companies Market Share Analysis
- 12.4. List of Potential Customers
- 13. Research Methodology
List of Figures
- Figure 1: Global Industrial Pumps Industry Revenue Breakdown (billion, %) by Region 2025 & 2033
- Figure 2: Global Industrial Pumps Industry Volume Breakdown (K Unit, %) by Region 2025 & 2033
- Figure 3: North America Industrial Pumps Industry Revenue (billion), by Type 2025 & 2033
- Figure 4: North America Industrial Pumps Industry Volume (K Unit), by Type 2025 & 2033
- Figure 5: North America Industrial Pumps Industry Revenue Share (%), by Type 2025 & 2033
- Figure 6: North America Industrial Pumps Industry Volume Share (%), by Type 2025 & 2033
- Figure 7: North America Industrial Pumps Industry Revenue (billion), by End-user Industry 2025 & 2033
- Figure 8: North America Industrial Pumps Industry Volume (K Unit), by End-user Industry 2025 & 2033
- Figure 9: North America Industrial Pumps Industry Revenue Share (%), by End-user Industry 2025 & 2033
- Figure 10: North America Industrial Pumps Industry Volume Share (%), by End-user Industry 2025 & 2033
- Figure 11: North America Industrial Pumps Industry Revenue (billion), by Country 2025 & 2033
- Figure 12: North America Industrial Pumps Industry Volume (K Unit), by Country 2025 & 2033
- Figure 13: North America Industrial Pumps Industry Revenue Share (%), by Country 2025 & 2033
- Figure 14: North America Industrial Pumps Industry Volume Share (%), by Country 2025 & 2033
- Figure 15: Asia Pacific Industrial Pumps Industry Revenue (billion), by Type 2025 & 2033
- Figure 16: Asia Pacific Industrial Pumps Industry Volume (K Unit), by Type 2025 & 2033
- Figure 17: Asia Pacific Industrial Pumps Industry Revenue Share (%), by Type 2025 & 2033
- Figure 18: Asia Pacific Industrial Pumps Industry Volume Share (%), by Type 2025 & 2033
- Figure 19: Asia Pacific Industrial Pumps Industry Revenue (billion), by End-user Industry 2025 & 2033
- Figure 20: Asia Pacific Industrial Pumps Industry Volume (K Unit), by End-user Industry 2025 & 2033
- Figure 21: Asia Pacific Industrial Pumps Industry Revenue Share (%), by End-user Industry 2025 & 2033
- Figure 22: Asia Pacific Industrial Pumps Industry Volume Share (%), by End-user Industry 2025 & 2033
- Figure 23: Asia Pacific Industrial Pumps Industry Revenue (billion), by Country 2025 & 2033
- Figure 24: Asia Pacific Industrial Pumps Industry Volume (K Unit), by Country 2025 & 2033
- Figure 25: Asia Pacific Industrial Pumps Industry Revenue Share (%), by Country 2025 & 2033
- Figure 26: Asia Pacific Industrial Pumps Industry Volume Share (%), by Country 2025 & 2033
- Figure 27: Europe Industrial Pumps Industry Revenue (billion), by Type 2025 & 2033
- Figure 28: Europe Industrial Pumps Industry Volume (K Unit), by Type 2025 & 2033
- Figure 29: Europe Industrial Pumps Industry Revenue Share (%), by Type 2025 & 2033
- Figure 30: Europe Industrial Pumps Industry Volume Share (%), by Type 2025 & 2033
- Figure 31: Europe Industrial Pumps Industry Revenue (billion), by End-user Industry 2025 & 2033
- Figure 32: Europe Industrial Pumps Industry Volume (K Unit), by End-user Industry 2025 & 2033
- Figure 33: Europe Industrial Pumps Industry Revenue Share (%), by End-user Industry 2025 & 2033
- Figure 34: Europe Industrial Pumps Industry Volume Share (%), by End-user Industry 2025 & 2033
- Figure 35: Europe Industrial Pumps Industry Revenue (billion), by Country 2025 & 2033
- Figure 36: Europe Industrial Pumps Industry Volume (K Unit), by Country 2025 & 2033
- Figure 37: Europe Industrial Pumps Industry Revenue Share (%), by Country 2025 & 2033
- Figure 38: Europe Industrial Pumps Industry Volume Share (%), by Country 2025 & 2033
- Figure 39: South America Industrial Pumps Industry Revenue (billion), by Type 2025 & 2033
- Figure 40: South America Industrial Pumps Industry Volume (K Unit), by Type 2025 & 2033
- Figure 41: South America Industrial Pumps Industry Revenue Share (%), by Type 2025 & 2033
- Figure 42: South America Industrial Pumps Industry Volume Share (%), by Type 2025 & 2033
- Figure 43: South America Industrial Pumps Industry Revenue (billion), by End-user Industry 2025 & 2033
- Figure 44: South America Industrial Pumps Industry Volume (K Unit), by End-user Industry 2025 & 2033
- Figure 45: South America Industrial Pumps Industry Revenue Share (%), by End-user Industry 2025 & 2033
- Figure 46: South America Industrial Pumps Industry Volume Share (%), by End-user Industry 2025 & 2033
- Figure 47: South America Industrial Pumps Industry Revenue (billion), by Country 2025 & 2033
- Figure 48: South America Industrial Pumps Industry Volume (K Unit), by Country 2025 & 2033
- Figure 49: South America Industrial Pumps Industry Revenue Share (%), by Country 2025 & 2033
- Figure 50: South America Industrial Pumps Industry Volume Share (%), by Country 2025 & 2033
- Figure 51: Middle East and Africa Industrial Pumps Industry Revenue (billion), by Type 2025 & 2033
- Figure 52: Middle East and Africa Industrial Pumps Industry Volume (K Unit), by Type 2025 & 2033
- Figure 53: Middle East and Africa Industrial Pumps Industry Revenue Share (%), by Type 2025 & 2033
- Figure 54: Middle East and Africa Industrial Pumps Industry Volume Share (%), by Type 2025 & 2033
- Figure 55: Middle East and Africa Industrial Pumps Industry Revenue (billion), by End-user Industry 2025 & 2033
- Figure 56: Middle East and Africa Industrial Pumps Industry Volume (K Unit), by End-user Industry 2025 & 2033
- Figure 57: Middle East and Africa Industrial Pumps Industry Revenue Share (%), by End-user Industry 2025 & 2033
- Figure 58: Middle East and Africa Industrial Pumps Industry Volume Share (%), by End-user Industry 2025 & 2033
- Figure 59: Middle East and Africa Industrial Pumps Industry Revenue (billion), by Country 2025 & 2033
- Figure 60: Middle East and Africa Industrial Pumps Industry Volume (K Unit), by Country 2025 & 2033
- Figure 61: Middle East and Africa Industrial Pumps Industry Revenue Share (%), by Country 2025 & 2033
- Figure 62: Middle East and Africa Industrial Pumps Industry Volume Share (%), by Country 2025 & 2033
List of Tables
- Table 1: Global Industrial Pumps Industry Revenue billion Forecast, by Type 2020 & 2033
- Table 2: Global Industrial Pumps Industry Volume K Unit Forecast, by Type 2020 & 2033
- Table 3: Global Industrial Pumps Industry Revenue billion Forecast, by End-user Industry 2020 & 2033
- Table 4: Global Industrial Pumps Industry Volume K Unit Forecast, by End-user Industry 2020 & 2033
- Table 5: Global Industrial Pumps Industry Revenue billion Forecast, by Region 2020 & 2033
- Table 6: Global Industrial Pumps Industry Volume K Unit Forecast, by Region 2020 & 2033
- Table 7: Global Industrial Pumps Industry Revenue billion Forecast, by Type 2020 & 2033
- Table 8: Global Industrial Pumps Industry Volume K Unit Forecast, by Type 2020 & 2033
- Table 9: Global Industrial Pumps Industry Revenue billion Forecast, by End-user Industry 2020 & 2033
- Table 10: Global Industrial Pumps Industry Volume K Unit Forecast, by End-user Industry 2020 & 2033
- Table 11: Global Industrial Pumps Industry Revenue billion Forecast, by Country 2020 & 2033
- Table 12: Global Industrial Pumps Industry Volume K Unit Forecast, by Country 2020 & 2033
- Table 13: United States of America Industrial Pumps Industry Revenue (billion) Forecast, by Application 2020 & 2033
- Table 14: United States of America Industrial Pumps Industry Volume (K Unit) Forecast, by Application 2020 & 2033
- Table 15: Canada Industrial Pumps Industry Revenue (billion) Forecast, by Application 2020 & 2033
- Table 16: Canada Industrial Pumps Industry Volume (K Unit) Forecast, by Application 2020 & 2033
- Table 17: Rest of the North America Industrial Pumps Industry Revenue (billion) Forecast, by Application 2020 & 2033
- Table 18: Rest of the North America Industrial Pumps Industry Volume (K Unit) Forecast, by Application 2020 & 2033
- Table 19: Global Industrial Pumps Industry Revenue billion Forecast, by Type 2020 & 2033
- Table 20: Global Industrial Pumps Industry Volume K Unit Forecast, by Type 2020 & 2033
- Table 21: Global Industrial Pumps Industry Revenue billion Forecast, by End-user Industry 2020 & 2033
- Table 22: Global Industrial Pumps Industry Volume K Unit Forecast, by End-user Industry 2020 & 2033
- Table 23: Global Industrial Pumps Industry Revenue billion Forecast, by Country 2020 & 2033
- Table 24: Global Industrial Pumps Industry Volume K Unit Forecast, by Country 2020 & 2033
- Table 25: India Industrial Pumps Industry Revenue (billion) Forecast, by Application 2020 & 2033
- Table 26: India Industrial Pumps Industry Volume (K Unit) Forecast, by Application 2020 & 2033
- Table 27: China Industrial Pumps Industry Revenue (billion) Forecast, by Application 2020 & 2033
- Table 28: China Industrial Pumps Industry Volume (K Unit) Forecast, by Application 2020 & 2033
- Table 29: South Korea Industrial Pumps Industry Revenue (billion) Forecast, by Application 2020 & 2033
- Table 30: South Korea Industrial Pumps Industry Volume (K Unit) Forecast, by Application 2020 & 2033
- Table 31: Rest of the Asia Pacific Industrial Pumps Industry Revenue (billion) Forecast, by Application 2020 & 2033
- Table 32: Rest of the Asia Pacific Industrial Pumps Industry Volume (K Unit) Forecast, by Application 2020 & 2033
- Table 33: Global Industrial Pumps Industry Revenue billion Forecast, by Type 2020 & 2033
- Table 34: Global Industrial Pumps Industry Volume K Unit Forecast, by Type 2020 & 2033
- Table 35: Global Industrial Pumps Industry Revenue billion Forecast, by End-user Industry 2020 & 2033
- Table 36: Global Industrial Pumps Industry Volume K Unit Forecast, by End-user Industry 2020 & 2033
- Table 37: Global Industrial Pumps Industry Revenue billion Forecast, by Country 2020 & 2033
- Table 38: Global Industrial Pumps Industry Volume K Unit Forecast, by Country 2020 & 2033
- Table 39: Germany Industrial Pumps Industry Revenue (billion) Forecast, by Application 2020 & 2033
- Table 40: Germany Industrial Pumps Industry Volume (K Unit) Forecast, by Application 2020 & 2033
- Table 41: United Kingdom Industrial Pumps Industry Revenue (billion) Forecast, by Application 2020 & 2033
- Table 42: United Kingdom Industrial Pumps Industry Volume (K Unit) Forecast, by Application 2020 & 2033
- Table 43: France Industrial Pumps Industry Revenue (billion) Forecast, by Application 2020 & 2033
- Table 44: France Industrial Pumps Industry Volume (K Unit) Forecast, by Application 2020 & 2033
- Table 45: Italy Industrial Pumps Industry Revenue (billion) Forecast, by Application 2020 & 2033
- Table 46: Italy Industrial Pumps Industry Volume (K Unit) Forecast, by Application 2020 & 2033
- Table 47: Rest of the Europe Industrial Pumps Industry Revenue (billion) Forecast, by Application 2020 & 2033
- Table 48: Rest of the Europe Industrial Pumps Industry Volume (K Unit) Forecast, by Application 2020 & 2033
- Table 49: Global Industrial Pumps Industry Revenue billion Forecast, by Type 2020 & 2033
- Table 50: Global Industrial Pumps Industry Volume K Unit Forecast, by Type 2020 & 2033
- Table 51: Global Industrial Pumps Industry Revenue billion Forecast, by End-user Industry 2020 & 2033
- Table 52: Global Industrial Pumps Industry Volume K Unit Forecast, by End-user Industry 2020 & 2033
- Table 53: Global Industrial Pumps Industry Revenue billion Forecast, by Country 2020 & 2033
- Table 54: Global Industrial Pumps Industry Volume K Unit Forecast, by Country 2020 & 2033
- Table 55: Brazil Industrial Pumps Industry Revenue (billion) Forecast, by Application 2020 & 2033
- Table 56: Brazil Industrial Pumps Industry Volume (K Unit) Forecast, by Application 2020 & 2033
- Table 57: Argentina Industrial Pumps Industry Revenue (billion) Forecast, by Application 2020 & 2033
- Table 58: Argentina Industrial Pumps Industry Volume (K Unit) Forecast, by Application 2020 & 2033
- Table 59: Rest of the South America Industrial Pumps Industry Revenue (billion) Forecast, by Application 2020 & 2033
- Table 60: Rest of the South America Industrial Pumps Industry Volume (K Unit) Forecast, by Application 2020 & 2033
- Table 61: Global Industrial Pumps Industry Revenue billion Forecast, by Type 2020 & 2033
- Table 62: Global Industrial Pumps Industry Volume K Unit Forecast, by Type 2020 & 2033
- Table 63: Global Industrial Pumps Industry Revenue billion Forecast, by End-user Industry 2020 & 2033
- Table 64: Global Industrial Pumps Industry Volume K Unit Forecast, by End-user Industry 2020 & 2033
- Table 65: Global Industrial Pumps Industry Revenue billion Forecast, by Country 2020 & 2033
- Table 66: Global Industrial Pumps Industry Volume K Unit Forecast, by Country 2020 & 2033
- Table 67: United Arab Emirates Industrial Pumps Industry Revenue (billion) Forecast, by Application 2020 & 2033
- Table 68: United Arab Emirates Industrial Pumps Industry Volume (K Unit) Forecast, by Application 2020 & 2033
- Table 69: Saudi Arabia Industrial Pumps Industry Revenue (billion) Forecast, by Application 2020 & 2033
- Table 70: Saudi Arabia Industrial Pumps Industry Volume (K Unit) Forecast, by Application 2020 & 2033
- Table 71: Iraq Industrial Pumps Industry Revenue (billion) Forecast, by Application 2020 & 2033
- Table 72: Iraq Industrial Pumps Industry Volume (K Unit) Forecast, by Application 2020 & 2033
- Table 73: Rest of the Middle East and Africa Industrial Pumps Industry Revenue (billion) Forecast, by Application 2020 & 2033
- Table 74: Rest of the Middle East and Africa Industrial Pumps Industry Volume (K Unit) Forecast, by Application 2020 & 2033
Frequently Asked Questions
1. What is the projected Compound Annual Growth Rate (CAGR) of the Industrial Pumps Industry?
The projected CAGR is approximately 4.75%.
2. Which companies are prominent players in the Industrial Pumps Industry?
Key companies in the market include Danfoss AS, Sulzer Ltd, Ruhrpumpen Group (A Corporacion EG Company)*List Not Exhaustive, Flowserve Corporation, Weir Group PLC, Xylem Inc, SPP Pumps Inc, Clyde Union Inc, Schlumberger Ltd, Ebara Corp, ITT Inc, Grundfos Holding AS, Dover Corporation, SPX Flow Inc, Baker Hughes Company, Wilo Mather & Platt Pumps Pvt Ltd, KSB AG, General Electric Company.
3. What are the main segments of the Industrial Pumps Industry?
The market segments include Type, End-user Industry.
4. Can you provide details about the market size?
The market size is estimated to be USD 48.2 billion as of 2022.
5. What are some drivers contributing to market growth?
Increasing Petrochemical Industries In Middle East & African Region4.; Increasing Industrialization Across the World.
6. What are the notable trends driving market growth?
Centrifugal Pumps to Have a Significant Demand.
7. Are there any restraints impacting market growth?
Stringent Government Regulations and Policies to Reduce Carbon Emissions.
8. Can you provide examples of recent developments in the market?
February 2023: EBARA Corporation successfully developed one of the world's first liquid hydrogen booster pumps for hydrogen power generation, consistent with the global expansion of the hydrogen market.
9. What pricing options are available for accessing the report?
Pricing options include single-user, multi-user, and enterprise licenses priced at USD 4750, USD 5250, and USD 8750 respectively.
10. Is the market size provided in terms of value or volume?
The market size is provided in terms of value, measured in billion and volume, measured in K Unit.
11. Are there any specific market keywords associated with the report?
Yes, the market keyword associated with the report is "Industrial Pumps Industry," which aids in identifying and referencing the specific market segment covered.
12. How do I determine which pricing option suits my needs best?
The pricing options vary based on user requirements and access needs. Individual users may opt for single-user licenses, while businesses requiring broader access may choose multi-user or enterprise licenses for cost-effective access to the report.
13. Are there any additional resources or data provided in the Industrial Pumps Industry report?
While the report offers comprehensive insights, it's advisable to review the specific contents or supplementary materials provided to ascertain if additional resources or data are available.
14. How can I stay updated on further developments or reports in the Industrial Pumps Industry?
To stay informed about further developments, trends, and reports in the Industrial Pumps Industry, consider subscribing to industry newsletters, following relevant companies and organizations, or regularly checking reputable industry news sources and publications.
Methodology
Step 1 - Identification of Relevant Samples Size from Population Database


Step 2 - Approaches for Defining Global Market Size (Value, Volume* & Price*)

Note*: In applicable scenarios
Step 3 - Data Sources
Primary Research
- Web Analytics
- Survey Reports
- Research Institute
- Latest Research Reports
- Opinion Leaders
Secondary Research
- Annual Reports
- White Paper
- Latest Press Release
- Industry Association
- Paid Database
- Investor Presentations

Step 4 - Data Triangulation
Involves using different sources of information in order to increase the validity of a study
These sources are likely to be stakeholders in a program - participants, other researchers, program staff, other community members, and so on.
Then we put all data in single framework & apply various statistical tools to find out the dynamic on the market.
During the analysis stage, feedback from the stakeholder groups would be compared to determine areas of agreement as well as areas of divergence