
Key Insights
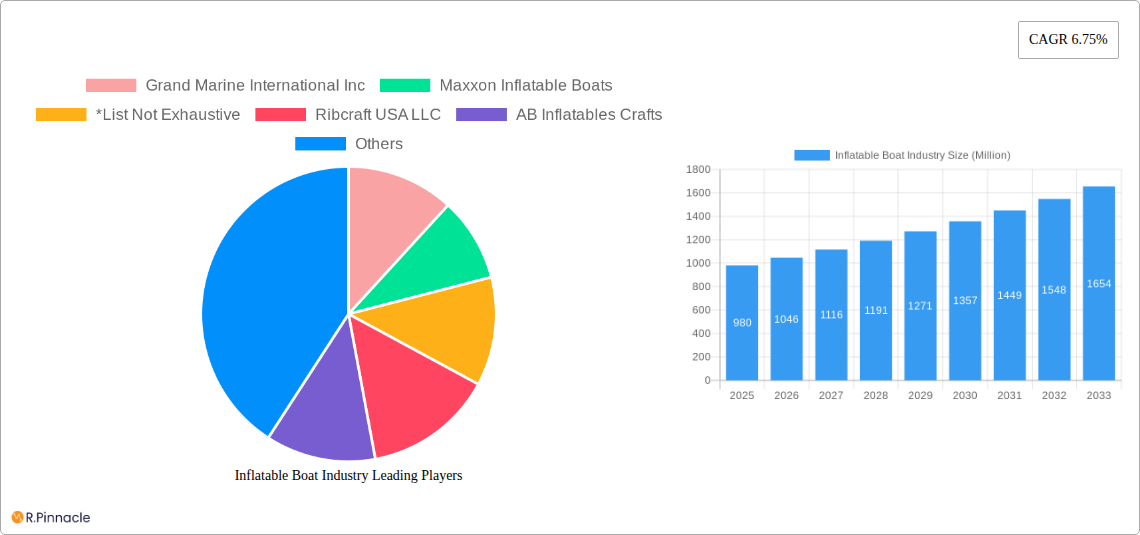
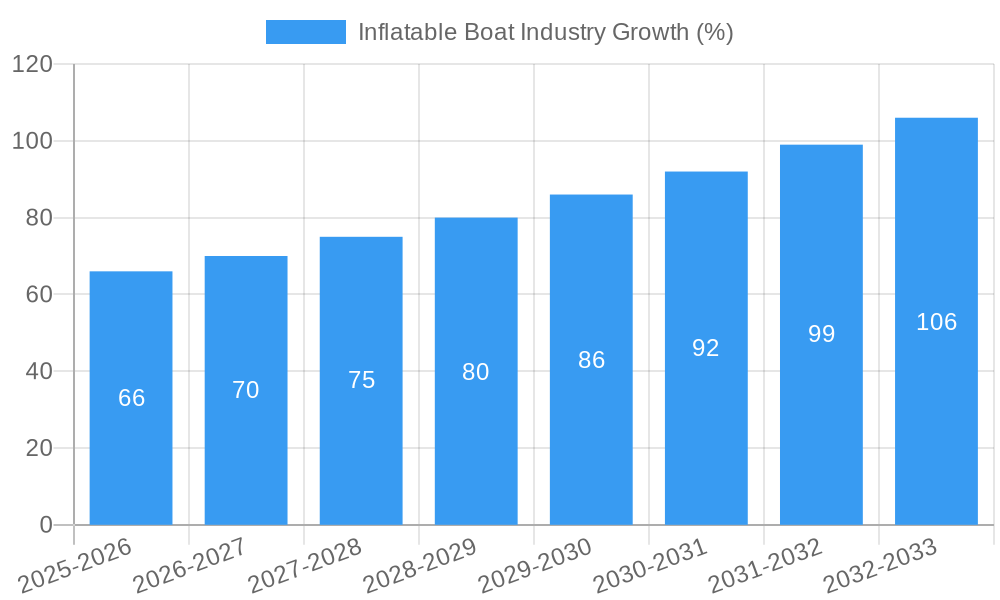
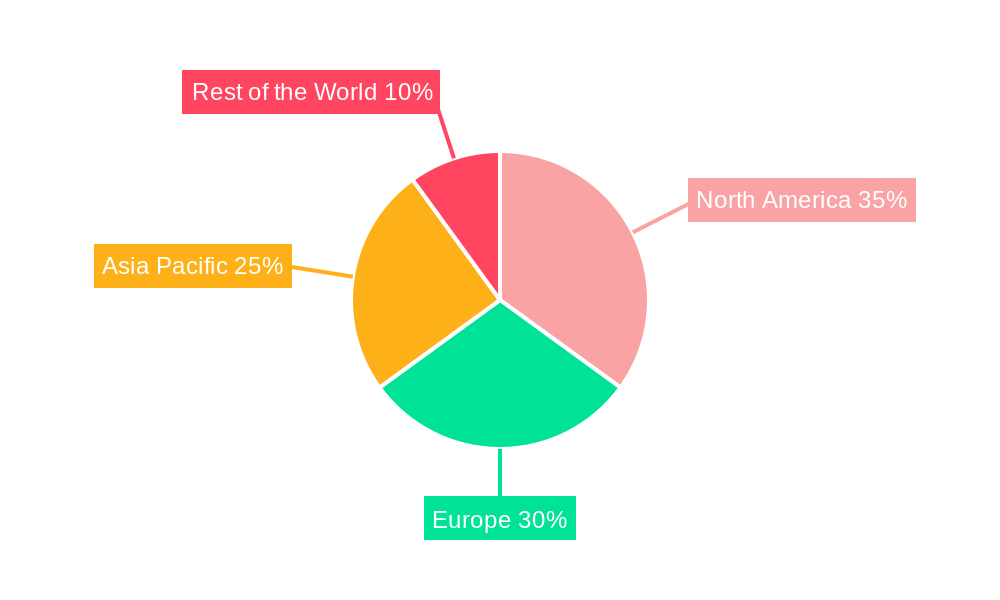
The global inflatable boat market, valued at $0.98 billion in 2025, is projected to experience robust growth, driven by increasing demand from leisure activities and the defense sector. A Compound Annual Growth Rate (CAGR) of 6.75% from 2025 to 2033 indicates a significant expansion of the market. This growth is fueled by several key factors. The rising popularity of recreational boating, coupled with the affordability and portability of inflatable boats, contributes significantly to market expansion. Furthermore, the defense and maritime sectors utilize inflatable boats extensively for patrol, surveillance, and special operations, underpinning consistent demand. Technological advancements leading to improved durability, safety features, and performance are also driving market growth. Segment-wise, the leisure segment is expected to dominate, followed by the defense sector. Within boat types, rigid inflatable boats (RIBs) hold a larger market share due to their superior performance and stability, while the soft inflatable boat segment offers a budget-friendly alternative for recreational users. Regional analysis suggests North America and Europe currently hold significant market shares, however, the Asia-Pacific region is poised for substantial growth due to increasing disposable incomes and rising tourism. Challenges like raw material price fluctuations and potential environmental regulations could pose constraints to market growth. However, the overall outlook remains positive, with continuous innovation and expansion into new applications expected to drive market expansion throughout the forecast period.
The competitive landscape features both established players like Zodiac Nautic and Survitec Group, alongside specialized manufacturers like Ribcraft USA and Grand Marine International. These companies are actively engaged in product development and strategic partnerships to cater to the growing and diversifying demands of different market segments. The market is likely to witness increased consolidation and competition as new entrants emerge, further accelerating innovation and market penetration. Continued focus on sustainability and eco-friendly materials is expected to shape future developments in the inflatable boat industry. The market's future success will be heavily influenced by the continued growth of leisure activities, technological advancements, and governmental regulations.
Inflatable Boat Industry Market Report: 2019-2033
This comprehensive report provides an in-depth analysis of the global inflatable boat industry, offering invaluable insights for industry professionals, investors, and strategic decision-makers. The study period covers 2019-2033, with 2025 as the base and estimated year, and a forecast period of 2025-2033. The report leverages extensive market research and data analysis to project a market value exceeding $XX Million by 2033.
Inflatable Boat Industry Market Structure & Innovation Trends
This section analyzes the inflatable boat market's competitive landscape, examining market concentration, innovation drivers, regulatory impacts, and key industry trends. We delve into the dynamics of mergers and acquisitions (M&A) activity, quantifying deal values where possible. Key players like Grand Marine International Inc, Maxxon Inflatable Boats, Ribcraft USA LLC, AB Inflatables Crafts, Zodiac Nautic, Survitec Group Limited, Mercury Marine, Damen Shipyard Group, and Walker's Bay, amongst others, contribute to the market's diverse structure.
- Market Concentration: The market exhibits a [Describe Market Concentration - e.g., moderately concentrated] structure, with [Number] major players holding approximately [Percentage]% of the market share in 2025.
- Innovation Drivers: Technological advancements in materials (e.g., lighter, stronger fabrics), design (e.g., improved hull designs for stability and speed), and propulsion systems are key drivers of innovation.
- Regulatory Frameworks: International and national maritime regulations concerning safety and environmental impact significantly influence market dynamics.
- Product Substitutes: Alternative watercraft, such as rigid-hulled inflatable boats (RIBs), kayaks, and canoes, represent some level of substitution.
- End-User Demographics: The leisure segment dominates, followed by defense and other niche applications. The report analyzes demographic trends and their impact on demand.
- M&A Activity: The inflatable boat industry has witnessed [Number] significant M&A deals in the historical period (2019-2024), with a total estimated value of $XX Million. These transactions are analyzed to understand their impact on market consolidation and competitive dynamics.
Inflatable Boat Industry Market Dynamics & Trends
This section provides a detailed examination of the market's growth trajectory, exploring key drivers and challenges. We analyze consumer preferences, technological disruptions, and competitive dynamics to paint a comprehensive picture of the industry’s evolution. The report projects a CAGR of [Percentage]% for the forecast period (2025-2033), with market penetration expected to reach [Percentage]% by 2033 in key segments. The analysis covers factors such as increasing demand for leisure activities, advancements in boat design, and the impact of evolving consumer preferences on market segmentation.
Dominant Regions & Segments in Inflatable Boat Industry
This section pinpoints leading regions and market segments based on End-User Type (Leisure, Defense, Others) and Boat Type (Rigid, Soft). We analyze the key drivers of dominance in each segment, including economic factors, infrastructure development, and regulatory landscapes.
Dominant Region: [Region Name] is identified as the leading region due to [Reasons - explain in paragraphs].
Dominant Segments:
- End-User Type: The Leisure segment currently dominates due to [Reasons - bullet points outlining economic factors, lifestyle trends, etc.].
- Boat Type: The demand for Rigid inflatable boats is projected to experience higher growth due to [Reasons - bullet points outlining advantages of rigid boats, technological advancements].
Inflatable Boat Industry Product Innovations
Recent product innovations include advancements in lightweight, high-strength materials, improved engine integration, and enhanced safety features. These advancements cater to the growing demand for versatile, durable, and user-friendly inflatable boats across various applications. The market is witnessing a strong trend towards incorporating advanced technologies to enhance performance and safety aspects.
Report Scope & Segmentation Analysis
This report segments the inflatable boat market by End-User Type (Leisure, Defense, Others) and Boat Type (Rigid, Soft). Each segment's growth projections, market size estimates, and competitive landscape are meticulously analyzed.
- End-User Type: Each segment (Leisure, Defense, Others) will have its own paragraph detailing market size, growth projections, and key players.
- Boat Type: Each segment (Rigid, Soft) will have its own paragraph detailing market size, growth projections, and key players.
Key Drivers of Inflatable Boat Industry Growth
Growth is propelled by several factors: rising disposable incomes fueling leisure activities, increasing demand from the defense sector for specialized inflatable boats, technological innovations improving boat performance and safety, and favorable government policies promoting recreational boating.
Challenges in the Inflatable Boat Industry Sector
The industry faces challenges, including supply chain disruptions impacting material costs and production timelines, stringent safety and environmental regulations impacting manufacturing costs, and intense competition among established and emerging players. These factors contribute to price volatility and constrain market expansion to a certain extent.
Emerging Opportunities in Inflatable Boat Industry
Emerging opportunities include expansion into new markets (e.g., developing economies), development of eco-friendly materials and propulsion systems, integration of advanced technologies (e.g., autonomous navigation), and customization options catering to niche market needs.
Leading Players in the Inflatable Boat Industry Market
- Grand Marine International Inc
- Maxxon Inflatable Boats
- Ribcraft USA LLC
- AB Inflatables Crafts
- Zodiac Nautic
- Survitec Group Limited
- Mercury Marine
- Damen Shipyard Group
- Walker's Bay
Key Developments in Inflatable Boat Industry
- [Date]: [Development - e.g., Zodiac Nautic launched a new line of high-performance RIBs.]
- [Date]: [Development - e.g., A major merger between two inflatable boat manufacturers was announced.]
- [Date]: [Development - e.g., New safety regulations were implemented in [Region].]
- List not exhaustive
Future Outlook for Inflatable Boat Industry Market
The inflatable boat market is poised for continued growth, driven by ongoing technological advancements, expanding applications across various sectors, and increasing consumer demand for recreational boating. Strategic investments in research and development, along with a focus on sustainability and eco-friendly practices, will be crucial for success in this dynamic market.
Inflatable Boat Industry Segmentation
-
1. End-User Type
- 1.1. Leisure
- 1.2. Defense
- 1.3. Others
-
2. Boat Type
- 2.1. Rigid
- 2.2. Soft
Inflatable Boat Industry Segmentation By Geography
-
1. North America
- 1.1. United States
- 1.2. Canada
- 1.3. Rest of North America
-
2. Europe
- 2.1. Germany
- 2.2. United Kingdom
- 2.3. France
- 2.4. Rest of Europe
-
3. Asia Pacific
- 3.1. India
- 3.2. China
- 3.3. Japan
- 3.4. South Korea
- 3.5. Rest of Asia Pacific
-
4. Rest of the World
- 4.1. Brazil
- 4.2. Mexico
- 4.3. United Arab Emirates
- 4.4. Other Countries
Inflatable Boat Industry REPORT HIGHLIGHTS
| Aspects | Details |
|---|---|
| Study Period | 2019-2033 |
| Base Year | 2024 |
| Estimated Year | 2025 |
| Forecast Period | 2025-2033 |
| Historical Period | 2019-2024 |
| Growth Rate | CAGR of 6.75% from 2019-2033 |
| Segmentation |
|
Table of Contents
- 1. Introduction
- 1.1. Research Scope
- 1.2. Market Segmentation
- 1.3. Research Methodology
- 1.4. Definitions and Assumptions
- 2. Executive Summary
- 2.1. Introduction
- 3. Market Dynamics
- 3.1. Introduction
- 3.2. Market Drivers
- 3.2.1. Increasing Demand For Electric Vehicles is Anticipated to Boost the Market
- 3.3. Market Restrains
- 3.3.1. High Cost Associated with Electric Vehicles is Anticipated to Restrain the Growth of the Market
- 3.4. Market Trends
- 3.4.1. Leisure Segment is Expected to Dominate
- 4. Market Factor Analysis
- 4.1. Porters Five Forces
- 4.2. Supply/Value Chain
- 4.3. PESTEL analysis
- 4.4. Market Entropy
- 4.5. Patent/Trademark Analysis
- 5. Global Inflatable Boat Industry Analysis, Insights and Forecast, 2019-2031
- 5.1. Market Analysis, Insights and Forecast - by End-User Type
- 5.1.1. Leisure
- 5.1.2. Defense
- 5.1.3. Others
- 5.2. Market Analysis, Insights and Forecast - by Boat Type
- 5.2.1. Rigid
- 5.2.2. Soft
- 5.3. Market Analysis, Insights and Forecast - by Region
- 5.3.1. North America
- 5.3.2. Europe
- 5.3.3. Asia Pacific
- 5.3.4. Rest of the World
- 5.1. Market Analysis, Insights and Forecast - by End-User Type
- 6. North America Inflatable Boat Industry Analysis, Insights and Forecast, 2019-2031
- 6.1. Market Analysis, Insights and Forecast - by End-User Type
- 6.1.1. Leisure
- 6.1.2. Defense
- 6.1.3. Others
- 6.2. Market Analysis, Insights and Forecast - by Boat Type
- 6.2.1. Rigid
- 6.2.2. Soft
- 6.1. Market Analysis, Insights and Forecast - by End-User Type
- 7. Europe Inflatable Boat Industry Analysis, Insights and Forecast, 2019-2031
- 7.1. Market Analysis, Insights and Forecast - by End-User Type
- 7.1.1. Leisure
- 7.1.2. Defense
- 7.1.3. Others
- 7.2. Market Analysis, Insights and Forecast - by Boat Type
- 7.2.1. Rigid
- 7.2.2. Soft
- 7.1. Market Analysis, Insights and Forecast - by End-User Type
- 8. Asia Pacific Inflatable Boat Industry Analysis, Insights and Forecast, 2019-2031
- 8.1. Market Analysis, Insights and Forecast - by End-User Type
- 8.1.1. Leisure
- 8.1.2. Defense
- 8.1.3. Others
- 8.2. Market Analysis, Insights and Forecast - by Boat Type
- 8.2.1. Rigid
- 8.2.2. Soft
- 8.1. Market Analysis, Insights and Forecast - by End-User Type
- 9. Rest of the World Inflatable Boat Industry Analysis, Insights and Forecast, 2019-2031
- 9.1. Market Analysis, Insights and Forecast - by End-User Type
- 9.1.1. Leisure
- 9.1.2. Defense
- 9.1.3. Others
- 9.2. Market Analysis, Insights and Forecast - by Boat Type
- 9.2.1. Rigid
- 9.2.2. Soft
- 9.1. Market Analysis, Insights and Forecast - by End-User Type
- 10. North America Inflatable Boat Industry Analysis, Insights and Forecast, 2019-2031
- 10.1. Market Analysis, Insights and Forecast - By Country/Sub-region
- 10.1.1 United States
- 10.1.2 Canada
- 10.1.3 Rest of North America
- 11. Europe Inflatable Boat Industry Analysis, Insights and Forecast, 2019-2031
- 11.1. Market Analysis, Insights and Forecast - By Country/Sub-region
- 11.1.1 Germany
- 11.1.2 United Kingdom
- 11.1.3 France
- 11.1.4 Rest of Europe
- 12. Asia Pacific Inflatable Boat Industry Analysis, Insights and Forecast, 2019-2031
- 12.1. Market Analysis, Insights and Forecast - By Country/Sub-region
- 12.1.1 India
- 12.1.2 China
- 12.1.3 Japan
- 12.1.4 South Korea
- 12.1.5 Rest of Asia Pacific
- 13. Rest of the World Inflatable Boat Industry Analysis, Insights and Forecast, 2019-2031
- 13.1. Market Analysis, Insights and Forecast - By Country/Sub-region
- 13.1.1 Brazil
- 13.1.2 Mexico
- 13.1.3 United Arab Emirates
- 13.1.4 Other Countries
- 14. Competitive Analysis
- 14.1. Global Market Share Analysis 2024
- 14.2. Company Profiles
- 14.2.1 Grand Marine International Inc
- 14.2.1.1. Overview
- 14.2.1.2. Products
- 14.2.1.3. SWOT Analysis
- 14.2.1.4. Recent Developments
- 14.2.1.5. Financials (Based on Availability)
- 14.2.2 Maxxon Inflatable Boats
- 14.2.2.1. Overview
- 14.2.2.2. Products
- 14.2.2.3. SWOT Analysis
- 14.2.2.4. Recent Developments
- 14.2.2.5. Financials (Based on Availability)
- 14.2.3 *List Not Exhaustive
- 14.2.3.1. Overview
- 14.2.3.2. Products
- 14.2.3.3. SWOT Analysis
- 14.2.3.4. Recent Developments
- 14.2.3.5. Financials (Based on Availability)
- 14.2.4 Ribcraft USA LLC
- 14.2.4.1. Overview
- 14.2.4.2. Products
- 14.2.4.3. SWOT Analysis
- 14.2.4.4. Recent Developments
- 14.2.4.5. Financials (Based on Availability)
- 14.2.5 AB Inflatables Crafts
- 14.2.5.1. Overview
- 14.2.5.2. Products
- 14.2.5.3. SWOT Analysis
- 14.2.5.4. Recent Developments
- 14.2.5.5. Financials (Based on Availability)
- 14.2.6 Zodiac Nautic
- 14.2.6.1. Overview
- 14.2.6.2. Products
- 14.2.6.3. SWOT Analysis
- 14.2.6.4. Recent Developments
- 14.2.6.5. Financials (Based on Availability)
- 14.2.7 Survitec Group Limited
- 14.2.7.1. Overview
- 14.2.7.2. Products
- 14.2.7.3. SWOT Analysis
- 14.2.7.4. Recent Developments
- 14.2.7.5. Financials (Based on Availability)
- 14.2.8 Mercury Marine
- 14.2.8.1. Overview
- 14.2.8.2. Products
- 14.2.8.3. SWOT Analysis
- 14.2.8.4. Recent Developments
- 14.2.8.5. Financials (Based on Availability)
- 14.2.9 Damen Shipyard Group
- 14.2.9.1. Overview
- 14.2.9.2. Products
- 14.2.9.3. SWOT Analysis
- 14.2.9.4. Recent Developments
- 14.2.9.5. Financials (Based on Availability)
- 14.2.10 Walker's Bay
- 14.2.10.1. Overview
- 14.2.10.2. Products
- 14.2.10.3. SWOT Analysis
- 14.2.10.4. Recent Developments
- 14.2.10.5. Financials (Based on Availability)
- 14.2.1 Grand Marine International Inc
List of Figures
- Figure 1: Global Inflatable Boat Industry Revenue Breakdown (Million, %) by Region 2024 & 2032
- Figure 2: North America Inflatable Boat Industry Revenue (Million), by Country 2024 & 2032
- Figure 3: North America Inflatable Boat Industry Revenue Share (%), by Country 2024 & 2032
- Figure 4: Europe Inflatable Boat Industry Revenue (Million), by Country 2024 & 2032
- Figure 5: Europe Inflatable Boat Industry Revenue Share (%), by Country 2024 & 2032
- Figure 6: Asia Pacific Inflatable Boat Industry Revenue (Million), by Country 2024 & 2032
- Figure 7: Asia Pacific Inflatable Boat Industry Revenue Share (%), by Country 2024 & 2032
- Figure 8: Rest of the World Inflatable Boat Industry Revenue (Million), by Country 2024 & 2032
- Figure 9: Rest of the World Inflatable Boat Industry Revenue Share (%), by Country 2024 & 2032
- Figure 10: North America Inflatable Boat Industry Revenue (Million), by End-User Type 2024 & 2032
- Figure 11: North America Inflatable Boat Industry Revenue Share (%), by End-User Type 2024 & 2032
- Figure 12: North America Inflatable Boat Industry Revenue (Million), by Boat Type 2024 & 2032
- Figure 13: North America Inflatable Boat Industry Revenue Share (%), by Boat Type 2024 & 2032
- Figure 14: North America Inflatable Boat Industry Revenue (Million), by Country 2024 & 2032
- Figure 15: North America Inflatable Boat Industry Revenue Share (%), by Country 2024 & 2032
- Figure 16: Europe Inflatable Boat Industry Revenue (Million), by End-User Type 2024 & 2032
- Figure 17: Europe Inflatable Boat Industry Revenue Share (%), by End-User Type 2024 & 2032
- Figure 18: Europe Inflatable Boat Industry Revenue (Million), by Boat Type 2024 & 2032
- Figure 19: Europe Inflatable Boat Industry Revenue Share (%), by Boat Type 2024 & 2032
- Figure 20: Europe Inflatable Boat Industry Revenue (Million), by Country 2024 & 2032
- Figure 21: Europe Inflatable Boat Industry Revenue Share (%), by Country 2024 & 2032
- Figure 22: Asia Pacific Inflatable Boat Industry Revenue (Million), by End-User Type 2024 & 2032
- Figure 23: Asia Pacific Inflatable Boat Industry Revenue Share (%), by End-User Type 2024 & 2032
- Figure 24: Asia Pacific Inflatable Boat Industry Revenue (Million), by Boat Type 2024 & 2032
- Figure 25: Asia Pacific Inflatable Boat Industry Revenue Share (%), by Boat Type 2024 & 2032
- Figure 26: Asia Pacific Inflatable Boat Industry Revenue (Million), by Country 2024 & 2032
- Figure 27: Asia Pacific Inflatable Boat Industry Revenue Share (%), by Country 2024 & 2032
- Figure 28: Rest of the World Inflatable Boat Industry Revenue (Million), by End-User Type 2024 & 2032
- Figure 29: Rest of the World Inflatable Boat Industry Revenue Share (%), by End-User Type 2024 & 2032
- Figure 30: Rest of the World Inflatable Boat Industry Revenue (Million), by Boat Type 2024 & 2032
- Figure 31: Rest of the World Inflatable Boat Industry Revenue Share (%), by Boat Type 2024 & 2032
- Figure 32: Rest of the World Inflatable Boat Industry Revenue (Million), by Country 2024 & 2032
- Figure 33: Rest of the World Inflatable Boat Industry Revenue Share (%), by Country 2024 & 2032
List of Tables
- Table 1: Global Inflatable Boat Industry Revenue Million Forecast, by Region 2019 & 2032
- Table 2: Global Inflatable Boat Industry Revenue Million Forecast, by End-User Type 2019 & 2032
- Table 3: Global Inflatable Boat Industry Revenue Million Forecast, by Boat Type 2019 & 2032
- Table 4: Global Inflatable Boat Industry Revenue Million Forecast, by Region 2019 & 2032
- Table 5: Global Inflatable Boat Industry Revenue Million Forecast, by Country 2019 & 2032
- Table 6: United States Inflatable Boat Industry Revenue (Million) Forecast, by Application 2019 & 2032
- Table 7: Canada Inflatable Boat Industry Revenue (Million) Forecast, by Application 2019 & 2032
- Table 8: Rest of North America Inflatable Boat Industry Revenue (Million) Forecast, by Application 2019 & 2032
- Table 9: Global Inflatable Boat Industry Revenue Million Forecast, by Country 2019 & 2032
- Table 10: Germany Inflatable Boat Industry Revenue (Million) Forecast, by Application 2019 & 2032
- Table 11: United Kingdom Inflatable Boat Industry Revenue (Million) Forecast, by Application 2019 & 2032
- Table 12: France Inflatable Boat Industry Revenue (Million) Forecast, by Application 2019 & 2032
- Table 13: Rest of Europe Inflatable Boat Industry Revenue (Million) Forecast, by Application 2019 & 2032
- Table 14: Global Inflatable Boat Industry Revenue Million Forecast, by Country 2019 & 2032
- Table 15: India Inflatable Boat Industry Revenue (Million) Forecast, by Application 2019 & 2032
- Table 16: China Inflatable Boat Industry Revenue (Million) Forecast, by Application 2019 & 2032
- Table 17: Japan Inflatable Boat Industry Revenue (Million) Forecast, by Application 2019 & 2032
- Table 18: South Korea Inflatable Boat Industry Revenue (Million) Forecast, by Application 2019 & 2032
- Table 19: Rest of Asia Pacific Inflatable Boat Industry Revenue (Million) Forecast, by Application 2019 & 2032
- Table 20: Global Inflatable Boat Industry Revenue Million Forecast, by Country 2019 & 2032
- Table 21: Brazil Inflatable Boat Industry Revenue (Million) Forecast, by Application 2019 & 2032
- Table 22: Mexico Inflatable Boat Industry Revenue (Million) Forecast, by Application 2019 & 2032
- Table 23: United Arab Emirates Inflatable Boat Industry Revenue (Million) Forecast, by Application 2019 & 2032
- Table 24: Other Countries Inflatable Boat Industry Revenue (Million) Forecast, by Application 2019 & 2032
- Table 25: Global Inflatable Boat Industry Revenue Million Forecast, by End-User Type 2019 & 2032
- Table 26: Global Inflatable Boat Industry Revenue Million Forecast, by Boat Type 2019 & 2032
- Table 27: Global Inflatable Boat Industry Revenue Million Forecast, by Country 2019 & 2032
- Table 28: United States Inflatable Boat Industry Revenue (Million) Forecast, by Application 2019 & 2032
- Table 29: Canada Inflatable Boat Industry Revenue (Million) Forecast, by Application 2019 & 2032
- Table 30: Rest of North America Inflatable Boat Industry Revenue (Million) Forecast, by Application 2019 & 2032
- Table 31: Global Inflatable Boat Industry Revenue Million Forecast, by End-User Type 2019 & 2032
- Table 32: Global Inflatable Boat Industry Revenue Million Forecast, by Boat Type 2019 & 2032
- Table 33: Global Inflatable Boat Industry Revenue Million Forecast, by Country 2019 & 2032
- Table 34: Germany Inflatable Boat Industry Revenue (Million) Forecast, by Application 2019 & 2032
- Table 35: United Kingdom Inflatable Boat Industry Revenue (Million) Forecast, by Application 2019 & 2032
- Table 36: France Inflatable Boat Industry Revenue (Million) Forecast, by Application 2019 & 2032
- Table 37: Rest of Europe Inflatable Boat Industry Revenue (Million) Forecast, by Application 2019 & 2032
- Table 38: Global Inflatable Boat Industry Revenue Million Forecast, by End-User Type 2019 & 2032
- Table 39: Global Inflatable Boat Industry Revenue Million Forecast, by Boat Type 2019 & 2032
- Table 40: Global Inflatable Boat Industry Revenue Million Forecast, by Country 2019 & 2032
- Table 41: India Inflatable Boat Industry Revenue (Million) Forecast, by Application 2019 & 2032
- Table 42: China Inflatable Boat Industry Revenue (Million) Forecast, by Application 2019 & 2032
- Table 43: Japan Inflatable Boat Industry Revenue (Million) Forecast, by Application 2019 & 2032
- Table 44: South Korea Inflatable Boat Industry Revenue (Million) Forecast, by Application 2019 & 2032
- Table 45: Rest of Asia Pacific Inflatable Boat Industry Revenue (Million) Forecast, by Application 2019 & 2032
- Table 46: Global Inflatable Boat Industry Revenue Million Forecast, by End-User Type 2019 & 2032
- Table 47: Global Inflatable Boat Industry Revenue Million Forecast, by Boat Type 2019 & 2032
- Table 48: Global Inflatable Boat Industry Revenue Million Forecast, by Country 2019 & 2032
- Table 49: Brazil Inflatable Boat Industry Revenue (Million) Forecast, by Application 2019 & 2032
- Table 50: Mexico Inflatable Boat Industry Revenue (Million) Forecast, by Application 2019 & 2032
- Table 51: United Arab Emirates Inflatable Boat Industry Revenue (Million) Forecast, by Application 2019 & 2032
- Table 52: Other Countries Inflatable Boat Industry Revenue (Million) Forecast, by Application 2019 & 2032
Frequently Asked Questions
1. What is the projected Compound Annual Growth Rate (CAGR) of the Inflatable Boat Industry?
The projected CAGR is approximately 6.75%.
2. Which companies are prominent players in the Inflatable Boat Industry?
Key companies in the market include Grand Marine International Inc, Maxxon Inflatable Boats, *List Not Exhaustive, Ribcraft USA LLC, AB Inflatables Crafts, Zodiac Nautic, Survitec Group Limited, Mercury Marine, Damen Shipyard Group, Walker's Bay.
3. What are the main segments of the Inflatable Boat Industry?
The market segments include End-User Type, Boat Type.
4. Can you provide details about the market size?
The market size is estimated to be USD 0.98 Million as of 2022.
5. What are some drivers contributing to market growth?
Increasing Demand For Electric Vehicles is Anticipated to Boost the Market.
6. What are the notable trends driving market growth?
Leisure Segment is Expected to Dominate.
7. Are there any restraints impacting market growth?
High Cost Associated with Electric Vehicles is Anticipated to Restrain the Growth of the Market.
8. Can you provide examples of recent developments in the market?
N/A
9. What pricing options are available for accessing the report?
Pricing options include single-user, multi-user, and enterprise licenses priced at USD 4750, USD 5250, and USD 8750 respectively.
10. Is the market size provided in terms of value or volume?
The market size is provided in terms of value, measured in Million.
11. Are there any specific market keywords associated with the report?
Yes, the market keyword associated with the report is "Inflatable Boat Industry," which aids in identifying and referencing the specific market segment covered.
12. How do I determine which pricing option suits my needs best?
The pricing options vary based on user requirements and access needs. Individual users may opt for single-user licenses, while businesses requiring broader access may choose multi-user or enterprise licenses for cost-effective access to the report.
13. Are there any additional resources or data provided in the Inflatable Boat Industry report?
While the report offers comprehensive insights, it's advisable to review the specific contents or supplementary materials provided to ascertain if additional resources or data are available.
14. How can I stay updated on further developments or reports in the Inflatable Boat Industry?
To stay informed about further developments, trends, and reports in the Inflatable Boat Industry, consider subscribing to industry newsletters, following relevant companies and organizations, or regularly checking reputable industry news sources and publications.
Methodology
Step 1 - Identification of Relevant Samples Size from Population Database


Step 2 - Approaches for Defining Global Market Size (Value, Volume* & Price*)

Note*: In applicable scenarios
Step 3 - Data Sources
Primary Research
- Web Analytics
- Survey Reports
- Research Institute
- Latest Research Reports
- Opinion Leaders
Secondary Research
- Annual Reports
- White Paper
- Latest Press Release
- Industry Association
- Paid Database
- Investor Presentations

Step 4 - Data Triangulation
Involves using different sources of information in order to increase the validity of a study
These sources are likely to be stakeholders in a program - participants, other researchers, program staff, other community members, and so on.
Then we put all data in single framework & apply various statistical tools to find out the dynamic on the market.
During the analysis stage, feedback from the stakeholder groups would be compared to determine areas of agreement as well as areas of divergence


