


Key Insights
The global Intraocular Lens (IOL) Implants market is poised for significant expansion, projected to reach USD 9.88 billion by 2025, with a robust Compound Annual Growth Rate (CAGR) of 14.6% during the forecast period of 2025-2033. This substantial growth is primarily fueled by the escalating global prevalence of cataracts, a leading cause of vision impairment, particularly among the aging population. Advancements in surgical techniques, including minimally invasive procedures and the development of premium IOLs with enhanced functionalities like astigmatism correction and presbyopia management, are further propelling market adoption. The increasing demand for foldable IOLs, which offer greater surgical flexibility and patient comfort compared to their non-foldable counterparts, is a key driver. Moreover, rising healthcare expenditures, improving access to advanced ophthalmic care in emerging economies, and a growing awareness among patients about the benefits of IOL implantation are contributing factors to this positive market trajectory. The market is segmented by application into hospitals and clinics, with hospitals likely dominating due to their comprehensive infrastructure and specialized surgical teams.
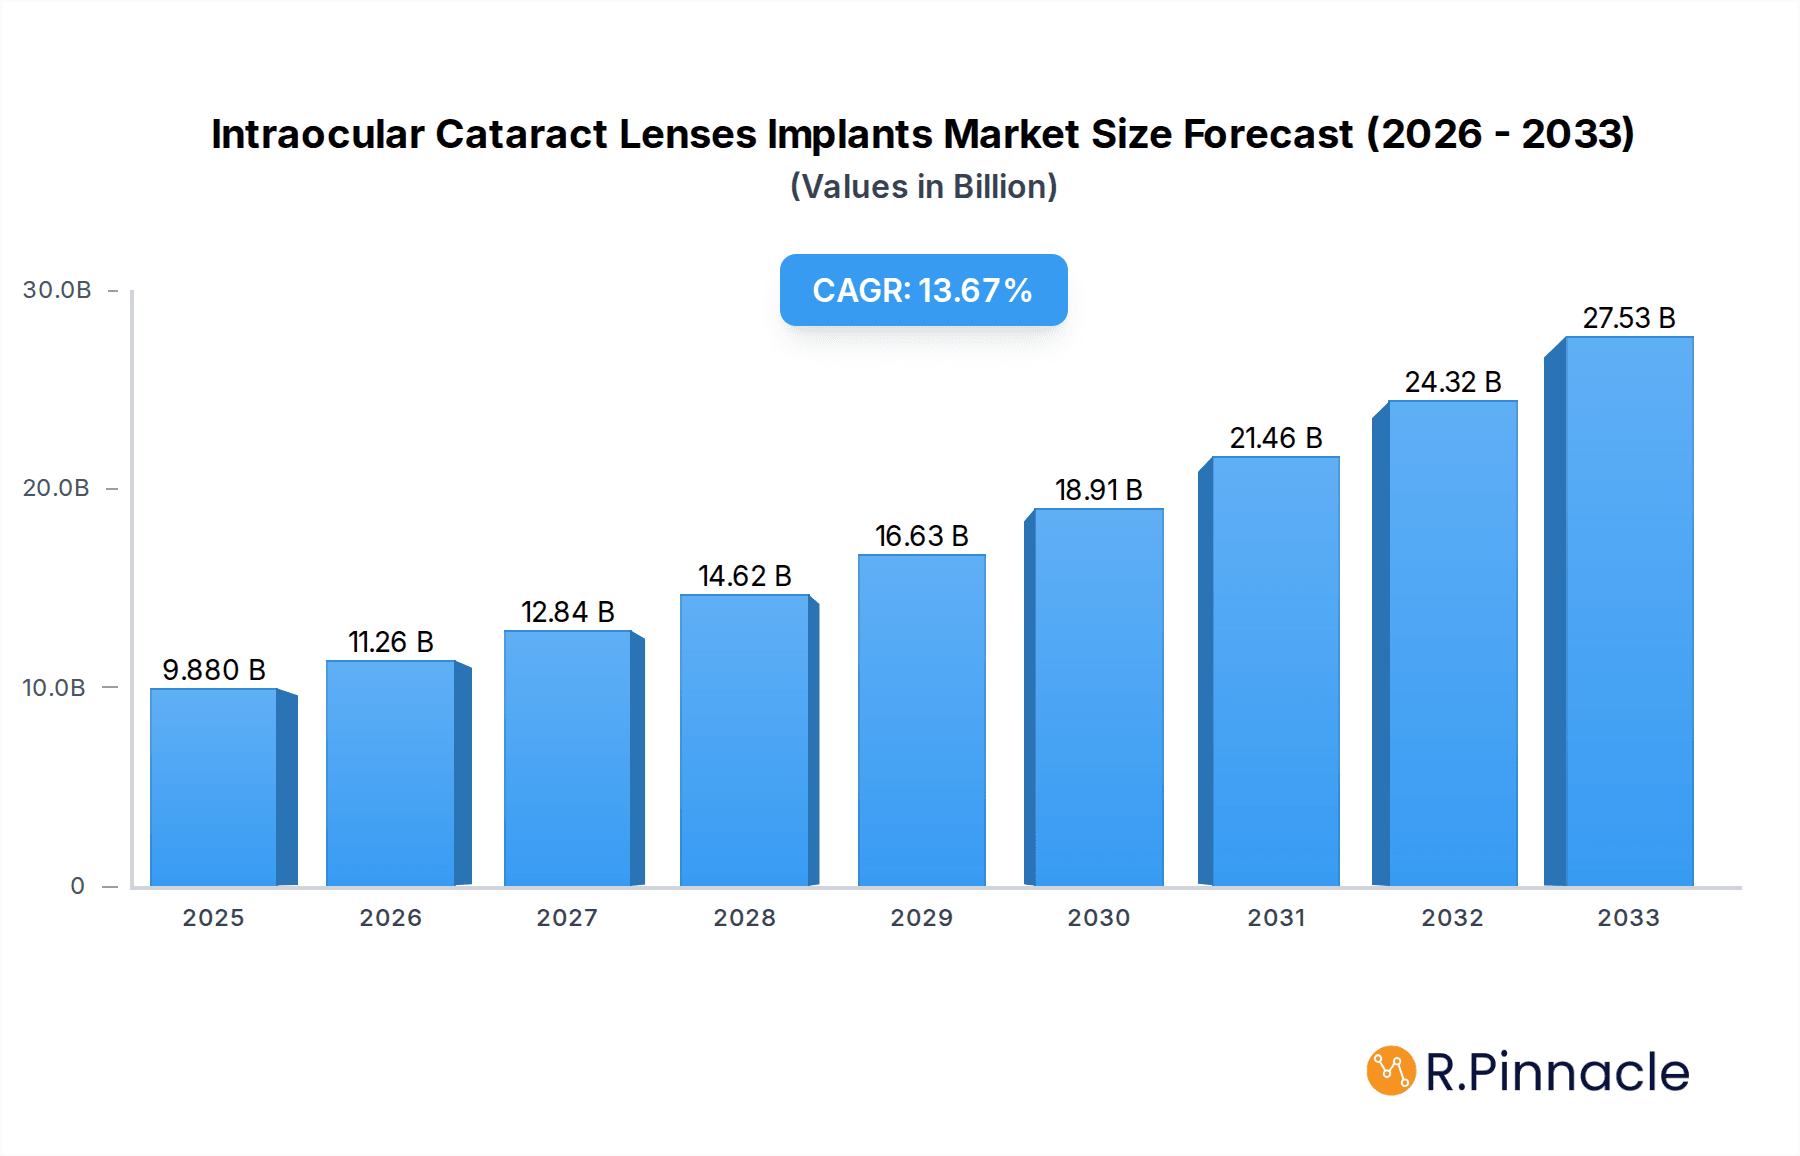
Intraocular Cataract Lenses Implants Market Size (In Billion)

The market landscape is characterized by intense competition among major players such as Alcon, Bausch & Lomb, and AMO (J&J), who are actively engaged in research and development to introduce innovative IOL technologies and expand their global presence. Emerging economies, especially in the Asia Pacific region, represent significant growth opportunities due to their large, underserved populations and increasing investments in healthcare infrastructure. While the market benefits from strong demand drivers, potential restraints include the high cost of advanced IOLs, reimbursement policies in certain regions, and the availability of skilled ophthalmic surgeons. However, the overall outlook remains exceptionally positive, driven by the continuous innovation in IOL technology and the undeniable need for effective cataract treatment worldwide. The market's evolution towards sophisticated, patient-centric solutions underscores a commitment to enhancing visual outcomes and improving the quality of life for millions affected by cataracts.

Intraocular Cataract Lenses Implants Company Market Share
This in-depth report offers a granular analysis of the global Intraocular Cataract Lenses Implants market, projecting a market size of over xx billion by 2033. With a robust CAGR of xx% over the forecast period (2025–2033), driven by an aging global population and advancements in ophthalmic surgery, this study is essential for stakeholders seeking to navigate this dynamic landscape. The report meticulously examines market structure, dynamics, regional dominance, product innovations, and key growth drivers and challenges, providing actionable insights for strategic decision-making.
Intraocular Cataract Lenses Implants Market Structure & Innovation Trends
The Intraocular Cataract Lenses Implants market exhibits a moderately concentrated structure, with key players like Alcon, Bausch & Lomb, and AMO (J&J) holding significant market share, estimated at xx billion in the base year 2025. Innovation is primarily driven by the pursuit of enhanced visual outcomes, reduced intraocular lens (IOL) complications, and the development of advanced optical designs, including multifocal and toric IOLs. Regulatory frameworks, such as FDA approvals and CE marking, play a crucial role in market entry and product validation, impacting the speed of innovation. Substitute products, including advanced contact lenses and other vision correction procedures, present a limited but existing threat. End-user demographics are increasingly focused on patients seeking presbyopia correction and improved quality of life post-cataract surgery, with an expanding segment of younger patients opting for refractive lens exchange. Mergers and acquisitions (M&A) activities have been strategic, focusing on consolidating market share and acquiring innovative technologies, with recent M&A deal values estimated at over xx billion.
- Market Concentration: Moderate to High, dominated by a few key players.
- Innovation Drivers: Improved visual acuity, reduced aberrations, presbyopia correction, astigmatism correction.
- Regulatory Frameworks: FDA, CE Marking, stringent approval processes.
- Product Substitutes: Advanced contact lenses, LASIK, PRK.
- End-User Demographics: Aging population, patients seeking improved vision and spectacle independence.
- M&A Activities: Strategic acquisitions for technology and market share expansion.
Intraocular Cataract Lenses Implants Market Dynamics & Trends
The Intraocular Cataract Lenses Implants market is experiencing significant growth, fueled by a confluence of powerful drivers. The primary catalyst remains the ever-increasing global prevalence of cataracts, directly linked to the aging demographics across developed and developing nations. As life expectancies rise, so does the incidence of age-related ocular conditions, creating a sustained demand for IOL implants. Technological advancements have been revolutionary, transforming the landscape from basic monofocal lenses to sophisticated multifocal, trifocal, and extended depth of focus (EDOF) IOLs. These innovations offer patients a broader range of vision, significantly reducing their dependence on spectacles and enhancing their quality of life. The rising disposable income in emerging economies, coupled with increasing awareness about advanced ophthalmic surgical procedures and their benefits, is further broadening market penetration.
Furthermore, the shift towards minimally invasive surgical techniques and the development of foldable IOLs have made cataract surgery more accessible and appealing to a wider patient base. These foldable lenses allow for smaller incisions, leading to quicker recovery times and reduced post-operative discomfort. The competitive landscape is characterized by intense innovation, with companies investing heavily in research and development to introduce lenses with superior optical clarity, reduced glare and halos, and improved accommodation. This competitive dynamic pushes the boundaries of what's possible, driving down costs incrementally while simultaneously offering more advanced solutions. Consumer preferences are increasingly sophisticated, with patients actively seeking personalized solutions that address their specific visual needs, whether it's correcting myopia, hyperopia, astigmatism, or presbyopia, often in combination. This demand for personalized vision correction creates significant opportunities for companies offering a diverse portfolio of IOLs. The market penetration of advanced IOLs is steadily increasing, reflecting patient and surgeon confidence in their efficacy and safety. The estimated market penetration of advanced IOLs is projected to reach xx% by 2033, a significant increase from xx% in 2025. The overall market is poised for sustained expansion, driven by unmet needs and continuous technological evolution, with an estimated market size of xx billion in 2025 growing to xx billion by 2033. The compound annual growth rate (CAGR) for the forecast period is estimated at xx%.
Dominant Regions & Segments in Intraocular Cataract Lenses Implants
North America, particularly the United States, currently dominates the global Intraocular Cataract Lenses Implants market. This regional leadership is attributed to a confluence of factors including a high prevalence of cataracts due to an aging population, advanced healthcare infrastructure, high disposable incomes, and a strong emphasis on technological innovation and adoption of premium IOLs. The United States boasts a significant number of ophthalmologists performing a high volume of cataract surgeries annually, estimated at over xx million in 2025. The supportive reimbursement policies and patient awareness regarding the benefits of advanced IOLs further solidify its dominant position.
The Hospital segment accounts for the largest share of the market, driven by their comprehensive surgical facilities, advanced diagnostic equipment, and the ability to handle complex cases. Hospitals are equipped to perform a higher volume of procedures and offer a wider range of IOL options to patients. However, the Clinics segment is witnessing rapid growth, fueled by the increasing popularity of ambulatory surgery centers (ASCs) and specialized eye clinics that offer cost-effective and convenient alternatives for routine cataract surgeries. The efficiency and specialized focus of these clinics contribute to their expanding market share, estimated to grow at a CAGR of xx% over the forecast period.
Within the IOL types, Foldable Intraocular Lens (IOL) Implants currently command the largest market share and are projected to continue their dominance. Their primary advantage lies in the ability to be inserted through small incisions, leading to faster recovery times, reduced surgical trauma, and fewer complications. This makes them the preferred choice for a vast majority of cataract surgeries.
- Dominant Region: North America (specifically the United States)
- Key Drivers of Dominance: Aging population, advanced healthcare infrastructure, high disposable income, rapid adoption of premium IOLs, strong research and development ecosystem.
- Dominant Application Segment: Hospital
- Detailed Dominance Analysis: Hospitals offer complete surgical suites, advanced technology, and cater to a high volume of complex procedures.
- Fastest-Growing Application Segment: Clinics (Ambulatory Surgery Centers)
- Detailed Dominance Analysis: Growing preference for cost-effective, convenient, and specialized outpatient surgical solutions.
- Dominant IOL Type: Foldable Intraocular Lens (IOL) Implants
- Detailed Dominance Analysis: Enables smaller incisions, faster recovery, reduced complications, and wider patient acceptance.
Intraocular Cataract Lenses Implants Product Innovations
Product innovations in the Intraocular Cataract Lenses Implants market are primarily focused on enhancing visual quality and patient outcomes. This includes the development of advanced multifocal and EDOF IOLs that provide clear vision at multiple distances, significantly reducing spectacle dependence. Furthermore, there's a strong trend towards aberration-free optical designs, improved materials for better biocompatibility and reduced glare/halos, and the integration of astigmatism correction within premium IOLs (toric IOLs). These innovations offer competitive advantages by addressing specific patient needs and providing superior visual rehabilitation post-surgery, driving market growth and player differentiation.
Report Scope & Segmentation Analysis
This report meticulously segments the Intraocular Cataract Lenses Implants market across key parameters to provide a comprehensive understanding of its landscape. The market is analyzed based on Application, encompassing Hospitals and Clinics. Additionally, segmentation by Type includes Non-foldable Intraocular Lens (IOL) Implants and Foldable Intraocular Lens (IOL) Implants.
- Application: Hospitals: This segment represents the largest market share due to established infrastructure and a high volume of complex procedures. Projections indicate sustained growth, driven by increasing cataract surgeries.
- Application: Clinics: This segment is experiencing robust growth, propelled by the rise of ambulatory surgery centers and specialized eye clinics offering efficient and cost-effective solutions.
- Type: Non-foldable Intraocular Lens (IOL) Implants: While still significant, this segment is gradually being overshadowed by foldable IOLs due to their advantages in surgical technique and patient recovery.
- Type: Foldable Intraocular Lens (IOL) Implants: This segment holds the dominant market share and is expected to continue its upward trajectory, driven by their minimally invasive nature and superior patient outcomes.
Key Drivers of Intraocular Cataract Lenses Implants Growth
The growth of the Intraocular Cataract Lenses Implants market is propelled by several interconnected factors. The increasing global aging population is a fundamental driver, as age is the primary risk factor for cataract development. Advancements in ophthalmic surgical techniques and technology, particularly the development of sophisticated foldable and premium IOLs (multifocal, toric, EDOF), significantly enhance patient outcomes and patient satisfaction, driving demand. Growing healthcare expenditure and disposable incomes in emerging economies are expanding access to these advanced surgical procedures. Furthermore, increased patient awareness and demand for improved visual quality and spectacle independence post-surgery are compelling individuals to opt for premium IOLs. Favorable reimbursement policies and government initiatives promoting eye care services in various regions also contribute to market expansion.
Challenges in the Intraocular Cataract Lenses Implants Sector
Despite robust growth, the Intraocular Cataract Lenses Implants sector faces several challenges. High cost of premium IOLs can be a barrier for some patients, particularly in price-sensitive markets, limiting widespread adoption. Stringent and evolving regulatory hurdles and lengthy approval processes for new technologies can slow down market entry and innovation. Intense competition and pricing pressures from established players and emerging manufacturers can impact profit margins. Limited awareness and access to advanced eye care services in underdeveloped regions restrict market penetration. Potential for post-operative complications, though rare, can also influence patient perceptions and surgeon choices. The global supply chain disruptions and geopolitical factors can also pose risks to raw material availability and product distribution.
Emerging Opportunities in Intraocular Cataract Lenses Implants
The Intraocular Cataract Lenses Implants market presents significant emerging opportunities. The expanding middle class in emerging economies offers a vast untapped patient pool for cataract surgeries and premium IOLs. Innovations in extended depth of focus (EDOF) and accommodating IOLs catering to the demand for seamless vision correction are promising. The development of smart IOLs with integrated diagnostic capabilities or adjustability presents a futuristic frontier. Increased focus on personalized vision correction solutions tailored to individual lifestyle needs will drive demand for a diverse range of IOLs. The integration of AI and machine learning in surgical planning and IOL selection can optimize outcomes and enhance patient experience. Furthermore, the growing trend of refractive lens exchange (RLE) for proactive vision correction in younger populations opens new market avenues.
Leading Players in the Intraocular Cataract Lenses Implants Market
- Alcon
- Bausch & Lomb
- AMO (J&J)
- HOYA
- CARL Zeiss
- OPHTEC
- HumanOptics
- Rayner
- STAAR Surgical
- Haohai Biological Technology
- Eyebright
- Vision Pro
Key Developments in Intraocular Cataract Lenses Implants Industry
- 2023/XX: Launch of new EDOF intraocular lens with enhanced glare reduction features, improving visual comfort.
- 2023/XX: Acquisition of a smaller IOL technology firm by a major player to expand its portfolio of premium lenses.
- 2024/XX: Introduction of a novel toric IOL offering improved astigmatism correction accuracy.
- 2024/XX: Regulatory approval for a next-generation multifocal IOL designed for better intermediate vision.
- 2024/XX: Significant investment in R&D for accommodating IOL technology to mimic natural eye function.
Future Outlook for Intraocular Cataract Lenses Implants Market
The future outlook for the Intraocular Cataract Lenses Implants market is exceptionally bright, characterized by sustained growth and transformative innovation. The projected market size of over xx billion by 2033 underscores the immense potential. Key growth accelerators include the ongoing demographic shift towards an older global population, which will continue to fuel demand for cataract surgery. Furthermore, the relentless pursuit of technological advancements, particularly in premium IOLs offering enhanced visual acuity, reduced aberrations, and spectacle independence, will be a major growth driver. The increasing acceptance and demand for personalized vision correction solutions, coupled with expanding healthcare infrastructure and disposable incomes in emerging markets, present significant strategic opportunities. The market is poised for continued evolution, with a strong emphasis on patient-centric solutions and improved surgical outcomes.
Intraocular Cataract Lenses Implants Segmentation
-
1. Application
- 1.1. Hospital
- 1.2. Clicnics
-
2. Types
- 2.1. Non-foldable Intraocular Lens (IOL) Implants
- 2.2. Foldable Intraocular Lens (IOL) Implants
Intraocular Cataract Lenses Implants Segmentation By Geography
-
1. North America
- 1.1. United States
- 1.2. Canada
- 1.3. Mexico
-
2. South America
- 2.1. Brazil
- 2.2. Argentina
- 2.3. Rest of South America
-
3. Europe
- 3.1. United Kingdom
- 3.2. Germany
- 3.3. France
- 3.4. Italy
- 3.5. Spain
- 3.6. Russia
- 3.7. Benelux
- 3.8. Nordics
- 3.9. Rest of Europe
-
4. Middle East & Africa
- 4.1. Turkey
- 4.2. Israel
- 4.3. GCC
- 4.4. North Africa
- 4.5. South Africa
- 4.6. Rest of Middle East & Africa
-
5. Asia Pacific
- 5.1. China
- 5.2. India
- 5.3. Japan
- 5.4. South Korea
- 5.5. ASEAN
- 5.6. Oceania
- 5.7. Rest of Asia Pacific

Intraocular Cataract Lenses Implants Regional Market Share
Geographic Coverage of Intraocular Cataract Lenses Implants
Intraocular Cataract Lenses Implants REPORT HIGHLIGHTS
| Aspects | Details |
|---|---|
| Study Period | 2020-2034 |
| Base Year | 2025 |
| Estimated Year | 2026 |
| Forecast Period | 2026-2034 |
| Historical Period | 2020-2025 |
| Growth Rate | CAGR of 14.6% from 2020-2034 |
| Segmentation |
|
Table of Contents
- 1. Introduction
- 1.1. Research Scope
- 1.2. Market Segmentation
- 1.3. Research Methodology
- 1.4. Definitions and Assumptions
- 2. Executive Summary
- 2.1. Introduction
- 3. Market Dynamics
- 3.1. Introduction
- 3.2. Market Drivers
- 3.3. Market Restrains
- 3.4. Market Trends
- 4. Market Factor Analysis
- 4.1. Porters Five Forces
- 4.2. Supply/Value Chain
- 4.3. PESTEL analysis
- 4.4. Market Entropy
- 4.5. Patent/Trademark Analysis
- 5. Global Intraocular Cataract Lenses Implants Analysis, Insights and Forecast, 2020-2032
- 5.1. Market Analysis, Insights and Forecast - by Application
- 5.1.1. Hospital
- 5.1.2. Clicnics
- 5.2. Market Analysis, Insights and Forecast - by Types
- 5.2.1. Non-foldable Intraocular Lens (IOL) Implants
- 5.2.2. Foldable Intraocular Lens (IOL) Implants
- 5.3. Market Analysis, Insights and Forecast - by Region
- 5.3.1. North America
- 5.3.2. South America
- 5.3.3. Europe
- 5.3.4. Middle East & Africa
- 5.3.5. Asia Pacific
- 5.1. Market Analysis, Insights and Forecast - by Application
- 6. North America Intraocular Cataract Lenses Implants Analysis, Insights and Forecast, 2020-2032
- 6.1. Market Analysis, Insights and Forecast - by Application
- 6.1.1. Hospital
- 6.1.2. Clicnics
- 6.2. Market Analysis, Insights and Forecast - by Types
- 6.2.1. Non-foldable Intraocular Lens (IOL) Implants
- 6.2.2. Foldable Intraocular Lens (IOL) Implants
- 6.1. Market Analysis, Insights and Forecast - by Application
- 7. South America Intraocular Cataract Lenses Implants Analysis, Insights and Forecast, 2020-2032
- 7.1. Market Analysis, Insights and Forecast - by Application
- 7.1.1. Hospital
- 7.1.2. Clicnics
- 7.2. Market Analysis, Insights and Forecast - by Types
- 7.2.1. Non-foldable Intraocular Lens (IOL) Implants
- 7.2.2. Foldable Intraocular Lens (IOL) Implants
- 7.1. Market Analysis, Insights and Forecast - by Application
- 8. Europe Intraocular Cataract Lenses Implants Analysis, Insights and Forecast, 2020-2032
- 8.1. Market Analysis, Insights and Forecast - by Application
- 8.1.1. Hospital
- 8.1.2. Clicnics
- 8.2. Market Analysis, Insights and Forecast - by Types
- 8.2.1. Non-foldable Intraocular Lens (IOL) Implants
- 8.2.2. Foldable Intraocular Lens (IOL) Implants
- 8.1. Market Analysis, Insights and Forecast - by Application
- 9. Middle East & Africa Intraocular Cataract Lenses Implants Analysis, Insights and Forecast, 2020-2032
- 9.1. Market Analysis, Insights and Forecast - by Application
- 9.1.1. Hospital
- 9.1.2. Clicnics
- 9.2. Market Analysis, Insights and Forecast - by Types
- 9.2.1. Non-foldable Intraocular Lens (IOL) Implants
- 9.2.2. Foldable Intraocular Lens (IOL) Implants
- 9.1. Market Analysis, Insights and Forecast - by Application
- 10. Asia Pacific Intraocular Cataract Lenses Implants Analysis, Insights and Forecast, 2020-2032
- 10.1. Market Analysis, Insights and Forecast - by Application
- 10.1.1. Hospital
- 10.1.2. Clicnics
- 10.2. Market Analysis, Insights and Forecast - by Types
- 10.2.1. Non-foldable Intraocular Lens (IOL) Implants
- 10.2.2. Foldable Intraocular Lens (IOL) Implants
- 10.1. Market Analysis, Insights and Forecast - by Application
- 11. Competitive Analysis
- 11.1. Global Market Share Analysis 2025
- 11.2. Company Profiles
- 11.2.1 Alcon
- 11.2.1.1. Overview
- 11.2.1.2. Products
- 11.2.1.3. SWOT Analysis
- 11.2.1.4. Recent Developments
- 11.2.1.5. Financials (Based on Availability)
- 11.2.2 Bausch & Lomb
- 11.2.2.1. Overview
- 11.2.2.2. Products
- 11.2.2.3. SWOT Analysis
- 11.2.2.4. Recent Developments
- 11.2.2.5. Financials (Based on Availability)
- 11.2.3 AMO (J&J)
- 11.2.3.1. Overview
- 11.2.3.2. Products
- 11.2.3.3. SWOT Analysis
- 11.2.3.4. Recent Developments
- 11.2.3.5. Financials (Based on Availability)
- 11.2.4 HOYA
- 11.2.4.1. Overview
- 11.2.4.2. Products
- 11.2.4.3. SWOT Analysis
- 11.2.4.4. Recent Developments
- 11.2.4.5. Financials (Based on Availability)
- 11.2.5 CARL Zeiss
- 11.2.5.1. Overview
- 11.2.5.2. Products
- 11.2.5.3. SWOT Analysis
- 11.2.5.4. Recent Developments
- 11.2.5.5. Financials (Based on Availability)
- 11.2.6 OPHTEC
- 11.2.6.1. Overview
- 11.2.6.2. Products
- 11.2.6.3. SWOT Analysis
- 11.2.6.4. Recent Developments
- 11.2.6.5. Financials (Based on Availability)
- 11.2.7 HumanOptics
- 11.2.7.1. Overview
- 11.2.7.2. Products
- 11.2.7.3. SWOT Analysis
- 11.2.7.4. Recent Developments
- 11.2.7.5. Financials (Based on Availability)
- 11.2.8 Rayner
- 11.2.8.1. Overview
- 11.2.8.2. Products
- 11.2.8.3. SWOT Analysis
- 11.2.8.4. Recent Developments
- 11.2.8.5. Financials (Based on Availability)
- 11.2.9 STAAR Surgical
- 11.2.9.1. Overview
- 11.2.9.2. Products
- 11.2.9.3. SWOT Analysis
- 11.2.9.4. Recent Developments
- 11.2.9.5. Financials (Based on Availability)
- 11.2.10 Haohai Biological Technology
- 11.2.10.1. Overview
- 11.2.10.2. Products
- 11.2.10.3. SWOT Analysis
- 11.2.10.4. Recent Developments
- 11.2.10.5. Financials (Based on Availability)
- 11.2.11 Eyebright
- 11.2.11.1. Overview
- 11.2.11.2. Products
- 11.2.11.3. SWOT Analysis
- 11.2.11.4. Recent Developments
- 11.2.11.5. Financials (Based on Availability)
- 11.2.12 Vision Pro
- 11.2.12.1. Overview
- 11.2.12.2. Products
- 11.2.12.3. SWOT Analysis
- 11.2.12.4. Recent Developments
- 11.2.12.5. Financials (Based on Availability)
- 11.2.1 Alcon
List of Figures
- Figure 1: Global Intraocular Cataract Lenses Implants Revenue Breakdown (undefined, %) by Region 2025 & 2033
- Figure 2: Global Intraocular Cataract Lenses Implants Volume Breakdown (K, %) by Region 2025 & 2033
- Figure 3: North America Intraocular Cataract Lenses Implants Revenue (undefined), by Application 2025 & 2033
- Figure 4: North America Intraocular Cataract Lenses Implants Volume (K), by Application 2025 & 2033
- Figure 5: North America Intraocular Cataract Lenses Implants Revenue Share (%), by Application 2025 & 2033
- Figure 6: North America Intraocular Cataract Lenses Implants Volume Share (%), by Application 2025 & 2033
- Figure 7: North America Intraocular Cataract Lenses Implants Revenue (undefined), by Types 2025 & 2033
- Figure 8: North America Intraocular Cataract Lenses Implants Volume (K), by Types 2025 & 2033
- Figure 9: North America Intraocular Cataract Lenses Implants Revenue Share (%), by Types 2025 & 2033
- Figure 10: North America Intraocular Cataract Lenses Implants Volume Share (%), by Types 2025 & 2033
- Figure 11: North America Intraocular Cataract Lenses Implants Revenue (undefined), by Country 2025 & 2033
- Figure 12: North America Intraocular Cataract Lenses Implants Volume (K), by Country 2025 & 2033
- Figure 13: North America Intraocular Cataract Lenses Implants Revenue Share (%), by Country 2025 & 2033
- Figure 14: North America Intraocular Cataract Lenses Implants Volume Share (%), by Country 2025 & 2033
- Figure 15: South America Intraocular Cataract Lenses Implants Revenue (undefined), by Application 2025 & 2033
- Figure 16: South America Intraocular Cataract Lenses Implants Volume (K), by Application 2025 & 2033
- Figure 17: South America Intraocular Cataract Lenses Implants Revenue Share (%), by Application 2025 & 2033
- Figure 18: South America Intraocular Cataract Lenses Implants Volume Share (%), by Application 2025 & 2033
- Figure 19: South America Intraocular Cataract Lenses Implants Revenue (undefined), by Types 2025 & 2033
- Figure 20: South America Intraocular Cataract Lenses Implants Volume (K), by Types 2025 & 2033
- Figure 21: South America Intraocular Cataract Lenses Implants Revenue Share (%), by Types 2025 & 2033
- Figure 22: South America Intraocular Cataract Lenses Implants Volume Share (%), by Types 2025 & 2033
- Figure 23: South America Intraocular Cataract Lenses Implants Revenue (undefined), by Country 2025 & 2033
- Figure 24: South America Intraocular Cataract Lenses Implants Volume (K), by Country 2025 & 2033
- Figure 25: South America Intraocular Cataract Lenses Implants Revenue Share (%), by Country 2025 & 2033
- Figure 26: South America Intraocular Cataract Lenses Implants Volume Share (%), by Country 2025 & 2033
- Figure 27: Europe Intraocular Cataract Lenses Implants Revenue (undefined), by Application 2025 & 2033
- Figure 28: Europe Intraocular Cataract Lenses Implants Volume (K), by Application 2025 & 2033
- Figure 29: Europe Intraocular Cataract Lenses Implants Revenue Share (%), by Application 2025 & 2033
- Figure 30: Europe Intraocular Cataract Lenses Implants Volume Share (%), by Application 2025 & 2033
- Figure 31: Europe Intraocular Cataract Lenses Implants Revenue (undefined), by Types 2025 & 2033
- Figure 32: Europe Intraocular Cataract Lenses Implants Volume (K), by Types 2025 & 2033
- Figure 33: Europe Intraocular Cataract Lenses Implants Revenue Share (%), by Types 2025 & 2033
- Figure 34: Europe Intraocular Cataract Lenses Implants Volume Share (%), by Types 2025 & 2033
- Figure 35: Europe Intraocular Cataract Lenses Implants Revenue (undefined), by Country 2025 & 2033
- Figure 36: Europe Intraocular Cataract Lenses Implants Volume (K), by Country 2025 & 2033
- Figure 37: Europe Intraocular Cataract Lenses Implants Revenue Share (%), by Country 2025 & 2033
- Figure 38: Europe Intraocular Cataract Lenses Implants Volume Share (%), by Country 2025 & 2033
- Figure 39: Middle East & Africa Intraocular Cataract Lenses Implants Revenue (undefined), by Application 2025 & 2033
- Figure 40: Middle East & Africa Intraocular Cataract Lenses Implants Volume (K), by Application 2025 & 2033
- Figure 41: Middle East & Africa Intraocular Cataract Lenses Implants Revenue Share (%), by Application 2025 & 2033
- Figure 42: Middle East & Africa Intraocular Cataract Lenses Implants Volume Share (%), by Application 2025 & 2033
- Figure 43: Middle East & Africa Intraocular Cataract Lenses Implants Revenue (undefined), by Types 2025 & 2033
- Figure 44: Middle East & Africa Intraocular Cataract Lenses Implants Volume (K), by Types 2025 & 2033
- Figure 45: Middle East & Africa Intraocular Cataract Lenses Implants Revenue Share (%), by Types 2025 & 2033
- Figure 46: Middle East & Africa Intraocular Cataract Lenses Implants Volume Share (%), by Types 2025 & 2033
- Figure 47: Middle East & Africa Intraocular Cataract Lenses Implants Revenue (undefined), by Country 2025 & 2033
- Figure 48: Middle East & Africa Intraocular Cataract Lenses Implants Volume (K), by Country 2025 & 2033
- Figure 49: Middle East & Africa Intraocular Cataract Lenses Implants Revenue Share (%), by Country 2025 & 2033
- Figure 50: Middle East & Africa Intraocular Cataract Lenses Implants Volume Share (%), by Country 2025 & 2033
- Figure 51: Asia Pacific Intraocular Cataract Lenses Implants Revenue (undefined), by Application 2025 & 2033
- Figure 52: Asia Pacific Intraocular Cataract Lenses Implants Volume (K), by Application 2025 & 2033
- Figure 53: Asia Pacific Intraocular Cataract Lenses Implants Revenue Share (%), by Application 2025 & 2033
- Figure 54: Asia Pacific Intraocular Cataract Lenses Implants Volume Share (%), by Application 2025 & 2033
- Figure 55: Asia Pacific Intraocular Cataract Lenses Implants Revenue (undefined), by Types 2025 & 2033
- Figure 56: Asia Pacific Intraocular Cataract Lenses Implants Volume (K), by Types 2025 & 2033
- Figure 57: Asia Pacific Intraocular Cataract Lenses Implants Revenue Share (%), by Types 2025 & 2033
- Figure 58: Asia Pacific Intraocular Cataract Lenses Implants Volume Share (%), by Types 2025 & 2033
- Figure 59: Asia Pacific Intraocular Cataract Lenses Implants Revenue (undefined), by Country 2025 & 2033
- Figure 60: Asia Pacific Intraocular Cataract Lenses Implants Volume (K), by Country 2025 & 2033
- Figure 61: Asia Pacific Intraocular Cataract Lenses Implants Revenue Share (%), by Country 2025 & 2033
- Figure 62: Asia Pacific Intraocular Cataract Lenses Implants Volume Share (%), by Country 2025 & 2033
List of Tables
- Table 1: Global Intraocular Cataract Lenses Implants Revenue undefined Forecast, by Application 2020 & 2033
- Table 2: Global Intraocular Cataract Lenses Implants Volume K Forecast, by Application 2020 & 2033
- Table 3: Global Intraocular Cataract Lenses Implants Revenue undefined Forecast, by Types 2020 & 2033
- Table 4: Global Intraocular Cataract Lenses Implants Volume K Forecast, by Types 2020 & 2033
- Table 5: Global Intraocular Cataract Lenses Implants Revenue undefined Forecast, by Region 2020 & 2033
- Table 6: Global Intraocular Cataract Lenses Implants Volume K Forecast, by Region 2020 & 2033
- Table 7: Global Intraocular Cataract Lenses Implants Revenue undefined Forecast, by Application 2020 & 2033
- Table 8: Global Intraocular Cataract Lenses Implants Volume K Forecast, by Application 2020 & 2033
- Table 9: Global Intraocular Cataract Lenses Implants Revenue undefined Forecast, by Types 2020 & 2033
- Table 10: Global Intraocular Cataract Lenses Implants Volume K Forecast, by Types 2020 & 2033
- Table 11: Global Intraocular Cataract Lenses Implants Revenue undefined Forecast, by Country 2020 & 2033
- Table 12: Global Intraocular Cataract Lenses Implants Volume K Forecast, by Country 2020 & 2033
- Table 13: United States Intraocular Cataract Lenses Implants Revenue (undefined) Forecast, by Application 2020 & 2033
- Table 14: United States Intraocular Cataract Lenses Implants Volume (K) Forecast, by Application 2020 & 2033
- Table 15: Canada Intraocular Cataract Lenses Implants Revenue (undefined) Forecast, by Application 2020 & 2033
- Table 16: Canada Intraocular Cataract Lenses Implants Volume (K) Forecast, by Application 2020 & 2033
- Table 17: Mexico Intraocular Cataract Lenses Implants Revenue (undefined) Forecast, by Application 2020 & 2033
- Table 18: Mexico Intraocular Cataract Lenses Implants Volume (K) Forecast, by Application 2020 & 2033
- Table 19: Global Intraocular Cataract Lenses Implants Revenue undefined Forecast, by Application 2020 & 2033
- Table 20: Global Intraocular Cataract Lenses Implants Volume K Forecast, by Application 2020 & 2033
- Table 21: Global Intraocular Cataract Lenses Implants Revenue undefined Forecast, by Types 2020 & 2033
- Table 22: Global Intraocular Cataract Lenses Implants Volume K Forecast, by Types 2020 & 2033
- Table 23: Global Intraocular Cataract Lenses Implants Revenue undefined Forecast, by Country 2020 & 2033
- Table 24: Global Intraocular Cataract Lenses Implants Volume K Forecast, by Country 2020 & 2033
- Table 25: Brazil Intraocular Cataract Lenses Implants Revenue (undefined) Forecast, by Application 2020 & 2033
- Table 26: Brazil Intraocular Cataract Lenses Implants Volume (K) Forecast, by Application 2020 & 2033
- Table 27: Argentina Intraocular Cataract Lenses Implants Revenue (undefined) Forecast, by Application 2020 & 2033
- Table 28: Argentina Intraocular Cataract Lenses Implants Volume (K) Forecast, by Application 2020 & 2033
- Table 29: Rest of South America Intraocular Cataract Lenses Implants Revenue (undefined) Forecast, by Application 2020 & 2033
- Table 30: Rest of South America Intraocular Cataract Lenses Implants Volume (K) Forecast, by Application 2020 & 2033
- Table 31: Global Intraocular Cataract Lenses Implants Revenue undefined Forecast, by Application 2020 & 2033
- Table 32: Global Intraocular Cataract Lenses Implants Volume K Forecast, by Application 2020 & 2033
- Table 33: Global Intraocular Cataract Lenses Implants Revenue undefined Forecast, by Types 2020 & 2033
- Table 34: Global Intraocular Cataract Lenses Implants Volume K Forecast, by Types 2020 & 2033
- Table 35: Global Intraocular Cataract Lenses Implants Revenue undefined Forecast, by Country 2020 & 2033
- Table 36: Global Intraocular Cataract Lenses Implants Volume K Forecast, by Country 2020 & 2033
- Table 37: United Kingdom Intraocular Cataract Lenses Implants Revenue (undefined) Forecast, by Application 2020 & 2033
- Table 38: United Kingdom Intraocular Cataract Lenses Implants Volume (K) Forecast, by Application 2020 & 2033
- Table 39: Germany Intraocular Cataract Lenses Implants Revenue (undefined) Forecast, by Application 2020 & 2033
- Table 40: Germany Intraocular Cataract Lenses Implants Volume (K) Forecast, by Application 2020 & 2033
- Table 41: France Intraocular Cataract Lenses Implants Revenue (undefined) Forecast, by Application 2020 & 2033
- Table 42: France Intraocular Cataract Lenses Implants Volume (K) Forecast, by Application 2020 & 2033
- Table 43: Italy Intraocular Cataract Lenses Implants Revenue (undefined) Forecast, by Application 2020 & 2033
- Table 44: Italy Intraocular Cataract Lenses Implants Volume (K) Forecast, by Application 2020 & 2033
- Table 45: Spain Intraocular Cataract Lenses Implants Revenue (undefined) Forecast, by Application 2020 & 2033
- Table 46: Spain Intraocular Cataract Lenses Implants Volume (K) Forecast, by Application 2020 & 2033
- Table 47: Russia Intraocular Cataract Lenses Implants Revenue (undefined) Forecast, by Application 2020 & 2033
- Table 48: Russia Intraocular Cataract Lenses Implants Volume (K) Forecast, by Application 2020 & 2033
- Table 49: Benelux Intraocular Cataract Lenses Implants Revenue (undefined) Forecast, by Application 2020 & 2033
- Table 50: Benelux Intraocular Cataract Lenses Implants Volume (K) Forecast, by Application 2020 & 2033
- Table 51: Nordics Intraocular Cataract Lenses Implants Revenue (undefined) Forecast, by Application 2020 & 2033
- Table 52: Nordics Intraocular Cataract Lenses Implants Volume (K) Forecast, by Application 2020 & 2033
- Table 53: Rest of Europe Intraocular Cataract Lenses Implants Revenue (undefined) Forecast, by Application 2020 & 2033
- Table 54: Rest of Europe Intraocular Cataract Lenses Implants Volume (K) Forecast, by Application 2020 & 2033
- Table 55: Global Intraocular Cataract Lenses Implants Revenue undefined Forecast, by Application 2020 & 2033
- Table 56: Global Intraocular Cataract Lenses Implants Volume K Forecast, by Application 2020 & 2033
- Table 57: Global Intraocular Cataract Lenses Implants Revenue undefined Forecast, by Types 2020 & 2033
- Table 58: Global Intraocular Cataract Lenses Implants Volume K Forecast, by Types 2020 & 2033
- Table 59: Global Intraocular Cataract Lenses Implants Revenue undefined Forecast, by Country 2020 & 2033
- Table 60: Global Intraocular Cataract Lenses Implants Volume K Forecast, by Country 2020 & 2033
- Table 61: Turkey Intraocular Cataract Lenses Implants Revenue (undefined) Forecast, by Application 2020 & 2033
- Table 62: Turkey Intraocular Cataract Lenses Implants Volume (K) Forecast, by Application 2020 & 2033
- Table 63: Israel Intraocular Cataract Lenses Implants Revenue (undefined) Forecast, by Application 2020 & 2033
- Table 64: Israel Intraocular Cataract Lenses Implants Volume (K) Forecast, by Application 2020 & 2033
- Table 65: GCC Intraocular Cataract Lenses Implants Revenue (undefined) Forecast, by Application 2020 & 2033
- Table 66: GCC Intraocular Cataract Lenses Implants Volume (K) Forecast, by Application 2020 & 2033
- Table 67: North Africa Intraocular Cataract Lenses Implants Revenue (undefined) Forecast, by Application 2020 & 2033
- Table 68: North Africa Intraocular Cataract Lenses Implants Volume (K) Forecast, by Application 2020 & 2033
- Table 69: South Africa Intraocular Cataract Lenses Implants Revenue (undefined) Forecast, by Application 2020 & 2033
- Table 70: South Africa Intraocular Cataract Lenses Implants Volume (K) Forecast, by Application 2020 & 2033
- Table 71: Rest of Middle East & Africa Intraocular Cataract Lenses Implants Revenue (undefined) Forecast, by Application 2020 & 2033
- Table 72: Rest of Middle East & Africa Intraocular Cataract Lenses Implants Volume (K) Forecast, by Application 2020 & 2033
- Table 73: Global Intraocular Cataract Lenses Implants Revenue undefined Forecast, by Application 2020 & 2033
- Table 74: Global Intraocular Cataract Lenses Implants Volume K Forecast, by Application 2020 & 2033
- Table 75: Global Intraocular Cataract Lenses Implants Revenue undefined Forecast, by Types 2020 & 2033
- Table 76: Global Intraocular Cataract Lenses Implants Volume K Forecast, by Types 2020 & 2033
- Table 77: Global Intraocular Cataract Lenses Implants Revenue undefined Forecast, by Country 2020 & 2033
- Table 78: Global Intraocular Cataract Lenses Implants Volume K Forecast, by Country 2020 & 2033
- Table 79: China Intraocular Cataract Lenses Implants Revenue (undefined) Forecast, by Application 2020 & 2033
- Table 80: China Intraocular Cataract Lenses Implants Volume (K) Forecast, by Application 2020 & 2033
- Table 81: India Intraocular Cataract Lenses Implants Revenue (undefined) Forecast, by Application 2020 & 2033
- Table 82: India Intraocular Cataract Lenses Implants Volume (K) Forecast, by Application 2020 & 2033
- Table 83: Japan Intraocular Cataract Lenses Implants Revenue (undefined) Forecast, by Application 2020 & 2033
- Table 84: Japan Intraocular Cataract Lenses Implants Volume (K) Forecast, by Application 2020 & 2033
- Table 85: South Korea Intraocular Cataract Lenses Implants Revenue (undefined) Forecast, by Application 2020 & 2033
- Table 86: South Korea Intraocular Cataract Lenses Implants Volume (K) Forecast, by Application 2020 & 2033
- Table 87: ASEAN Intraocular Cataract Lenses Implants Revenue (undefined) Forecast, by Application 2020 & 2033
- Table 88: ASEAN Intraocular Cataract Lenses Implants Volume (K) Forecast, by Application 2020 & 2033
- Table 89: Oceania Intraocular Cataract Lenses Implants Revenue (undefined) Forecast, by Application 2020 & 2033
- Table 90: Oceania Intraocular Cataract Lenses Implants Volume (K) Forecast, by Application 2020 & 2033
- Table 91: Rest of Asia Pacific Intraocular Cataract Lenses Implants Revenue (undefined) Forecast, by Application 2020 & 2033
- Table 92: Rest of Asia Pacific Intraocular Cataract Lenses Implants Volume (K) Forecast, by Application 2020 & 2033
Frequently Asked Questions
1. What is the projected Compound Annual Growth Rate (CAGR) of the Intraocular Cataract Lenses Implants?
The projected CAGR is approximately 14.6%.
2. Which companies are prominent players in the Intraocular Cataract Lenses Implants?
Key companies in the market include Alcon, Bausch & Lomb, AMO (J&J), HOYA, CARL Zeiss, OPHTEC, HumanOptics, Rayner, STAAR Surgical, Haohai Biological Technology, Eyebright, Vision Pro.
3. What are the main segments of the Intraocular Cataract Lenses Implants?
The market segments include Application, Types.
4. Can you provide details about the market size?
The market size is estimated to be USD XXX N/A as of 2022.
5. What are some drivers contributing to market growth?
N/A
6. What are the notable trends driving market growth?
N/A
7. Are there any restraints impacting market growth?
N/A
8. Can you provide examples of recent developments in the market?
N/A
9. What pricing options are available for accessing the report?
Pricing options include single-user, multi-user, and enterprise licenses priced at USD 3350.00, USD 5025.00, and USD 6700.00 respectively.
10. Is the market size provided in terms of value or volume?
The market size is provided in terms of value, measured in N/A and volume, measured in K.
11. Are there any specific market keywords associated with the report?
Yes, the market keyword associated with the report is "Intraocular Cataract Lenses Implants," which aids in identifying and referencing the specific market segment covered.
12. How do I determine which pricing option suits my needs best?
The pricing options vary based on user requirements and access needs. Individual users may opt for single-user licenses, while businesses requiring broader access may choose multi-user or enterprise licenses for cost-effective access to the report.
13. Are there any additional resources or data provided in the Intraocular Cataract Lenses Implants report?
While the report offers comprehensive insights, it's advisable to review the specific contents or supplementary materials provided to ascertain if additional resources or data are available.
14. How can I stay updated on further developments or reports in the Intraocular Cataract Lenses Implants?
To stay informed about further developments, trends, and reports in the Intraocular Cataract Lenses Implants, consider subscribing to industry newsletters, following relevant companies and organizations, or regularly checking reputable industry news sources and publications.
Methodology
Step 1 - Identification of Relevant Samples Size from Population Database


Step 2 - Approaches for Defining Global Market Size (Value, Volume* & Price*)

Note*: In applicable scenarios
Step 3 - Data Sources
Primary Research
- Web Analytics
- Survey Reports
- Research Institute
- Latest Research Reports
- Opinion Leaders
Secondary Research
- Annual Reports
- White Paper
- Latest Press Release
- Industry Association
- Paid Database
- Investor Presentations

Step 4 - Data Triangulation
Involves using different sources of information in order to increase the validity of a study
These sources are likely to be stakeholders in a program - participants, other researchers, program staff, other community members, and so on.
Then we put all data in single framework & apply various statistical tools to find out the dynamic on the market.
During the analysis stage, feedback from the stakeholder groups would be compared to determine areas of agreement as well as areas of divergence