

Key Insights
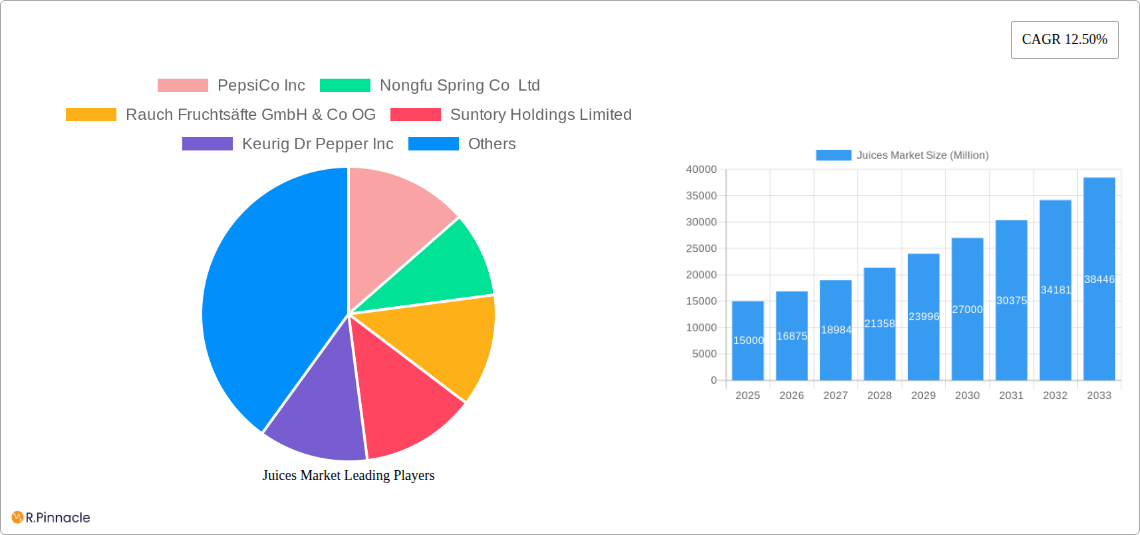
The global juice market, valued at approximately $159.1 billion in 2024, is projected to experience significant expansion, exhibiting a compound annual growth rate (CAGR) of 4.31% from 2025 to 2033. This growth is propelled by increasing consumer demand for healthier beverage choices, particularly among younger demographics, driven by greater awareness of the nutritional advantages of fruit and vegetable consumption. Enhanced convenience through innovative packaging solutions and expanded distribution networks across both retail and foodservice sectors are further fueling market penetration. Emerging economies present substantial opportunities due to rising disposable incomes and evolving lifestyles. Key challenges include price volatility of raw fruits, concerns regarding added sugars in certain juice formulations, and competition from alternative beverages. The market is primarily segmented by juice type, with 100% juice leading in demand, followed by nectars and juice drinks. Leading industry players are focusing on brand strength, distribution, strategic acquisitions, product innovation, and sustainable packaging to maintain a competitive position.
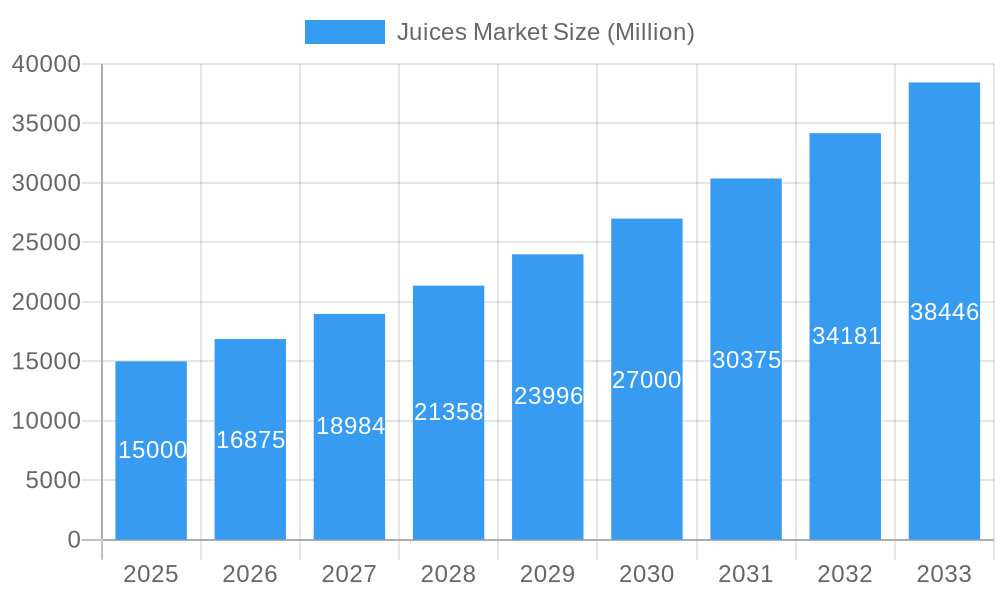
Juices Market Market Size (In Billion)
Consumer preferences within the juice market are diverse. The 100% juice segment is anticipated to maintain its leading position, attributed to its perceived health benefits. Juice drinks, despite lower juice content, hold a considerable market share owing to their affordability and broader consumer appeal. Packaging preferences are influenced by regional factors and consumer habits, with PET bottles offering portability and aseptic packaging ensuring extended shelf life. The off-trade distribution channel currently dominates, reflecting widespread retail availability. The on-trade sector is poised for growth, driven by the increasing demand for healthy options in hospitality settings. Regional market dynamics vary, with mature developed markets and rapidly growing developing markets offering distinct opportunities shaped by urbanization and shifting consumer tastes. Future market trends will be influenced by evolving health and wellness preferences, advancements in processing and packaging technologies, and the industry's commitment to addressing sugar content and sustainability concerns.
Juices Market Company Market Share
Juices Market Report: 2019-2033 Forecast
This comprehensive report provides an in-depth analysis of the global Juices Market, covering the period 2019-2033. It offers actionable insights into market dynamics, competitive landscapes, and future growth potential, making it an essential resource for industry professionals, investors, and strategic planners. The report leverages extensive market research to provide detailed forecasts and analysis across key segments, including soft drink types, packaging, distribution channels, and geographic regions. With a base year of 2025 and an estimated year of 2025, this report projects the market's trajectory through 2033. The total market value is predicted to reach xx Million by 2033.
Juices Market Market Structure & Innovation Trends
This section analyzes the Juices Market's structure, highlighting key players, their market share, and innovative strategies. The report delves into the competitive landscape, identifying factors driving innovation, such as consumer demand for healthier options and sustainable packaging. Regulatory frameworks impacting the market are also examined, alongside an analysis of product substitutes and their market impact. Mergers and acquisitions (M&A) activities within the industry are detailed, including deal values and their influence on market consolidation.
- Market Concentration: The market is moderately concentrated, with key players like PepsiCo Inc, The Coca-Cola Company, and Suntory Holdings Limited holding significant shares. The exact market share distribution is detailed within the report.
- Innovation Drivers: Health and wellness trends, coupled with increasing demand for convenient packaging, are major drivers of innovation. Sustainability concerns are also shaping product development.
- Regulatory Frameworks: Government regulations concerning sugar content, labeling, and food safety significantly impact market operations. The report analyses the implications of key regulations across various regions.
- Product Substitutes: Other beverages like water, tea, and sports drinks pose competitive challenges to the juice market. The report analyzes the market share of these substitutes.
- End-User Demographics: The report segments consumers based on age, lifestyle, and purchasing habits, highlighting key demographics driving market growth.
- M&A Activities: The report provides a comprehensive overview of recent M&A activities, including deal values and their impact on market consolidation. For example, the report details the predicted influence of the Capri-Sun takeover of Coca-Cola's distribution network. The total value of M&A deals in the historical period (2019-2024) is estimated at xx Million.
Juices Market Market Dynamics & Trends
This section explores the key factors driving market growth, technological advancements, consumer behavior, and competitive forces within the Juices Market. The report presents a detailed analysis of market dynamics, examining growth drivers, technological disruptions, evolving consumer preferences, and the competitive landscape.
The report provides a detailed breakdown of the compound annual growth rate (CAGR) and market penetration for different segments, alongside an in-depth analysis of factors influencing market growth. The detailed analysis covers the historical period (2019-2024) and extends to the forecast period (2025-2033), providing a comprehensive understanding of market trends and future potential. The predicted CAGR for the forecast period is xx%.
Dominant Regions & Segments in Juices Market
This section identifies the leading regions, countries, and market segments within the Juices Market. The analysis focuses on key growth drivers in each region, such as economic conditions and infrastructure development. Dominant segments are identified based on market size, growth rate, and competitive intensity. Key drivers are outlined using bullet points, followed by detailed paragraphs providing deeper insights into market dominance.
- Leading Region: [Insert Leading Region - e.g., North America]
- Leading Country: [Insert Leading Country - e.g., USA]
- Dominant Segments: The report highlights dominant segments across all categories (Soft Drink Type, Packaging Type, Distribution Channel). A detailed analysis of each segment, including market size and growth projections, is included. For instance, the report will highlight whether PET bottles dominate packaging or if the off-trade channel holds a larger market share than the on-trade channel.
Key Drivers (Examples):
- Strong consumer spending power.
- Favorable economic policies.
- Efficient distribution networks.
- High disposable income.
Juices Market Product Innovations
This section summarizes recent product developments, focusing on technological advancements and their market relevance. The report examines the competitive advantages offered by new products and analyzes their market fit, considering factors such as consumer preferences and technological trends. The section highlights how recent innovations in packaging, such as sustainable materials and convenient formats, are reshaping the market.
Report Scope & Segmentation Analysis
The report's scope encompasses a comprehensive analysis of the Juices Market, segmented by various parameters, including soft drink type (100% Juice, Juice Drinks, Juice concentrates, Nectars), packaging type (Aseptic packages, Disposable Cups, Glass Bottles, Metal Can, PET Bottles), and distribution channel (Off-trade, On-trade). Each segment is analyzed individually, including growth projections and competitive dynamics. The report includes market size estimations for each segment.
Key Drivers of Juices Market Growth
Key drivers of Juices Market growth include increasing health consciousness, shifting consumer preferences towards convenient and healthier beverages, and advancements in packaging technologies that enhance product shelf life and appeal. Favorable economic conditions in key markets also contribute to market expansion. Specific examples of these drivers and their impact are detailed in the full report.
Challenges in the Juices Market Sector
The Juices Market faces challenges including fluctuating raw material prices, stringent regulations regarding sugar content and additives, and intense competition from other beverage categories. Supply chain disruptions can also impact market stability. The report quantifies the impact of these challenges on market growth.
Emerging Opportunities in Juices Market
Emerging opportunities include the growing demand for functional juices, organic and natural juices, and innovative packaging solutions. Expanding into new markets and leveraging technological advancements to improve efficiency and sustainability present further opportunities. The report explores specific examples of these opportunities.
Leading Players in the Juices Market Market
- PepsiCo Inc (PepsiCo Inc)
- Nongfu Spring Co Ltd
- Rauch Fruchtsäfte GmbH & Co OG
- Suntory Holdings Limited (Suntory Holdings Limited)
- Keurig Dr Pepper Inc (Keurig Dr Pepper Inc)
- The Kraft Heinz Company (The Kraft Heinz Company)
- Tingyi (Cayman Islands) Holding Corporation
- The Coca-Cola Company (The Coca-Cola Company)
- Uni-President Enterprises Corp
- Britvic PLC (Britvic PLC)
- Tropicana Brands Group
- Thai Beverages PCL
- Eckes-Granini Group GmbH
Key Developments in Juices Market Industry
- July 2022: Capri Sun reduced added sugar content by 40% using monk fruit juice, reducing sugar from 8gm to 5gm per pouch. This highlights a growing trend towards healthier options.
- February 2023: Capri Sun announced a takeover of Coca-Cola's sales and distribution of pouch fruit juice drinks in several European countries by 2024. This signifies a significant shift in market dynamics.
- June 2023: Capri-Sun launched a new Jungle Drink in six flavors (Guava, Pineapple, Passionfruit, Orange & Lemon). This product launch demonstrates ongoing innovation within the market.
Future Outlook for Juices Market Market
The future of the Juices Market looks promising, driven by sustained demand for healthy and convenient beverages, innovative product development, and expansion into new markets. Strategic partnerships and mergers and acquisitions will likely continue to shape the industry landscape, contributing to market growth and consolidation. The market is poised for significant expansion in the forecast period (2025-2033), with opportunities for companies that can effectively adapt to changing consumer preferences and technological advancements.
Juices Market Segmentation
-
1. Soft Drink Type
- 1.1. 100% Juice
- 1.2. Juice Drinks (up to 24% Juice)
- 1.3. Juice concentrates
- 1.4. Nectars (25-99% Juice)
-
2. Packaging Type
- 2.1. Aseptic packages
- 2.2. Disposable Cups
- 2.3. Glass Bottles
- 2.4. Metal Can
- 2.5. PET Bottles
-
3. Distribution Channel
-
3.1. Off-trade
- 3.1.1. Convenience Stores
- 3.1.2. Online Retail
- 3.1.3. Supermarket/Hypermarket
- 3.1.4. Others
- 3.2. On-trade
-
3.1. Off-trade
Juices Market Segmentation By Geography
-
1. North America
- 1.1. United States
- 1.2. Canada
- 1.3. Mexico
-
2. South America
- 2.1. Brazil
- 2.2. Argentina
- 2.3. Rest of South America
-
3. Europe
- 3.1. United Kingdom
- 3.2. Germany
- 3.3. France
- 3.4. Italy
- 3.5. Spain
- 3.6. Russia
- 3.7. Benelux
- 3.8. Nordics
- 3.9. Rest of Europe
-
4. Middle East & Africa
- 4.1. Turkey
- 4.2. Israel
- 4.3. GCC
- 4.4. North Africa
- 4.5. South Africa
- 4.6. Rest of Middle East & Africa
-
5. Asia Pacific
- 5.1. China
- 5.2. India
- 5.3. Japan
- 5.4. South Korea
- 5.5. ASEAN
- 5.6. Oceania
- 5.7. Rest of Asia Pacific
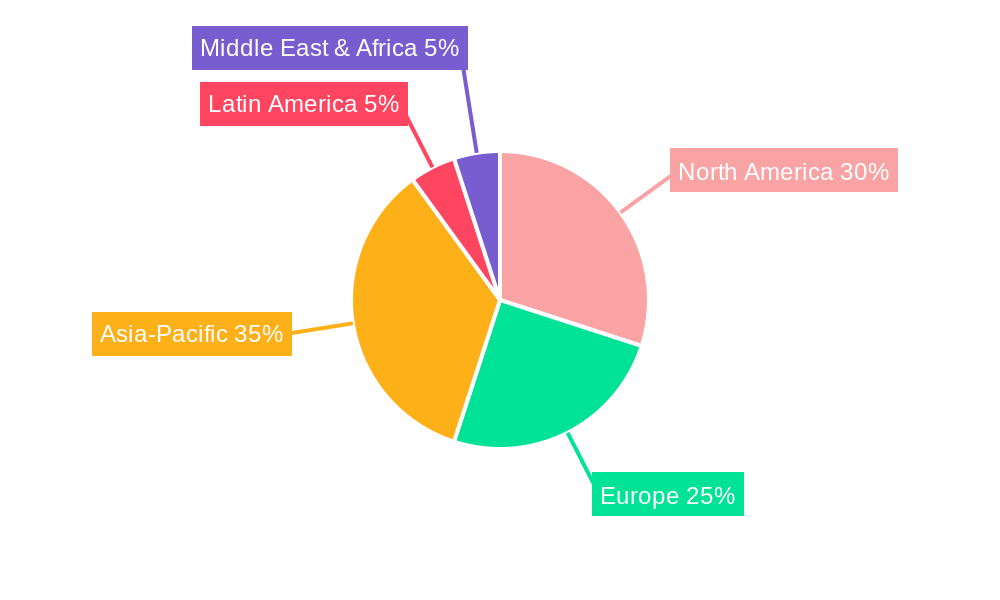
Juices Market Regional Market Share
Geographic Coverage of Juices Market
Juices Market REPORT HIGHLIGHTS
| Aspects | Details |
|---|---|
| Study Period | 2020-2034 |
| Base Year | 2025 |
| Estimated Year | 2026 |
| Forecast Period | 2026-2034 |
| Historical Period | 2020-2025 |
| Growth Rate | CAGR of 4.31% from 2020-2034 |
| Segmentation |
|
Table of Contents
- 1. Introduction
- 1.1. Research Scope
- 1.2. Market Segmentation
- 1.3. Research Objective
- 1.4. Definitions and Assumptions
- 2. Executive Summary
- 2.1. Market Snapshot
- 3. Market Dynamics
- 3.1. Market Drivers
- 3.2. Market Restrains
- 3.3. Market Trends
- 3.4. Market Opportunities
- 4. Market Factor Analysis
- 4.1. Porters Five Forces
- 4.1.1. Bargaining Power of Suppliers
- 4.1.2. Bargaining Power of Buyers
- 4.1.3. Threat of New Entrants
- 4.1.4. Threat of Substitutes
- 4.1.5. Competitive Rivalry
- 4.2. PESTEL analysis
- 4.3. BCG Analysis
- 4.3.1. Stars (High Growth, High Market Share)
- 4.3.2. Cash Cows (Low Growth, High Market Share)
- 4.3.3. Question Mark (High Growth, Low Market Share)
- 4.3.4. Dogs (Low Growth, Low Market Share)
- 4.4. Ansoff Matrix Analysis
- 4.5. Supply Chain Analysis
- 4.6. Regulatory Landscape
- 4.7. Current Market Potential and Opportunity Assessment (TAM–SAM–SOM Framework)
- 4.8. PRI Analyst Note
- 4.1. Porters Five Forces
- 5. Market Analysis, Insights and Forecast 2021-2033
- 5.1. Market Analysis, Insights and Forecast - by Soft Drink Type
- 5.1.1. 100% Juice
- 5.1.2. Juice Drinks (up to 24% Juice)
- 5.1.3. Juice concentrates
- 5.1.4. Nectars (25-99% Juice)
- 5.2. Market Analysis, Insights and Forecast - by Packaging Type
- 5.2.1. Aseptic packages
- 5.2.2. Disposable Cups
- 5.2.3. Glass Bottles
- 5.2.4. Metal Can
- 5.2.5. PET Bottles
- 5.3. Market Analysis, Insights and Forecast - by Distribution Channel
- 5.3.1. Off-trade
- 5.3.1.1. Convenience Stores
- 5.3.1.2. Online Retail
- 5.3.1.3. Supermarket/Hypermarket
- 5.3.1.4. Others
- 5.3.2. On-trade
- 5.3.1. Off-trade
- 5.4. Market Analysis, Insights and Forecast - by Region
- 5.4.1. North America
- 5.4.2. South America
- 5.4.3. Europe
- 5.4.4. Middle East & Africa
- 5.4.5. Asia Pacific
- 5.1. Market Analysis, Insights and Forecast - by Soft Drink Type
- 6. Global Juices Market Analysis, Insights and Forecast, 2021-2033
- 6.1. Market Analysis, Insights and Forecast - by Soft Drink Type
- 6.1.1. 100% Juice
- 6.1.2. Juice Drinks (up to 24% Juice)
- 6.1.3. Juice concentrates
- 6.1.4. Nectars (25-99% Juice)
- 6.2. Market Analysis, Insights and Forecast - by Packaging Type
- 6.2.1. Aseptic packages
- 6.2.2. Disposable Cups
- 6.2.3. Glass Bottles
- 6.2.4. Metal Can
- 6.2.5. PET Bottles
- 6.3. Market Analysis, Insights and Forecast - by Distribution Channel
- 6.3.1. Off-trade
- 6.3.1.1. Convenience Stores
- 6.3.1.2. Online Retail
- 6.3.1.3. Supermarket/Hypermarket
- 6.3.1.4. Others
- 6.3.2. On-trade
- 6.3.1. Off-trade
- 6.1. Market Analysis, Insights and Forecast - by Soft Drink Type
- 7. North America Juices Market Analysis, Insights and Forecast, 2020-2032
- 7.1. Market Analysis, Insights and Forecast - by Soft Drink Type
- 7.1.1. 100% Juice
- 7.1.2. Juice Drinks (up to 24% Juice)
- 7.1.3. Juice concentrates
- 7.1.4. Nectars (25-99% Juice)
- 7.2. Market Analysis, Insights and Forecast - by Packaging Type
- 7.2.1. Aseptic packages
- 7.2.2. Disposable Cups
- 7.2.3. Glass Bottles
- 7.2.4. Metal Can
- 7.2.5. PET Bottles
- 7.3. Market Analysis, Insights and Forecast - by Distribution Channel
- 7.3.1. Off-trade
- 7.3.1.1. Convenience Stores
- 7.3.1.2. Online Retail
- 7.3.1.3. Supermarket/Hypermarket
- 7.3.1.4. Others
- 7.3.2. On-trade
- 7.3.1. Off-trade
- 7.1. Market Analysis, Insights and Forecast - by Soft Drink Type
- 8. South America Juices Market Analysis, Insights and Forecast, 2020-2032
- 8.1. Market Analysis, Insights and Forecast - by Soft Drink Type
- 8.1.1. 100% Juice
- 8.1.2. Juice Drinks (up to 24% Juice)
- 8.1.3. Juice concentrates
- 8.1.4. Nectars (25-99% Juice)
- 8.2. Market Analysis, Insights and Forecast - by Packaging Type
- 8.2.1. Aseptic packages
- 8.2.2. Disposable Cups
- 8.2.3. Glass Bottles
- 8.2.4. Metal Can
- 8.2.5. PET Bottles
- 8.3. Market Analysis, Insights and Forecast - by Distribution Channel
- 8.3.1. Off-trade
- 8.3.1.1. Convenience Stores
- 8.3.1.2. Online Retail
- 8.3.1.3. Supermarket/Hypermarket
- 8.3.1.4. Others
- 8.3.2. On-trade
- 8.3.1. Off-trade
- 8.1. Market Analysis, Insights and Forecast - by Soft Drink Type
- 9. Europe Juices Market Analysis, Insights and Forecast, 2020-2032
- 9.1. Market Analysis, Insights and Forecast - by Soft Drink Type
- 9.1.1. 100% Juice
- 9.1.2. Juice Drinks (up to 24% Juice)
- 9.1.3. Juice concentrates
- 9.1.4. Nectars (25-99% Juice)
- 9.2. Market Analysis, Insights and Forecast - by Packaging Type
- 9.2.1. Aseptic packages
- 9.2.2. Disposable Cups
- 9.2.3. Glass Bottles
- 9.2.4. Metal Can
- 9.2.5. PET Bottles
- 9.3. Market Analysis, Insights and Forecast - by Distribution Channel
- 9.3.1. Off-trade
- 9.3.1.1. Convenience Stores
- 9.3.1.2. Online Retail
- 9.3.1.3. Supermarket/Hypermarket
- 9.3.1.4. Others
- 9.3.2. On-trade
- 9.3.1. Off-trade
- 9.1. Market Analysis, Insights and Forecast - by Soft Drink Type
- 10. Middle East & Africa Juices Market Analysis, Insights and Forecast, 2020-2032
- 10.1. Market Analysis, Insights and Forecast - by Soft Drink Type
- 10.1.1. 100% Juice
- 10.1.2. Juice Drinks (up to 24% Juice)
- 10.1.3. Juice concentrates
- 10.1.4. Nectars (25-99% Juice)
- 10.2. Market Analysis, Insights and Forecast - by Packaging Type
- 10.2.1. Aseptic packages
- 10.2.2. Disposable Cups
- 10.2.3. Glass Bottles
- 10.2.4. Metal Can
- 10.2.5. PET Bottles
- 10.3. Market Analysis, Insights and Forecast - by Distribution Channel
- 10.3.1. Off-trade
- 10.3.1.1. Convenience Stores
- 10.3.1.2. Online Retail
- 10.3.1.3. Supermarket/Hypermarket
- 10.3.1.4. Others
- 10.3.2. On-trade
- 10.3.1. Off-trade
- 10.1. Market Analysis, Insights and Forecast - by Soft Drink Type
- 11. Asia Pacific Juices Market Analysis, Insights and Forecast, 2020-2032
- 11.1. Market Analysis, Insights and Forecast - by Soft Drink Type
- 11.1.1. 100% Juice
- 11.1.2. Juice Drinks (up to 24% Juice)
- 11.1.3. Juice concentrates
- 11.1.4. Nectars (25-99% Juice)
- 11.2. Market Analysis, Insights and Forecast - by Packaging Type
- 11.2.1. Aseptic packages
- 11.2.2. Disposable Cups
- 11.2.3. Glass Bottles
- 11.2.4. Metal Can
- 11.2.5. PET Bottles
- 11.3. Market Analysis, Insights and Forecast - by Distribution Channel
- 11.3.1. Off-trade
- 11.3.1.1. Convenience Stores
- 11.3.1.2. Online Retail
- 11.3.1.3. Supermarket/Hypermarket
- 11.3.1.4. Others
- 11.3.2. On-trade
- 11.3.1. Off-trade
- 11.1. Market Analysis, Insights and Forecast - by Soft Drink Type
- 12. Competitive Analysis
- 12.1. Company Profiles
- 12.1.1 PepsiCo Inc
- 12.1.1.1. Company Overview
- 12.1.1.2. Products
- 12.1.1.3. Company Financials
- 12.1.1.4. SWOT Analysis
- 12.1.2 Nongfu Spring Co Ltd
- 12.1.2.1. Company Overview
- 12.1.2.2. Products
- 12.1.2.3. Company Financials
- 12.1.2.4. SWOT Analysis
- 12.1.3 Rauch Fruchtsäfte GmbH & Co OG
- 12.1.3.1. Company Overview
- 12.1.3.2. Products
- 12.1.3.3. Company Financials
- 12.1.3.4. SWOT Analysis
- 12.1.4 Suntory Holdings Limited
- 12.1.4.1. Company Overview
- 12.1.4.2. Products
- 12.1.4.3. Company Financials
- 12.1.4.4. SWOT Analysis
- 12.1.5 Keurig Dr Pepper Inc
- 12.1.5.1. Company Overview
- 12.1.5.2. Products
- 12.1.5.3. Company Financials
- 12.1.5.4. SWOT Analysis
- 12.1.6 The Kraft Heinz Company
- 12.1.6.1. Company Overview
- 12.1.6.2. Products
- 12.1.6.3. Company Financials
- 12.1.6.4. SWOT Analysis
- 12.1.7 Tingyi (Cayman Islands) Holding Corporation
- 12.1.7.1. Company Overview
- 12.1.7.2. Products
- 12.1.7.3. Company Financials
- 12.1.7.4. SWOT Analysis
- 12.1.8 The Coca-Cola Company
- 12.1.8.1. Company Overview
- 12.1.8.2. Products
- 12.1.8.3. Company Financials
- 12.1.8.4. SWOT Analysis
- 12.1.9 Uni-President Enterprises Corp
- 12.1.9.1. Company Overview
- 12.1.9.2. Products
- 12.1.9.3. Company Financials
- 12.1.9.4. SWOT Analysis
- 12.1.10 Britvic PLC
- 12.1.10.1. Company Overview
- 12.1.10.2. Products
- 12.1.10.3. Company Financials
- 12.1.10.4. SWOT Analysis
- 12.1.11 Tropicana Brands Group
- 12.1.11.1. Company Overview
- 12.1.11.2. Products
- 12.1.11.3. Company Financials
- 12.1.11.4. SWOT Analysis
- 12.1.12 Thai Beverages PCL
- 12.1.12.1. Company Overview
- 12.1.12.2. Products
- 12.1.12.3. Company Financials
- 12.1.12.4. SWOT Analysis
- 12.1.13 Eckes-Granini Group GmbH
- 12.1.13.1. Company Overview
- 12.1.13.2. Products
- 12.1.13.3. Company Financials
- 12.1.13.4. SWOT Analysis
- 12.1.1 PepsiCo Inc
- 12.2. Market Entropy
- 12.2.1 Company's Key Areas Served
- 12.2.2 Recent Developments
- 12.3. Company Market Share Analysis 2025
- 12.3.1 Top 5 Companies Market Share Analysis
- 12.3.2 Top 3 Companies Market Share Analysis
- 12.4. List of Potential Customers
- 13. Research Methodology
List of Figures
- Figure 1: Global Juices Market Revenue Breakdown (billion, %) by Region 2025 & 2033
- Figure 2: North America Juices Market Revenue (billion), by Soft Drink Type 2025 & 2033
- Figure 3: North America Juices Market Revenue Share (%), by Soft Drink Type 2025 & 2033
- Figure 4: North America Juices Market Revenue (billion), by Packaging Type 2025 & 2033
- Figure 5: North America Juices Market Revenue Share (%), by Packaging Type 2025 & 2033
- Figure 6: North America Juices Market Revenue (billion), by Distribution Channel 2025 & 2033
- Figure 7: North America Juices Market Revenue Share (%), by Distribution Channel 2025 & 2033
- Figure 8: North America Juices Market Revenue (billion), by Country 2025 & 2033
- Figure 9: North America Juices Market Revenue Share (%), by Country 2025 & 2033
- Figure 10: South America Juices Market Revenue (billion), by Soft Drink Type 2025 & 2033
- Figure 11: South America Juices Market Revenue Share (%), by Soft Drink Type 2025 & 2033
- Figure 12: South America Juices Market Revenue (billion), by Packaging Type 2025 & 2033
- Figure 13: South America Juices Market Revenue Share (%), by Packaging Type 2025 & 2033
- Figure 14: South America Juices Market Revenue (billion), by Distribution Channel 2025 & 2033
- Figure 15: South America Juices Market Revenue Share (%), by Distribution Channel 2025 & 2033
- Figure 16: South America Juices Market Revenue (billion), by Country 2025 & 2033
- Figure 17: South America Juices Market Revenue Share (%), by Country 2025 & 2033
- Figure 18: Europe Juices Market Revenue (billion), by Soft Drink Type 2025 & 2033
- Figure 19: Europe Juices Market Revenue Share (%), by Soft Drink Type 2025 & 2033
- Figure 20: Europe Juices Market Revenue (billion), by Packaging Type 2025 & 2033
- Figure 21: Europe Juices Market Revenue Share (%), by Packaging Type 2025 & 2033
- Figure 22: Europe Juices Market Revenue (billion), by Distribution Channel 2025 & 2033
- Figure 23: Europe Juices Market Revenue Share (%), by Distribution Channel 2025 & 2033
- Figure 24: Europe Juices Market Revenue (billion), by Country 2025 & 2033
- Figure 25: Europe Juices Market Revenue Share (%), by Country 2025 & 2033
- Figure 26: Middle East & Africa Juices Market Revenue (billion), by Soft Drink Type 2025 & 2033
- Figure 27: Middle East & Africa Juices Market Revenue Share (%), by Soft Drink Type 2025 & 2033
- Figure 28: Middle East & Africa Juices Market Revenue (billion), by Packaging Type 2025 & 2033
- Figure 29: Middle East & Africa Juices Market Revenue Share (%), by Packaging Type 2025 & 2033
- Figure 30: Middle East & Africa Juices Market Revenue (billion), by Distribution Channel 2025 & 2033
- Figure 31: Middle East & Africa Juices Market Revenue Share (%), by Distribution Channel 2025 & 2033
- Figure 32: Middle East & Africa Juices Market Revenue (billion), by Country 2025 & 2033
- Figure 33: Middle East & Africa Juices Market Revenue Share (%), by Country 2025 & 2033
- Figure 34: Asia Pacific Juices Market Revenue (billion), by Soft Drink Type 2025 & 2033
- Figure 35: Asia Pacific Juices Market Revenue Share (%), by Soft Drink Type 2025 & 2033
- Figure 36: Asia Pacific Juices Market Revenue (billion), by Packaging Type 2025 & 2033
- Figure 37: Asia Pacific Juices Market Revenue Share (%), by Packaging Type 2025 & 2033
- Figure 38: Asia Pacific Juices Market Revenue (billion), by Distribution Channel 2025 & 2033
- Figure 39: Asia Pacific Juices Market Revenue Share (%), by Distribution Channel 2025 & 2033
- Figure 40: Asia Pacific Juices Market Revenue (billion), by Country 2025 & 2033
- Figure 41: Asia Pacific Juices Market Revenue Share (%), by Country 2025 & 2033
List of Tables
- Table 1: Global Juices Market Revenue billion Forecast, by Soft Drink Type 2020 & 2033
- Table 2: Global Juices Market Revenue billion Forecast, by Packaging Type 2020 & 2033
- Table 3: Global Juices Market Revenue billion Forecast, by Distribution Channel 2020 & 2033
- Table 4: Global Juices Market Revenue billion Forecast, by Region 2020 & 2033
- Table 5: Global Juices Market Revenue billion Forecast, by Soft Drink Type 2020 & 2033
- Table 6: Global Juices Market Revenue billion Forecast, by Packaging Type 2020 & 2033
- Table 7: Global Juices Market Revenue billion Forecast, by Distribution Channel 2020 & 2033
- Table 8: Global Juices Market Revenue billion Forecast, by Country 2020 & 2033
- Table 9: United States Juices Market Revenue (billion) Forecast, by Application 2020 & 2033
- Table 10: Canada Juices Market Revenue (billion) Forecast, by Application 2020 & 2033
- Table 11: Mexico Juices Market Revenue (billion) Forecast, by Application 2020 & 2033
- Table 12: Global Juices Market Revenue billion Forecast, by Soft Drink Type 2020 & 2033
- Table 13: Global Juices Market Revenue billion Forecast, by Packaging Type 2020 & 2033
- Table 14: Global Juices Market Revenue billion Forecast, by Distribution Channel 2020 & 2033
- Table 15: Global Juices Market Revenue billion Forecast, by Country 2020 & 2033
- Table 16: Brazil Juices Market Revenue (billion) Forecast, by Application 2020 & 2033
- Table 17: Argentina Juices Market Revenue (billion) Forecast, by Application 2020 & 2033
- Table 18: Rest of South America Juices Market Revenue (billion) Forecast, by Application 2020 & 2033
- Table 19: Global Juices Market Revenue billion Forecast, by Soft Drink Type 2020 & 2033
- Table 20: Global Juices Market Revenue billion Forecast, by Packaging Type 2020 & 2033
- Table 21: Global Juices Market Revenue billion Forecast, by Distribution Channel 2020 & 2033
- Table 22: Global Juices Market Revenue billion Forecast, by Country 2020 & 2033
- Table 23: United Kingdom Juices Market Revenue (billion) Forecast, by Application 2020 & 2033
- Table 24: Germany Juices Market Revenue (billion) Forecast, by Application 2020 & 2033
- Table 25: France Juices Market Revenue (billion) Forecast, by Application 2020 & 2033
- Table 26: Italy Juices Market Revenue (billion) Forecast, by Application 2020 & 2033
- Table 27: Spain Juices Market Revenue (billion) Forecast, by Application 2020 & 2033
- Table 28: Russia Juices Market Revenue (billion) Forecast, by Application 2020 & 2033
- Table 29: Benelux Juices Market Revenue (billion) Forecast, by Application 2020 & 2033
- Table 30: Nordics Juices Market Revenue (billion) Forecast, by Application 2020 & 2033
- Table 31: Rest of Europe Juices Market Revenue (billion) Forecast, by Application 2020 & 2033
- Table 32: Global Juices Market Revenue billion Forecast, by Soft Drink Type 2020 & 2033
- Table 33: Global Juices Market Revenue billion Forecast, by Packaging Type 2020 & 2033
- Table 34: Global Juices Market Revenue billion Forecast, by Distribution Channel 2020 & 2033
- Table 35: Global Juices Market Revenue billion Forecast, by Country 2020 & 2033
- Table 36: Turkey Juices Market Revenue (billion) Forecast, by Application 2020 & 2033
- Table 37: Israel Juices Market Revenue (billion) Forecast, by Application 2020 & 2033
- Table 38: GCC Juices Market Revenue (billion) Forecast, by Application 2020 & 2033
- Table 39: North Africa Juices Market Revenue (billion) Forecast, by Application 2020 & 2033
- Table 40: South Africa Juices Market Revenue (billion) Forecast, by Application 2020 & 2033
- Table 41: Rest of Middle East & Africa Juices Market Revenue (billion) Forecast, by Application 2020 & 2033
- Table 42: Global Juices Market Revenue billion Forecast, by Soft Drink Type 2020 & 2033
- Table 43: Global Juices Market Revenue billion Forecast, by Packaging Type 2020 & 2033
- Table 44: Global Juices Market Revenue billion Forecast, by Distribution Channel 2020 & 2033
- Table 45: Global Juices Market Revenue billion Forecast, by Country 2020 & 2033
- Table 46: China Juices Market Revenue (billion) Forecast, by Application 2020 & 2033
- Table 47: India Juices Market Revenue (billion) Forecast, by Application 2020 & 2033
- Table 48: Japan Juices Market Revenue (billion) Forecast, by Application 2020 & 2033
- Table 49: South Korea Juices Market Revenue (billion) Forecast, by Application 2020 & 2033
- Table 50: ASEAN Juices Market Revenue (billion) Forecast, by Application 2020 & 2033
- Table 51: Oceania Juices Market Revenue (billion) Forecast, by Application 2020 & 2033
- Table 52: Rest of Asia Pacific Juices Market Revenue (billion) Forecast, by Application 2020 & 2033
Frequently Asked Questions
1. What is the projected Compound Annual Growth Rate (CAGR) of the Juices Market?
The projected CAGR is approximately 4.31%.
2. Which companies are prominent players in the Juices Market?
Key companies in the market include PepsiCo Inc, Nongfu Spring Co Ltd, Rauch Fruchtsäfte GmbH & Co OG, Suntory Holdings Limited, Keurig Dr Pepper Inc, The Kraft Heinz Company, Tingyi (Cayman Islands) Holding Corporation, The Coca-Cola Company, Uni-President Enterprises Corp, Britvic PLC, Tropicana Brands Group, Thai Beverages PCL, Eckes-Granini Group GmbH.
3. What are the main segments of the Juices Market?
The market segments include Soft Drink Type, Packaging Type, Distribution Channel.
4. Can you provide details about the market size?
The market size is estimated to be USD 159.1 billion as of 2022.
5. What are some drivers contributing to market growth?
Increasing Demand for Supplement Nutrition; Growing Casein Application in Processed Food Products.
6. What are the notable trends driving market growth?
OTHER KEY INDUSTRY TRENDS COVERED IN THE REPORT.
7. Are there any restraints impacting market growth?
Competition from Vegan/Plant-based Protein Powders.
8. Can you provide examples of recent developments in the market?
June 2023: Capri-Sun launched new Jungle Drink in 6 flavours including Guava, Pineapple, Passionfruit, Orange & Lemon.February 2023: Capri Sun announced to takeover their sales and distribution of pouch fruit juice drinks from Coca Cola in France, Monaco, Great Britain, Netherlands, Belgium, Luxemburg, Sweden, Spain, and Portugal by 2024.July 2022: Capri Sun has reduced the addedsugar content by 40% using monk fruit juice. They have reduced 8gm sugar to 5gm in each pouch.
9. What pricing options are available for accessing the report?
Pricing options include single-user, multi-user, and enterprise licenses priced at USD 3800, USD 4500, and USD 5800 respectively.
10. Is the market size provided in terms of value or volume?
The market size is provided in terms of value, measured in billion.
11. Are there any specific market keywords associated with the report?
Yes, the market keyword associated with the report is "Juices Market," which aids in identifying and referencing the specific market segment covered.
12. How do I determine which pricing option suits my needs best?
The pricing options vary based on user requirements and access needs. Individual users may opt for single-user licenses, while businesses requiring broader access may choose multi-user or enterprise licenses for cost-effective access to the report.
13. Are there any additional resources or data provided in the Juices Market report?
While the report offers comprehensive insights, it's advisable to review the specific contents or supplementary materials provided to ascertain if additional resources or data are available.
14. How can I stay updated on further developments or reports in the Juices Market?
To stay informed about further developments, trends, and reports in the Juices Market, consider subscribing to industry newsletters, following relevant companies and organizations, or regularly checking reputable industry news sources and publications.
Methodology
Step 1 - Identification of Relevant Samples Size from Population Database


Step 2 - Approaches for Defining Global Market Size (Value, Volume* & Price*)

Note*: In applicable scenarios
Step 3 - Data Sources
Primary Research
- Web Analytics
- Survey Reports
- Research Institute
- Latest Research Reports
- Opinion Leaders
Secondary Research
- Annual Reports
- White Paper
- Latest Press Release
- Industry Association
- Paid Database
- Investor Presentations

Step 4 - Data Triangulation
Involves using different sources of information in order to increase the validity of a study
These sources are likely to be stakeholders in a program - participants, other researchers, program staff, other community members, and so on.
Then we put all data in single framework & apply various statistical tools to find out the dynamic on the market.
During the analysis stage, feedback from the stakeholder groups would be compared to determine areas of agreement as well as areas of divergence