


Key Insights
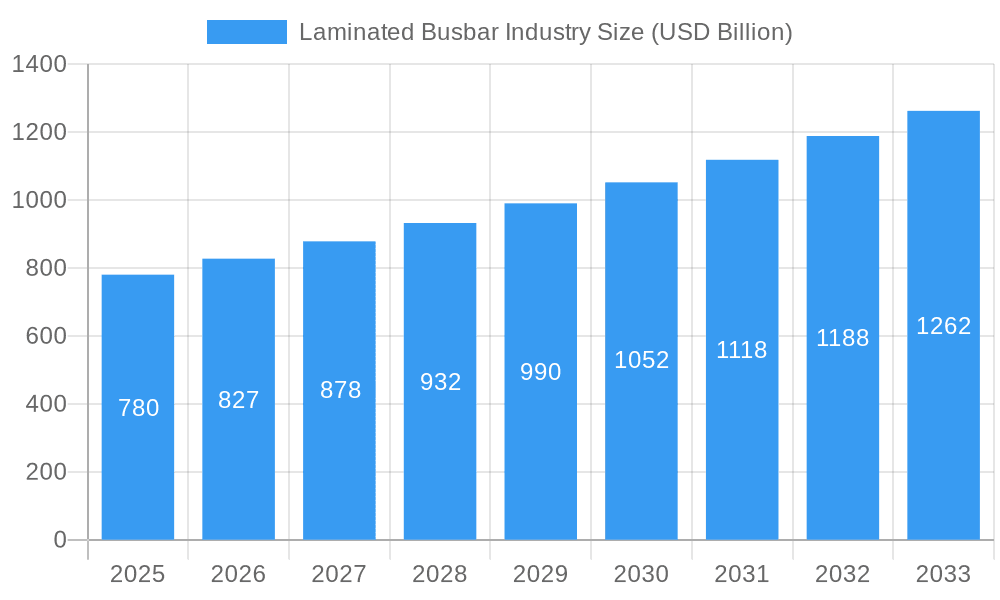
The laminated busbar market, valued at $0.78 billion in 2025, is projected to experience robust growth, driven by the increasing demand for efficient power distribution and rising adoption across diverse sectors. The Compound Annual Growth Rate (CAGR) of 6.02% from 2025 to 2033 indicates a significant expansion, fueled by several key factors. The expanding power utility sector, particularly in developing economies experiencing rapid infrastructure development, is a major contributor. Furthermore, the growing adoption of renewable energy sources, requiring efficient power management solutions, is bolstering market growth. Advancements in materials science, leading to the development of higher-performing and more durable laminated busbars, are also contributing to this positive trajectory. The increasing demand for miniaturization and improved thermal management in electronics and electric vehicles is further driving market expansion. Segmentation by material (aluminum and copper being dominant), insulation material (epoxy powder coating and polyvinyl fluoride film leading the way), and end-user (power utilities and industrial sectors holding significant market share) offers a detailed view of the market landscape, revealing diverse growth opportunities. Competitive landscape analysis reveals a mix of established players and emerging companies vying for market dominance, indicating potential for mergers, acquisitions, and innovative product development.
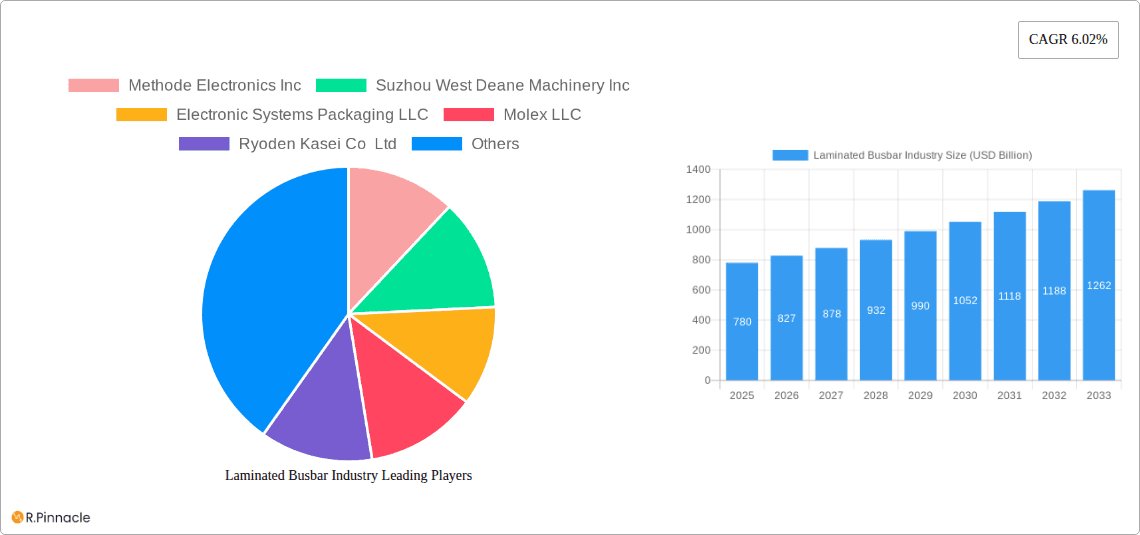
Laminated Busbar Industry Market Size (In Million)

Despite positive growth projections, the laminated busbar market faces certain challenges. Fluctuations in raw material prices, particularly for metals like copper and aluminum, can impact profitability and pricing strategies. Technological advancements are constant, necessitating continuous innovation to maintain a competitive edge. Furthermore, stringent environmental regulations regarding the disposal of certain insulation materials require careful consideration by manufacturers and could influence material selection. Regional variations in growth rates are also anticipated, with Asia-Pacific and North America expected to lead the market due to robust infrastructure development and increasing industrialization. Despite these restraints, the overall outlook for the laminated busbar market remains optimistic, driven by the fundamental need for reliable and efficient power distribution across a broad spectrum of applications.
Laminated Busbar Industry Company Market Share
Laminated Busbar Industry Report: 2019-2033
This comprehensive report provides an in-depth analysis of the Laminated Busbar industry, offering invaluable insights for industry professionals, investors, and strategic decision-makers. The report covers the period from 2019 to 2033, with a focus on the forecast period of 2025-2033 and a base year of 2025. The global market is projected to reach a value of xx USD Billion by 2033.
Laminated Busbar Industry Market Structure & Innovation Trends
This section analyzes the competitive landscape of the laminated busbar market, examining market concentration, innovation drivers, regulatory frameworks, and key industry activities. We delve into the influence of mergers and acquisitions (M&A) and assess the market share held by major players.
- Market Concentration: The market exhibits a [Describe Market Concentration, e.g., moderately concentrated] structure, with [Number] key players controlling approximately [Percentage]% of the global market share in 2024.
- Innovation Drivers: Technological advancements in materials science (e.g., high-temperature insulation materials), miniaturization demands, and the increasing need for efficient power transmission are primary innovation drivers.
- Regulatory Frameworks: Stringent safety standards and environmental regulations are shaping the industry, driving the adoption of eco-friendly materials and manufacturing processes.
- Product Substitutes: The primary substitutes include traditional busbars and other power transmission technologies; however, the advantages of laminated busbars in terms of efficiency and compactness limit their substitution.
- End-User Demographics: The report segments end-users across Power Utilities, Industrial, Transportation, and Residential & Commercial sectors, analyzing their specific needs and growth potential.
- M&A Activities: The industry has witnessed several significant M&A activities in recent years. For example, [mention specific deals and their impact if available, including deal values].
Laminated Busbar Industry Market Dynamics & Trends
This section explores the key factors driving market growth, technological advancements, evolving consumer preferences, and competitive dynamics impacting the laminated busbar market.
The global laminated busbar market is experiencing substantial growth, driven by factors such as rising demand for electricity across various sectors, advancements in power electronics, and the increasing adoption of renewable energy sources. The market is projected to register a CAGR of xx% during the forecast period (2025-2033). Increased investments in infrastructure projects, particularly in developing economies, are further boosting market growth. Technological innovations, including the development of novel insulation materials and enhanced manufacturing processes, are playing a crucial role in driving market expansion. However, competitive pressures from alternative power transmission solutions and fluctuations in raw material prices pose challenges. Market penetration is expected to increase by xx% by 2033.
Dominant Regions & Segments in Laminated Busbar Industry
This section identifies the leading geographical regions and market segments within the laminated busbar industry, providing a detailed analysis of their dominance and growth potential.
Dominant Regions: [Identify the dominant region and its market share. Explain reasons behind the dominance, e.g., strong industrial base, government support, etc.]
Dominant Segments:
- Insulation Material: Epoxy Powder Coating holds the largest market share due to its cost-effectiveness and excellent insulation properties.
- End-User: The Power Utilities segment dominates due to the substantial need for efficient power transmission and distribution.
- Material: Copper currently holds a larger market share compared to Aluminum; however, Aluminum is expected to see significant growth due to its cost advantage.
Key Drivers (Bullet Points):
- Favorable government policies promoting renewable energy adoption.
- Significant investments in infrastructure development.
- Growing urbanization and industrialization.
- Technological advancements in manufacturing processes.
Laminated Busbar Industry Product Innovations
The laminated busbar industry is witnessing continuous product innovations focused on enhancing efficiency, compactness, and reliability. Recent advancements include the integration of smart sensors for real-time monitoring and the development of novel insulation materials with improved thermal and electrical properties. These innovations cater to the rising demand for sophisticated and efficient power transmission solutions in diverse applications.
Report Scope & Segmentation Analysis
This report offers comprehensive segmentation analysis based on Insulation Material (Epoxy Powder Coating, Polyvinyl Fluoride Film, Polyester, Heat-Resistant Fiber, Other Insulation Materials), End-User (Power Utilities, Industrial, Transportation, Residential and Commercial), and Material (Aluminum, Copper). Each segment's growth projections, market size, and competitive dynamics are extensively analyzed.
Key Drivers of Laminated Busbar Industry Growth
Several key factors are driving the growth of the laminated busbar industry:
- Rising global energy demand, particularly in emerging economies.
- The increasing adoption of renewable energy sources and smart grids.
- Stringent regulations mandating efficient power transmission technologies.
Challenges in the Laminated Busbar Industry Sector
The laminated busbar industry faces several challenges:
- Fluctuations in raw material prices (e.g., copper and aluminum).
- Intense competition from established players and new entrants.
- Stringent environmental regulations impacting manufacturing processes.
Emerging Opportunities in Laminated Busbar Industry
Several emerging opportunities exist within the laminated busbar industry:
- Growing demand for miniaturized and lightweight components in electronics.
- Expanding applications in electric vehicles and renewable energy systems.
- Development of innovative insulation materials with enhanced performance characteristics.
Leading Players in the Laminated Busbar Industry Market
- Methode Electronics Inc
- Suzhou West Deane Machinery Inc
- Electronic Systems Packaging LLC
- Molex LLC
- Ryoden Kasei Co Ltd
- Rogers Corporation
- Shanghai Eagtop Electronic Technology Co Ltd
- Eaton Corporation PLC
- Amphenol Corporation
- Segue Electronics Inc
- Zhejiang RHI Electric Co Ltd
- Mersen SA
- Zhuzhou CRRC Times Electric Co Ltd
- Sun King Power Electronics Group Ltd
- Raychem RPG Private Limited
- EMS Industrial & Service Company
- Storm Power Components
Key Developments in Laminated Busbar Industry
- February 2020: ABB Ltd. announced plans to introduce laminated bus plate technology for low-voltage switchgear.
- March 2020: BRAR announced the successful completion of factory cold tests of busbars and Aluminium Power Conducting Arms for SMS Group.
Future Outlook for Laminated Busbar Industry Market
The laminated busbar market is poised for significant growth in the coming years, driven by the continued expansion of renewable energy infrastructure, increasing industrial automation, and the rising demand for efficient power transmission in various sectors. Strategic partnerships, technological innovations, and expansion into new geographical markets will be key to success in this dynamic industry.
Laminated Busbar Industry Segmentation
-
1. Material
- 1.1. Aluminum
- 1.2. Copper
-
2. Insulation Material
- 2.1. Epoxy Powder Coating
- 2.2. Polyvinyl Fluoride Film
- 2.3. Polyester
- 2.4. Heat-Resistant Fiber
- 2.5. Other Insulation Materials
-
3. End-User
- 3.1. Power Utilities
- 3.2. Industrial
- 3.3. Transportation
- 3.4. Residential and Commercial
Laminated Busbar Industry Segmentation By Geography
- 1. North America
- 2. Europe
- 3. Asia Pacific
- 4. South America
- 5. Middle East
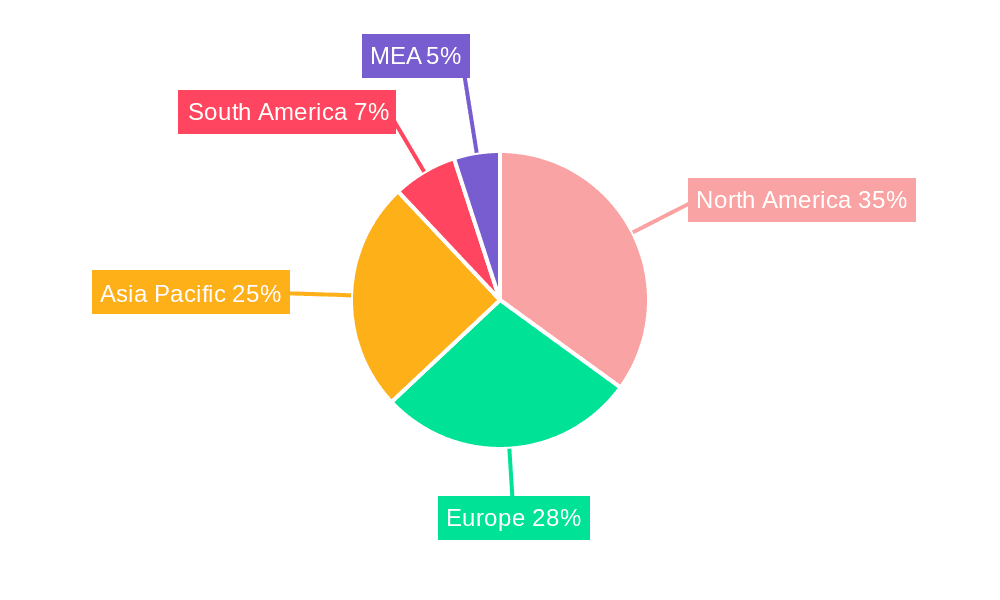
Laminated Busbar Industry Regional Market Share
Geographic Coverage of Laminated Busbar Industry
Laminated Busbar Industry REPORT HIGHLIGHTS
| Aspects | Details |
|---|---|
| Study Period | 2020-2034 |
| Base Year | 2025 |
| Estimated Year | 2026 |
| Forecast Period | 2026-2034 |
| Historical Period | 2020-2025 |
| Growth Rate | CAGR of 6.02% from 2020-2034 |
| Segmentation |
|
Table of Contents
- 1. Introduction
- 1.1. Research Scope
- 1.2. Market Segmentation
- 1.3. Research Methodology
- 1.4. Definitions and Assumptions
- 2. Executive Summary
- 2.1. Introduction
- 3. Market Dynamics
- 3.1. Introduction
- 3.2. Market Drivers
- 3.2.1. 4.; Growing Energy Demand4.; Renewable Energy Transition
- 3.3. Market Restrains
- 3.3.1. 4.; Phasing out of Conventional Sources of Electricity
- 3.4. Market Trends
- 3.4.1. Power Utility Sub-sector to Dominate the Market
- 4. Market Factor Analysis
- 4.1. Porters Five Forces
- 4.2. Supply/Value Chain
- 4.3. PESTEL analysis
- 4.4. Market Entropy
- 4.5. Patent/Trademark Analysis
- 5. Global Laminated Busbar Industry Analysis, Insights and Forecast, 2020-2032
- 5.1. Market Analysis, Insights and Forecast - by Material
- 5.1.1. Aluminum
- 5.1.2. Copper
- 5.2. Market Analysis, Insights and Forecast - by Insulation Material
- 5.2.1. Epoxy Powder Coating
- 5.2.2. Polyvinyl Fluoride Film
- 5.2.3. Polyester
- 5.2.4. Heat-Resistant Fiber
- 5.2.5. Other Insulation Materials
- 5.3. Market Analysis, Insights and Forecast - by End-User
- 5.3.1. Power Utilities
- 5.3.2. Industrial
- 5.3.3. Transportation
- 5.3.4. Residential and Commercial
- 5.4. Market Analysis, Insights and Forecast - by Region
- 5.4.1. North America
- 5.4.2. Europe
- 5.4.3. Asia Pacific
- 5.4.4. South America
- 5.4.5. Middle East
- 5.1. Market Analysis, Insights and Forecast - by Material
- 6. North America Laminated Busbar Industry Analysis, Insights and Forecast, 2020-2032
- 6.1. Market Analysis, Insights and Forecast - by Material
- 6.1.1. Aluminum
- 6.1.2. Copper
- 6.2. Market Analysis, Insights and Forecast - by Insulation Material
- 6.2.1. Epoxy Powder Coating
- 6.2.2. Polyvinyl Fluoride Film
- 6.2.3. Polyester
- 6.2.4. Heat-Resistant Fiber
- 6.2.5. Other Insulation Materials
- 6.3. Market Analysis, Insights and Forecast - by End-User
- 6.3.1. Power Utilities
- 6.3.2. Industrial
- 6.3.3. Transportation
- 6.3.4. Residential and Commercial
- 6.1. Market Analysis, Insights and Forecast - by Material
- 7. Europe Laminated Busbar Industry Analysis, Insights and Forecast, 2020-2032
- 7.1. Market Analysis, Insights and Forecast - by Material
- 7.1.1. Aluminum
- 7.1.2. Copper
- 7.2. Market Analysis, Insights and Forecast - by Insulation Material
- 7.2.1. Epoxy Powder Coating
- 7.2.2. Polyvinyl Fluoride Film
- 7.2.3. Polyester
- 7.2.4. Heat-Resistant Fiber
- 7.2.5. Other Insulation Materials
- 7.3. Market Analysis, Insights and Forecast - by End-User
- 7.3.1. Power Utilities
- 7.3.2. Industrial
- 7.3.3. Transportation
- 7.3.4. Residential and Commercial
- 7.1. Market Analysis, Insights and Forecast - by Material
- 8. Asia Pacific Laminated Busbar Industry Analysis, Insights and Forecast, 2020-2032
- 8.1. Market Analysis, Insights and Forecast - by Material
- 8.1.1. Aluminum
- 8.1.2. Copper
- 8.2. Market Analysis, Insights and Forecast - by Insulation Material
- 8.2.1. Epoxy Powder Coating
- 8.2.2. Polyvinyl Fluoride Film
- 8.2.3. Polyester
- 8.2.4. Heat-Resistant Fiber
- 8.2.5. Other Insulation Materials
- 8.3. Market Analysis, Insights and Forecast - by End-User
- 8.3.1. Power Utilities
- 8.3.2. Industrial
- 8.3.3. Transportation
- 8.3.4. Residential and Commercial
- 8.1. Market Analysis, Insights and Forecast - by Material
- 9. South America Laminated Busbar Industry Analysis, Insights and Forecast, 2020-2032
- 9.1. Market Analysis, Insights and Forecast - by Material
- 9.1.1. Aluminum
- 9.1.2. Copper
- 9.2. Market Analysis, Insights and Forecast - by Insulation Material
- 9.2.1. Epoxy Powder Coating
- 9.2.2. Polyvinyl Fluoride Film
- 9.2.3. Polyester
- 9.2.4. Heat-Resistant Fiber
- 9.2.5. Other Insulation Materials
- 9.3. Market Analysis, Insights and Forecast - by End-User
- 9.3.1. Power Utilities
- 9.3.2. Industrial
- 9.3.3. Transportation
- 9.3.4. Residential and Commercial
- 9.1. Market Analysis, Insights and Forecast - by Material
- 10. Middle East Laminated Busbar Industry Analysis, Insights and Forecast, 2020-2032
- 10.1. Market Analysis, Insights and Forecast - by Material
- 10.1.1. Aluminum
- 10.1.2. Copper
- 10.2. Market Analysis, Insights and Forecast - by Insulation Material
- 10.2.1. Epoxy Powder Coating
- 10.2.2. Polyvinyl Fluoride Film
- 10.2.3. Polyester
- 10.2.4. Heat-Resistant Fiber
- 10.2.5. Other Insulation Materials
- 10.3. Market Analysis, Insights and Forecast - by End-User
- 10.3.1. Power Utilities
- 10.3.2. Industrial
- 10.3.3. Transportation
- 10.3.4. Residential and Commercial
- 10.1. Market Analysis, Insights and Forecast - by Material
- 11. Competitive Analysis
- 11.1. Global Market Share Analysis 2025
- 11.2. Company Profiles
- 11.2.1 Methode Electronics Inc
- 11.2.1.1. Overview
- 11.2.1.2. Products
- 11.2.1.3. SWOT Analysis
- 11.2.1.4. Recent Developments
- 11.2.1.5. Financials (Based on Availability)
- 11.2.2 Suzhou West Deane Machinery Inc
- 11.2.2.1. Overview
- 11.2.2.2. Products
- 11.2.2.3. SWOT Analysis
- 11.2.2.4. Recent Developments
- 11.2.2.5. Financials (Based on Availability)
- 11.2.3 Electronic Systems Packaging LLC
- 11.2.3.1. Overview
- 11.2.3.2. Products
- 11.2.3.3. SWOT Analysis
- 11.2.3.4. Recent Developments
- 11.2.3.5. Financials (Based on Availability)
- 11.2.4 Molex LLC
- 11.2.4.1. Overview
- 11.2.4.2. Products
- 11.2.4.3. SWOT Analysis
- 11.2.4.4. Recent Developments
- 11.2.4.5. Financials (Based on Availability)
- 11.2.5 Ryoden Kasei Co Ltd
- 11.2.5.1. Overview
- 11.2.5.2. Products
- 11.2.5.3. SWOT Analysis
- 11.2.5.4. Recent Developments
- 11.2.5.5. Financials (Based on Availability)
- 11.2.6 Rogers Corporation
- 11.2.6.1. Overview
- 11.2.6.2. Products
- 11.2.6.3. SWOT Analysis
- 11.2.6.4. Recent Developments
- 11.2.6.5. Financials (Based on Availability)
- 11.2.7 Shanghai Eagtop Electronic Technology Co Ltd
- 11.2.7.1. Overview
- 11.2.7.2. Products
- 11.2.7.3. SWOT Analysis
- 11.2.7.4. Recent Developments
- 11.2.7.5. Financials (Based on Availability)
- 11.2.8 Eaton Corporation PLC
- 11.2.8.1. Overview
- 11.2.8.2. Products
- 11.2.8.3. SWOT Analysis
- 11.2.8.4. Recent Developments
- 11.2.8.5. Financials (Based on Availability)
- 11.2.9 Amphenol Corporation
- 11.2.9.1. Overview
- 11.2.9.2. Products
- 11.2.9.3. SWOT Analysis
- 11.2.9.4. Recent Developments
- 11.2.9.5. Financials (Based on Availability)
- 11.2.10 Segue Electronics Inc *List Not Exhaustive
- 11.2.10.1. Overview
- 11.2.10.2. Products
- 11.2.10.3. SWOT Analysis
- 11.2.10.4. Recent Developments
- 11.2.10.5. Financials (Based on Availability)
- 11.2.11 Zhejiang RHI ELectric Co Ltd
- 11.2.11.1. Overview
- 11.2.11.2. Products
- 11.2.11.3. SWOT Analysis
- 11.2.11.4. Recent Developments
- 11.2.11.5. Financials (Based on Availability)
- 11.2.12 Mersen SA
- 11.2.12.1. Overview
- 11.2.12.2. Products
- 11.2.12.3. SWOT Analysis
- 11.2.12.4. Recent Developments
- 11.2.12.5. Financials (Based on Availability)
- 11.2.13 Zhuzhou CRRC Times Electric Co Ltd
- 11.2.13.1. Overview
- 11.2.13.2. Products
- 11.2.13.3. SWOT Analysis
- 11.2.13.4. Recent Developments
- 11.2.13.5. Financials (Based on Availability)
- 11.2.14 Sun King Power Electronics Group Ltd
- 11.2.14.1. Overview
- 11.2.14.2. Products
- 11.2.14.3. SWOT Analysis
- 11.2.14.4. Recent Developments
- 11.2.14.5. Financials (Based on Availability)
- 11.2.15 Raychem RPG Private Limited
- 11.2.15.1. Overview
- 11.2.15.2. Products
- 11.2.15.3. SWOT Analysis
- 11.2.15.4. Recent Developments
- 11.2.15.5. Financials (Based on Availability)
- 11.2.16 EMS Industrial & Service Company
- 11.2.16.1. Overview
- 11.2.16.2. Products
- 11.2.16.3. SWOT Analysis
- 11.2.16.4. Recent Developments
- 11.2.16.5. Financials (Based on Availability)
- 11.2.17 Storm Power Components
- 11.2.17.1. Overview
- 11.2.17.2. Products
- 11.2.17.3. SWOT Analysis
- 11.2.17.4. Recent Developments
- 11.2.17.5. Financials (Based on Availability)
- 11.2.1 Methode Electronics Inc
List of Figures
- Figure 1: Global Laminated Busbar Industry Revenue Breakdown (USD Billion, %) by Region 2025 & 2033
- Figure 2: Global Laminated Busbar Industry Volume Breakdown (K Units, %) by Region 2025 & 2033
- Figure 3: North America Laminated Busbar Industry Revenue (USD Billion), by Material 2025 & 2033
- Figure 4: North America Laminated Busbar Industry Volume (K Units), by Material 2025 & 2033
- Figure 5: North America Laminated Busbar Industry Revenue Share (%), by Material 2025 & 2033
- Figure 6: North America Laminated Busbar Industry Volume Share (%), by Material 2025 & 2033
- Figure 7: North America Laminated Busbar Industry Revenue (USD Billion), by Insulation Material 2025 & 2033
- Figure 8: North America Laminated Busbar Industry Volume (K Units), by Insulation Material 2025 & 2033
- Figure 9: North America Laminated Busbar Industry Revenue Share (%), by Insulation Material 2025 & 2033
- Figure 10: North America Laminated Busbar Industry Volume Share (%), by Insulation Material 2025 & 2033
- Figure 11: North America Laminated Busbar Industry Revenue (USD Billion), by End-User 2025 & 2033
- Figure 12: North America Laminated Busbar Industry Volume (K Units), by End-User 2025 & 2033
- Figure 13: North America Laminated Busbar Industry Revenue Share (%), by End-User 2025 & 2033
- Figure 14: North America Laminated Busbar Industry Volume Share (%), by End-User 2025 & 2033
- Figure 15: North America Laminated Busbar Industry Revenue (USD Billion), by Country 2025 & 2033
- Figure 16: North America Laminated Busbar Industry Volume (K Units), by Country 2025 & 2033
- Figure 17: North America Laminated Busbar Industry Revenue Share (%), by Country 2025 & 2033
- Figure 18: North America Laminated Busbar Industry Volume Share (%), by Country 2025 & 2033
- Figure 19: Europe Laminated Busbar Industry Revenue (USD Billion), by Material 2025 & 2033
- Figure 20: Europe Laminated Busbar Industry Volume (K Units), by Material 2025 & 2033
- Figure 21: Europe Laminated Busbar Industry Revenue Share (%), by Material 2025 & 2033
- Figure 22: Europe Laminated Busbar Industry Volume Share (%), by Material 2025 & 2033
- Figure 23: Europe Laminated Busbar Industry Revenue (USD Billion), by Insulation Material 2025 & 2033
- Figure 24: Europe Laminated Busbar Industry Volume (K Units), by Insulation Material 2025 & 2033
- Figure 25: Europe Laminated Busbar Industry Revenue Share (%), by Insulation Material 2025 & 2033
- Figure 26: Europe Laminated Busbar Industry Volume Share (%), by Insulation Material 2025 & 2033
- Figure 27: Europe Laminated Busbar Industry Revenue (USD Billion), by End-User 2025 & 2033
- Figure 28: Europe Laminated Busbar Industry Volume (K Units), by End-User 2025 & 2033
- Figure 29: Europe Laminated Busbar Industry Revenue Share (%), by End-User 2025 & 2033
- Figure 30: Europe Laminated Busbar Industry Volume Share (%), by End-User 2025 & 2033
- Figure 31: Europe Laminated Busbar Industry Revenue (USD Billion), by Country 2025 & 2033
- Figure 32: Europe Laminated Busbar Industry Volume (K Units), by Country 2025 & 2033
- Figure 33: Europe Laminated Busbar Industry Revenue Share (%), by Country 2025 & 2033
- Figure 34: Europe Laminated Busbar Industry Volume Share (%), by Country 2025 & 2033
- Figure 35: Asia Pacific Laminated Busbar Industry Revenue (USD Billion), by Material 2025 & 2033
- Figure 36: Asia Pacific Laminated Busbar Industry Volume (K Units), by Material 2025 & 2033
- Figure 37: Asia Pacific Laminated Busbar Industry Revenue Share (%), by Material 2025 & 2033
- Figure 38: Asia Pacific Laminated Busbar Industry Volume Share (%), by Material 2025 & 2033
- Figure 39: Asia Pacific Laminated Busbar Industry Revenue (USD Billion), by Insulation Material 2025 & 2033
- Figure 40: Asia Pacific Laminated Busbar Industry Volume (K Units), by Insulation Material 2025 & 2033
- Figure 41: Asia Pacific Laminated Busbar Industry Revenue Share (%), by Insulation Material 2025 & 2033
- Figure 42: Asia Pacific Laminated Busbar Industry Volume Share (%), by Insulation Material 2025 & 2033
- Figure 43: Asia Pacific Laminated Busbar Industry Revenue (USD Billion), by End-User 2025 & 2033
- Figure 44: Asia Pacific Laminated Busbar Industry Volume (K Units), by End-User 2025 & 2033
- Figure 45: Asia Pacific Laminated Busbar Industry Revenue Share (%), by End-User 2025 & 2033
- Figure 46: Asia Pacific Laminated Busbar Industry Volume Share (%), by End-User 2025 & 2033
- Figure 47: Asia Pacific Laminated Busbar Industry Revenue (USD Billion), by Country 2025 & 2033
- Figure 48: Asia Pacific Laminated Busbar Industry Volume (K Units), by Country 2025 & 2033
- Figure 49: Asia Pacific Laminated Busbar Industry Revenue Share (%), by Country 2025 & 2033
- Figure 50: Asia Pacific Laminated Busbar Industry Volume Share (%), by Country 2025 & 2033
- Figure 51: South America Laminated Busbar Industry Revenue (USD Billion), by Material 2025 & 2033
- Figure 52: South America Laminated Busbar Industry Volume (K Units), by Material 2025 & 2033
- Figure 53: South America Laminated Busbar Industry Revenue Share (%), by Material 2025 & 2033
- Figure 54: South America Laminated Busbar Industry Volume Share (%), by Material 2025 & 2033
- Figure 55: South America Laminated Busbar Industry Revenue (USD Billion), by Insulation Material 2025 & 2033
- Figure 56: South America Laminated Busbar Industry Volume (K Units), by Insulation Material 2025 & 2033
- Figure 57: South America Laminated Busbar Industry Revenue Share (%), by Insulation Material 2025 & 2033
- Figure 58: South America Laminated Busbar Industry Volume Share (%), by Insulation Material 2025 & 2033
- Figure 59: South America Laminated Busbar Industry Revenue (USD Billion), by End-User 2025 & 2033
- Figure 60: South America Laminated Busbar Industry Volume (K Units), by End-User 2025 & 2033
- Figure 61: South America Laminated Busbar Industry Revenue Share (%), by End-User 2025 & 2033
- Figure 62: South America Laminated Busbar Industry Volume Share (%), by End-User 2025 & 2033
- Figure 63: South America Laminated Busbar Industry Revenue (USD Billion), by Country 2025 & 2033
- Figure 64: South America Laminated Busbar Industry Volume (K Units), by Country 2025 & 2033
- Figure 65: South America Laminated Busbar Industry Revenue Share (%), by Country 2025 & 2033
- Figure 66: South America Laminated Busbar Industry Volume Share (%), by Country 2025 & 2033
- Figure 67: Middle East Laminated Busbar Industry Revenue (USD Billion), by Material 2025 & 2033
- Figure 68: Middle East Laminated Busbar Industry Volume (K Units), by Material 2025 & 2033
- Figure 69: Middle East Laminated Busbar Industry Revenue Share (%), by Material 2025 & 2033
- Figure 70: Middle East Laminated Busbar Industry Volume Share (%), by Material 2025 & 2033
- Figure 71: Middle East Laminated Busbar Industry Revenue (USD Billion), by Insulation Material 2025 & 2033
- Figure 72: Middle East Laminated Busbar Industry Volume (K Units), by Insulation Material 2025 & 2033
- Figure 73: Middle East Laminated Busbar Industry Revenue Share (%), by Insulation Material 2025 & 2033
- Figure 74: Middle East Laminated Busbar Industry Volume Share (%), by Insulation Material 2025 & 2033
- Figure 75: Middle East Laminated Busbar Industry Revenue (USD Billion), by End-User 2025 & 2033
- Figure 76: Middle East Laminated Busbar Industry Volume (K Units), by End-User 2025 & 2033
- Figure 77: Middle East Laminated Busbar Industry Revenue Share (%), by End-User 2025 & 2033
- Figure 78: Middle East Laminated Busbar Industry Volume Share (%), by End-User 2025 & 2033
- Figure 79: Middle East Laminated Busbar Industry Revenue (USD Billion), by Country 2025 & 2033
- Figure 80: Middle East Laminated Busbar Industry Volume (K Units), by Country 2025 & 2033
- Figure 81: Middle East Laminated Busbar Industry Revenue Share (%), by Country 2025 & 2033
- Figure 82: Middle East Laminated Busbar Industry Volume Share (%), by Country 2025 & 2033
List of Tables
- Table 1: Global Laminated Busbar Industry Revenue USD Billion Forecast, by Material 2020 & 2033
- Table 2: Global Laminated Busbar Industry Volume K Units Forecast, by Material 2020 & 2033
- Table 3: Global Laminated Busbar Industry Revenue USD Billion Forecast, by Insulation Material 2020 & 2033
- Table 4: Global Laminated Busbar Industry Volume K Units Forecast, by Insulation Material 2020 & 2033
- Table 5: Global Laminated Busbar Industry Revenue USD Billion Forecast, by End-User 2020 & 2033
- Table 6: Global Laminated Busbar Industry Volume K Units Forecast, by End-User 2020 & 2033
- Table 7: Global Laminated Busbar Industry Revenue USD Billion Forecast, by Region 2020 & 2033
- Table 8: Global Laminated Busbar Industry Volume K Units Forecast, by Region 2020 & 2033
- Table 9: Global Laminated Busbar Industry Revenue USD Billion Forecast, by Material 2020 & 2033
- Table 10: Global Laminated Busbar Industry Volume K Units Forecast, by Material 2020 & 2033
- Table 11: Global Laminated Busbar Industry Revenue USD Billion Forecast, by Insulation Material 2020 & 2033
- Table 12: Global Laminated Busbar Industry Volume K Units Forecast, by Insulation Material 2020 & 2033
- Table 13: Global Laminated Busbar Industry Revenue USD Billion Forecast, by End-User 2020 & 2033
- Table 14: Global Laminated Busbar Industry Volume K Units Forecast, by End-User 2020 & 2033
- Table 15: Global Laminated Busbar Industry Revenue USD Billion Forecast, by Country 2020 & 2033
- Table 16: Global Laminated Busbar Industry Volume K Units Forecast, by Country 2020 & 2033
- Table 17: Global Laminated Busbar Industry Revenue USD Billion Forecast, by Material 2020 & 2033
- Table 18: Global Laminated Busbar Industry Volume K Units Forecast, by Material 2020 & 2033
- Table 19: Global Laminated Busbar Industry Revenue USD Billion Forecast, by Insulation Material 2020 & 2033
- Table 20: Global Laminated Busbar Industry Volume K Units Forecast, by Insulation Material 2020 & 2033
- Table 21: Global Laminated Busbar Industry Revenue USD Billion Forecast, by End-User 2020 & 2033
- Table 22: Global Laminated Busbar Industry Volume K Units Forecast, by End-User 2020 & 2033
- Table 23: Global Laminated Busbar Industry Revenue USD Billion Forecast, by Country 2020 & 2033
- Table 24: Global Laminated Busbar Industry Volume K Units Forecast, by Country 2020 & 2033
- Table 25: Global Laminated Busbar Industry Revenue USD Billion Forecast, by Material 2020 & 2033
- Table 26: Global Laminated Busbar Industry Volume K Units Forecast, by Material 2020 & 2033
- Table 27: Global Laminated Busbar Industry Revenue USD Billion Forecast, by Insulation Material 2020 & 2033
- Table 28: Global Laminated Busbar Industry Volume K Units Forecast, by Insulation Material 2020 & 2033
- Table 29: Global Laminated Busbar Industry Revenue USD Billion Forecast, by End-User 2020 & 2033
- Table 30: Global Laminated Busbar Industry Volume K Units Forecast, by End-User 2020 & 2033
- Table 31: Global Laminated Busbar Industry Revenue USD Billion Forecast, by Country 2020 & 2033
- Table 32: Global Laminated Busbar Industry Volume K Units Forecast, by Country 2020 & 2033
- Table 33: Global Laminated Busbar Industry Revenue USD Billion Forecast, by Material 2020 & 2033
- Table 34: Global Laminated Busbar Industry Volume K Units Forecast, by Material 2020 & 2033
- Table 35: Global Laminated Busbar Industry Revenue USD Billion Forecast, by Insulation Material 2020 & 2033
- Table 36: Global Laminated Busbar Industry Volume K Units Forecast, by Insulation Material 2020 & 2033
- Table 37: Global Laminated Busbar Industry Revenue USD Billion Forecast, by End-User 2020 & 2033
- Table 38: Global Laminated Busbar Industry Volume K Units Forecast, by End-User 2020 & 2033
- Table 39: Global Laminated Busbar Industry Revenue USD Billion Forecast, by Country 2020 & 2033
- Table 40: Global Laminated Busbar Industry Volume K Units Forecast, by Country 2020 & 2033
- Table 41: Global Laminated Busbar Industry Revenue USD Billion Forecast, by Material 2020 & 2033
- Table 42: Global Laminated Busbar Industry Volume K Units Forecast, by Material 2020 & 2033
- Table 43: Global Laminated Busbar Industry Revenue USD Billion Forecast, by Insulation Material 2020 & 2033
- Table 44: Global Laminated Busbar Industry Volume K Units Forecast, by Insulation Material 2020 & 2033
- Table 45: Global Laminated Busbar Industry Revenue USD Billion Forecast, by End-User 2020 & 2033
- Table 46: Global Laminated Busbar Industry Volume K Units Forecast, by End-User 2020 & 2033
- Table 47: Global Laminated Busbar Industry Revenue USD Billion Forecast, by Country 2020 & 2033
- Table 48: Global Laminated Busbar Industry Volume K Units Forecast, by Country 2020 & 2033
Frequently Asked Questions
1. What is the projected Compound Annual Growth Rate (CAGR) of the Laminated Busbar Industry?
The projected CAGR is approximately 6.02%.
2. Which companies are prominent players in the Laminated Busbar Industry?
Key companies in the market include Methode Electronics Inc, Suzhou West Deane Machinery Inc, Electronic Systems Packaging LLC, Molex LLC, Ryoden Kasei Co Ltd, Rogers Corporation, Shanghai Eagtop Electronic Technology Co Ltd, Eaton Corporation PLC, Amphenol Corporation, Segue Electronics Inc *List Not Exhaustive, Zhejiang RHI ELectric Co Ltd, Mersen SA, Zhuzhou CRRC Times Electric Co Ltd, Sun King Power Electronics Group Ltd, Raychem RPG Private Limited, EMS Industrial & Service Company, Storm Power Components.
3. What are the main segments of the Laminated Busbar Industry?
The market segments include Material, Insulation Material, End-User.
4. Can you provide details about the market size?
The market size is estimated to be USD 0.78 USD Billion as of 2022.
5. What are some drivers contributing to market growth?
4.; Growing Energy Demand4.; Renewable Energy Transition.
6. What are the notable trends driving market growth?
Power Utility Sub-sector to Dominate the Market.
7. Are there any restraints impacting market growth?
4.; Phasing out of Conventional Sources of Electricity.
8. Can you provide examples of recent developments in the market?
In February 2020, ABB Ltd planned to introduce laminated bus plate technology for low-voltage switchgear. The new technology is combined with the ABB Ability platform, and it offers the highest reliability, better efficiency, maximum safety, more flexibility, and measurable return on investment (ROI).
9. What pricing options are available for accessing the report?
Pricing options include single-user, multi-user, and enterprise licenses priced at USD 4750, USD 5250, and USD 8750 respectively.
10. Is the market size provided in terms of value or volume?
The market size is provided in terms of value, measured in USD Billion and volume, measured in K Units.
11. Are there any specific market keywords associated with the report?
Yes, the market keyword associated with the report is "Laminated Busbar Industry," which aids in identifying and referencing the specific market segment covered.
12. How do I determine which pricing option suits my needs best?
The pricing options vary based on user requirements and access needs. Individual users may opt for single-user licenses, while businesses requiring broader access may choose multi-user or enterprise licenses for cost-effective access to the report.
13. Are there any additional resources or data provided in the Laminated Busbar Industry report?
While the report offers comprehensive insights, it's advisable to review the specific contents or supplementary materials provided to ascertain if additional resources or data are available.
14. How can I stay updated on further developments or reports in the Laminated Busbar Industry?
To stay informed about further developments, trends, and reports in the Laminated Busbar Industry, consider subscribing to industry newsletters, following relevant companies and organizations, or regularly checking reputable industry news sources and publications.
Methodology
Step 1 - Identification of Relevant Samples Size from Population Database


Step 2 - Approaches for Defining Global Market Size (Value, Volume* & Price*)

Note*: In applicable scenarios
Step 3 - Data Sources
Primary Research
- Web Analytics
- Survey Reports
- Research Institute
- Latest Research Reports
- Opinion Leaders
Secondary Research
- Annual Reports
- White Paper
- Latest Press Release
- Industry Association
- Paid Database
- Investor Presentations

Step 4 - Data Triangulation
Involves using different sources of information in order to increase the validity of a study
These sources are likely to be stakeholders in a program - participants, other researchers, program staff, other community members, and so on.
Then we put all data in single framework & apply various statistical tools to find out the dynamic on the market.
During the analysis stage, feedback from the stakeholder groups would be compared to determine areas of agreement as well as areas of divergence