

Key Insights
The Large Volume Parenteral (LVP) market, valued at $12.385 billion in 2025, is projected to grow at a compound annual growth rate (CAGR) of 5.05% from 2025 to 2033. This expansion is fueled by the rising incidence of chronic diseases necessitating long-term intravenous therapies and a growing elderly population. Advances in LVP formulations, improved safety profiles, and enhanced administration methods further stimulate demand. The increasing adoption of home healthcare settings also contributes significantly to market growth. Ongoing research and development in innovative LVP products, including targeted drug delivery systems, are anticipated to drive future market expansion. The 500ml-2000ml+ segment is expected to dominate due to its efficiency in delivering substantial fluid volumes crucial for therapeutic applications.
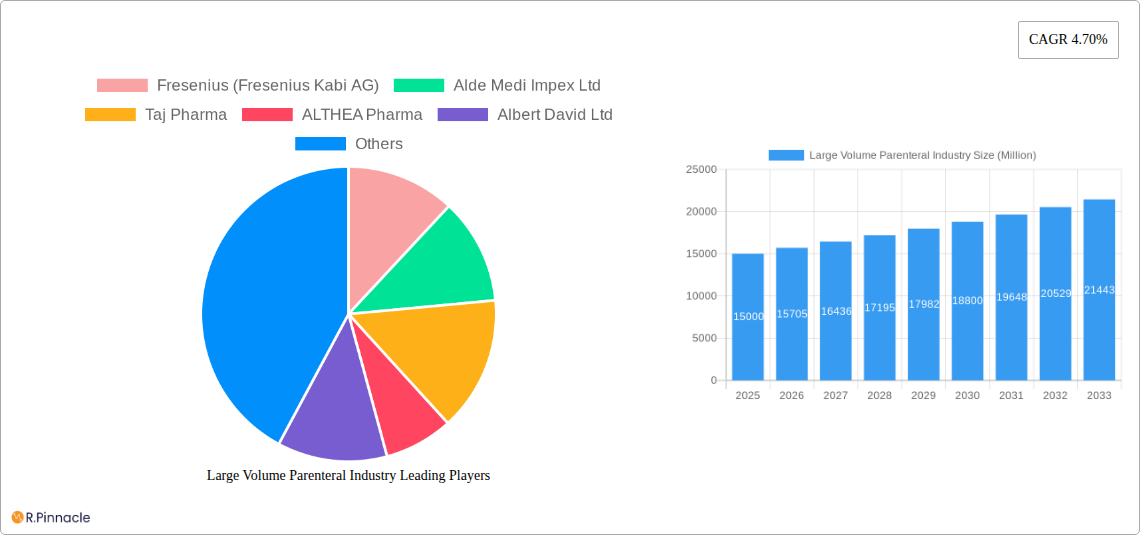
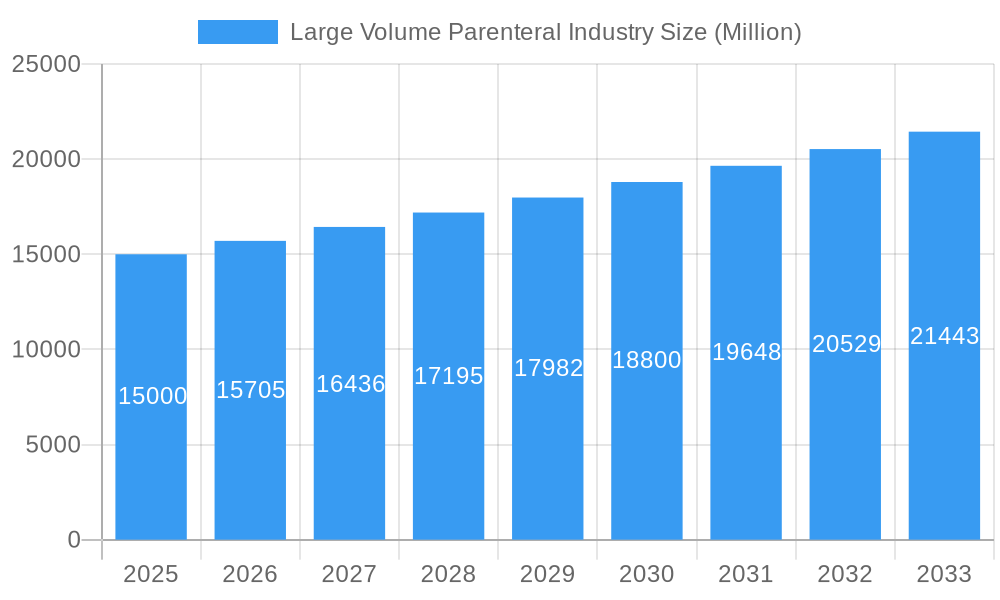
Large Volume Parenteral Industry Market Size (In Billion)
Challenges include stringent regulatory landscapes and complex approval processes, alongside potential risks from raw material price volatility and concerns regarding LVP formulation adverse effects. Intense competition among established and emerging players shapes market dynamics. Geographically, North America and Europe currently lead, supported by high healthcare spending and robust infrastructure. However, the Asia-Pacific region is poised for substantial growth, driven by increasing healthcare awareness, rising disposable incomes, and expanding healthcare facilities. The competitive environment features major multinational corporations and specialized smaller firms, fostering innovation and competition.
Large Volume Parenteral Industry Company Market Share
Large Volume Parenteral Industry Market Analysis: 2019-2033
This comprehensive market report provides an in-depth analysis of the Large Volume Parenteral (LVP) industry, delivering critical insights for stakeholders. The report covers the period 2019-2033, with a detailed forecast for 2025-2033 based on a 2025 base year. It examines market dynamics, key industry participants, emerging trends, and future growth prospects, offering a holistic perspective of this essential sector. The global market is projected to reach $12.385 billion by 2033, with a CAGR of 5.05%.
Large Volume Parenteral Industry Market Structure & Innovation Trends
The LVP market exhibits a moderately concentrated structure, with key players such as Fresenius Kabi AG, Baxter International, B. Braun SE, and Pfizer Inc. holding significant market share. Fresenius Kabi AG, for example, is estimated to hold approximately xx% of the global market share in 2025. The market is driven by continuous innovation in drug delivery systems, packaging materials, and manufacturing processes. Stringent regulatory frameworks, such as those enforced by the FDA and EMA, significantly influence market dynamics. Product substitutes, while limited, include alternative drug delivery methods. The end-user demographic primarily comprises hospitals, clinics, and ambulatory surgical centers. M&A activity is a prominent feature, with several notable deals valued at over xx Million in the last five years.
- Market Concentration: Moderately concentrated, with top players holding xx% market share collectively.
- Innovation Drivers: Advancements in drug delivery, packaging, and manufacturing technologies.
- Regulatory Frameworks: Stringent guidelines from FDA, EMA, and other regulatory bodies.
- Product Substitutes: Limited, primarily alternative drug delivery mechanisms.
- End-User Demographics: Hospitals, clinics, and ambulatory surgical centers.
- M&A Activity: Significant M&A activity in recent years, with deals exceeding xx Million.
Large Volume Parenteral Industry Market Dynamics & Trends
The LVP market is witnessing robust growth, driven by factors such as the increasing prevalence of chronic diseases, the rising demand for parenteral therapies, and the growing geriatric population. Technological advancements in drug delivery systems, such as pre-filled syringes and ready-to-use solutions, are further fueling market expansion. Consumer preference is shifting towards convenient and safe drug administration methods. Competitive dynamics are intense, with companies investing heavily in R&D and strategic partnerships to gain a competitive edge. The market is segmented by volume (100-250ml, 250-500ml, 500-1000ml, 1000-2000ml, and >2000ml), application (therapeutic, fluid balance, and nutritious injections), and packaging (bottles and bags). The global LVP market is projected to reach xx Million by 2033, exhibiting a CAGR of xx%. Market penetration is expected to increase significantly, particularly in emerging economies.
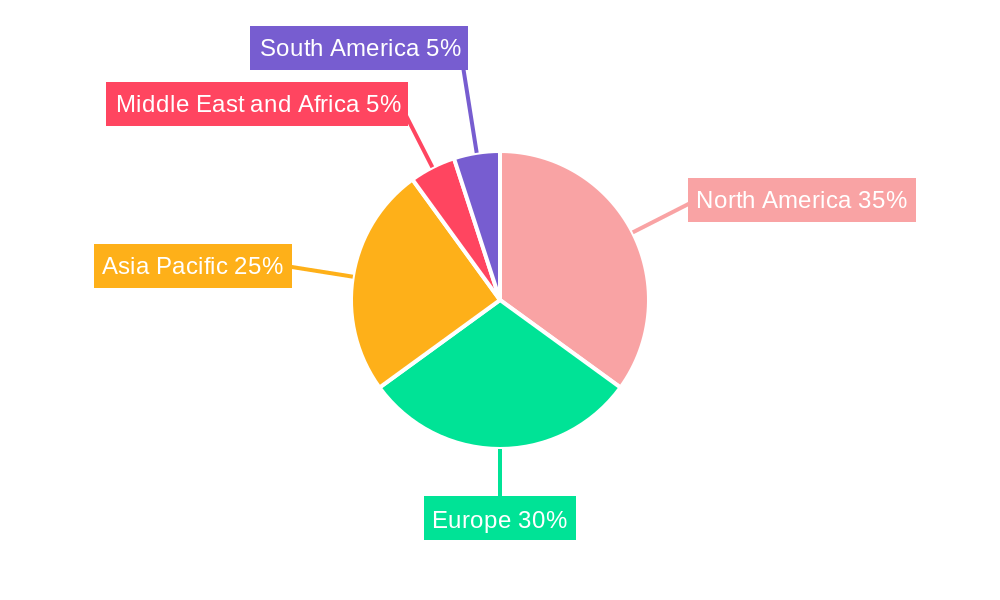
Dominant Regions & Segments in Large Volume Parenteral Industry
North America currently dominates the LVP market, driven by high healthcare expenditure, advanced healthcare infrastructure, and a large patient pool. However, Asia-Pacific is expected to witness significant growth in the coming years, fueled by increasing healthcare spending and rising prevalence of chronic diseases.
- Leading Region: North America
- Key Drivers:
- North America: High healthcare expenditure, advanced infrastructure.
- Asia-Pacific: Rising healthcare spending, growing prevalence of chronic diseases.
- Dominant Segments:
- Volume: 500ml - 1000ml segment holds the largest market share.
- Application: Therapeutic injections dominate due to a wide range of applications.
- Packaging: Bags are more commonly used due to ease of handling and reduced risk of contamination.
Large Volume Parenteral Industry Product Innovations
Recent innovations in the LVP industry focus on improving drug delivery systems, enhancing patient safety, and reducing manufacturing costs. This includes the development of advanced container closure systems, pre-filled syringes, and automated manufacturing processes. These innovations address key market demands for improved patient outcomes and streamlined healthcare operations. Companies are continuously developing new formulations and delivery methods to cater to evolving therapeutic needs and enhance patient compliance.
Report Scope & Segmentation Analysis
This report provides a comprehensive segmentation analysis of the LVP market based on volume, application, and packaging. Each segment's growth projections, market sizes, and competitive dynamics are analyzed in detail. For example, the 500ml-1000ml volume segment is expected to register the highest growth rate during the forecast period, while therapeutic injections constitute the largest application segment. The use of bags is steadily increasing compared to bottles due to safety and handling benefits.
Key Drivers of Large Volume Parenteral Industry Growth
The growth of the LVP industry is propelled by several factors:
- Rising prevalence of chronic diseases requiring parenteral therapies.
- Growing geriatric population necessitating increased injections.
- Technological advancements enhancing delivery systems and manufacturing efficiency.
- Increasing healthcare spending globally, especially in emerging economies.
- Favorable regulatory environment promoting innovation and market entry.
Challenges in the Large Volume Parenteral Industry Sector
The LVP industry faces various challenges:
- Stringent regulatory requirements and lengthy approval processes increase costs and time-to-market.
- Supply chain disruptions and raw material shortages can impact production and availability.
- Intense competition from established players and new entrants exerts pressure on pricing and margins. This competition contributes to approximately xx% of the challenges faced by the industry.
Emerging Opportunities in Large Volume Parenteral Industry
Emerging opportunities in the LVP industry include:
- Growing demand for biosimilars and biologics creating new market segments.
- Expansion into emerging markets with unmet medical needs.
- Development of novel drug delivery systems such as targeted therapies and personalized medicines.
- Adoption of advanced manufacturing technologies to increase efficiency and reduce costs.
Leading Players in the Large Volume Parenteral Industry Market
- Fresenius (Fresenius Kabi AG)
- Alde Medi Impex Ltd
- Taj Pharma
- ALTHEA Pharma
- Albert David Ltd
- Higgs Healthcae
- Grifols S A
- Baxter International
- B Braun SE
- BML Parenteral Drugs
- Pfizer Inc
Key Developments in Large Volume Parenteral Industry Industry
- November 2022: WuXi STA launched a new parenteral formulation manufacturing line in Wuxi, China, significantly increasing production speed.
- June 2022: Akums Drugs & Pharmaceuticals Ltd. received EU GMP approval for large and small-volume parenteral manufacturing units in India.
Future Outlook for Large Volume Parenteral Industry Market
The LVP market is poised for continued growth, driven by ongoing technological advancements, increasing healthcare expenditure, and the expanding prevalence of chronic diseases. Strategic partnerships, acquisitions, and investments in R&D will play crucial roles in shaping the future competitive landscape. The market's focus on improving patient safety, reducing costs, and expanding into new markets will be key determinants of success in the years to come.
Large Volume Parenteral Industry Segmentation
-
1. Volume
- 1.1. 100 ml - 250 ml
- 1.2. 250 ml - 500 ml
- 1.3. 500 ml - 1000 ml
- 1.4. 1000 ml - 2000 ml
- 1.5. 2000 ml and more
-
2. Application
- 2.1. Therapeutic Injections
- 2.2. Fluid Balance Injections
- 2.3. Nutritious Injections
-
3. Type of Packaging
- 3.1. Bottles
- 3.2. Bags
Large Volume Parenteral Industry Segmentation By Geography
-
1. North America
- 1.1. United States
- 1.2. Canada
- 1.3. Mexico
-
2. Europe
- 2.1. Germany
- 2.2. United Kingdom
- 2.3. France
- 2.4. Italy
- 2.5. Spain
- 2.6. Rest of Europe
-
3. Asia Pacific
- 3.1. China
- 3.2. Japan
- 3.3. India
- 3.4. Australia
- 3.5. South Korea
- 3.6. Rest of Asia Pacific
-
4. Middle East and Africa
- 4.1. GCC
- 4.2. South Africa
- 4.3. Rest of Middle East and Africa
-
5. South America
- 5.1. Brazil
- 5.2. Argentina
- 5.3. Rest of South America
Large Volume Parenteral Industry Regional Market Share
Geographic Coverage of Large Volume Parenteral Industry
Large Volume Parenteral Industry REPORT HIGHLIGHTS
| Aspects | Details |
|---|---|
| Study Period | 2020-2034 |
| Base Year | 2025 |
| Estimated Year | 2026 |
| Forecast Period | 2026-2034 |
| Historical Period | 2020-2025 |
| Growth Rate | CAGR of 5.05% from 2020-2034 |
| Segmentation |
|
Table of Contents
- 1. Introduction
- 1.1. Research Scope
- 1.2. Market Segmentation
- 1.3. Research Objective
- 1.4. Definitions and Assumptions
- 2. Executive Summary
- 2.1. Market Snapshot
- 3. Market Dynamics
- 3.1. Market Drivers
- 3.2. Market Restrains
- 3.3. Market Trends
- 3.4. Market Opportunities
- 4. Market Factor Analysis
- 4.1. Porters Five Forces
- 4.1.1. Bargaining Power of Suppliers
- 4.1.2. Bargaining Power of Buyers
- 4.1.3. Threat of New Entrants
- 4.1.4. Threat of Substitutes
- 4.1.5. Competitive Rivalry
- 4.2. PESTEL analysis
- 4.3. BCG Analysis
- 4.3.1. Stars (High Growth, High Market Share)
- 4.3.2. Cash Cows (Low Growth, High Market Share)
- 4.3.3. Question Mark (High Growth, Low Market Share)
- 4.3.4. Dogs (Low Growth, Low Market Share)
- 4.4. Ansoff Matrix Analysis
- 4.5. Supply Chain Analysis
- 4.6. Regulatory Landscape
- 4.7. Current Market Potential and Opportunity Assessment (TAM–SAM–SOM Framework)
- 4.8. PRI Analyst Note
- 4.1. Porters Five Forces
- 5. Market Analysis, Insights and Forecast 2021-2033
- 5.1. Market Analysis, Insights and Forecast - by Volume
- 5.1.1. 100 ml - 250 ml
- 5.1.2. 250 ml - 500 ml
- 5.1.3. 500 ml - 1000 ml
- 5.1.4. 1000 ml - 2000 ml
- 5.1.5. 2000 ml and more
- 5.2. Market Analysis, Insights and Forecast - by Application
- 5.2.1. Therapeutic Injections
- 5.2.2. Fluid Balance Injections
- 5.2.3. Nutritious Injections
- 5.3. Market Analysis, Insights and Forecast - by Type of Packaging
- 5.3.1. Bottles
- 5.3.2. Bags
- 5.4. Market Analysis, Insights and Forecast - by Region
- 5.4.1. North America
- 5.4.2. Europe
- 5.4.3. Asia Pacific
- 5.4.4. Middle East and Africa
- 5.4.5. South America
- 5.1. Market Analysis, Insights and Forecast - by Volume
- 6. Global Large Volume Parenteral Industry Analysis, Insights and Forecast, 2021-2033
- 6.1. Market Analysis, Insights and Forecast - by Volume
- 6.1.1. 100 ml - 250 ml
- 6.1.2. 250 ml - 500 ml
- 6.1.3. 500 ml - 1000 ml
- 6.1.4. 1000 ml - 2000 ml
- 6.1.5. 2000 ml and more
- 6.2. Market Analysis, Insights and Forecast - by Application
- 6.2.1. Therapeutic Injections
- 6.2.2. Fluid Balance Injections
- 6.2.3. Nutritious Injections
- 6.3. Market Analysis, Insights and Forecast - by Type of Packaging
- 6.3.1. Bottles
- 6.3.2. Bags
- 6.1. Market Analysis, Insights and Forecast - by Volume
- 7. North America Large Volume Parenteral Industry Analysis, Insights and Forecast, 2020-2032
- 7.1. Market Analysis, Insights and Forecast - by Volume
- 7.1.1. 100 ml - 250 ml
- 7.1.2. 250 ml - 500 ml
- 7.1.3. 500 ml - 1000 ml
- 7.1.4. 1000 ml - 2000 ml
- 7.1.5. 2000 ml and more
- 7.2. Market Analysis, Insights and Forecast - by Application
- 7.2.1. Therapeutic Injections
- 7.2.2. Fluid Balance Injections
- 7.2.3. Nutritious Injections
- 7.3. Market Analysis, Insights and Forecast - by Type of Packaging
- 7.3.1. Bottles
- 7.3.2. Bags
- 7.1. Market Analysis, Insights and Forecast - by Volume
- 8. Europe Large Volume Parenteral Industry Analysis, Insights and Forecast, 2020-2032
- 8.1. Market Analysis, Insights and Forecast - by Volume
- 8.1.1. 100 ml - 250 ml
- 8.1.2. 250 ml - 500 ml
- 8.1.3. 500 ml - 1000 ml
- 8.1.4. 1000 ml - 2000 ml
- 8.1.5. 2000 ml and more
- 8.2. Market Analysis, Insights and Forecast - by Application
- 8.2.1. Therapeutic Injections
- 8.2.2. Fluid Balance Injections
- 8.2.3. Nutritious Injections
- 8.3. Market Analysis, Insights and Forecast - by Type of Packaging
- 8.3.1. Bottles
- 8.3.2. Bags
- 8.1. Market Analysis, Insights and Forecast - by Volume
- 9. Asia Pacific Large Volume Parenteral Industry Analysis, Insights and Forecast, 2020-2032
- 9.1. Market Analysis, Insights and Forecast - by Volume
- 9.1.1. 100 ml - 250 ml
- 9.1.2. 250 ml - 500 ml
- 9.1.3. 500 ml - 1000 ml
- 9.1.4. 1000 ml - 2000 ml
- 9.1.5. 2000 ml and more
- 9.2. Market Analysis, Insights and Forecast - by Application
- 9.2.1. Therapeutic Injections
- 9.2.2. Fluid Balance Injections
- 9.2.3. Nutritious Injections
- 9.3. Market Analysis, Insights and Forecast - by Type of Packaging
- 9.3.1. Bottles
- 9.3.2. Bags
- 9.1. Market Analysis, Insights and Forecast - by Volume
- 10. Middle East and Africa Large Volume Parenteral Industry Analysis, Insights and Forecast, 2020-2032
- 10.1. Market Analysis, Insights and Forecast - by Volume
- 10.1.1. 100 ml - 250 ml
- 10.1.2. 250 ml - 500 ml
- 10.1.3. 500 ml - 1000 ml
- 10.1.4. 1000 ml - 2000 ml
- 10.1.5. 2000 ml and more
- 10.2. Market Analysis, Insights and Forecast - by Application
- 10.2.1. Therapeutic Injections
- 10.2.2. Fluid Balance Injections
- 10.2.3. Nutritious Injections
- 10.3. Market Analysis, Insights and Forecast - by Type of Packaging
- 10.3.1. Bottles
- 10.3.2. Bags
- 10.1. Market Analysis, Insights and Forecast - by Volume
- 11. South America Large Volume Parenteral Industry Analysis, Insights and Forecast, 2020-2032
- 11.1. Market Analysis, Insights and Forecast - by Volume
- 11.1.1. 100 ml - 250 ml
- 11.1.2. 250 ml - 500 ml
- 11.1.3. 500 ml - 1000 ml
- 11.1.4. 1000 ml - 2000 ml
- 11.1.5. 2000 ml and more
- 11.2. Market Analysis, Insights and Forecast - by Application
- 11.2.1. Therapeutic Injections
- 11.2.2. Fluid Balance Injections
- 11.2.3. Nutritious Injections
- 11.3. Market Analysis, Insights and Forecast - by Type of Packaging
- 11.3.1. Bottles
- 11.3.2. Bags
- 11.1. Market Analysis, Insights and Forecast - by Volume
- 12. Competitive Analysis
- 12.1. Company Profiles
- 12.1.1 Fresenius (Fresenius Kabi AG)
- 12.1.1.1. Company Overview
- 12.1.1.2. Products
- 12.1.1.3. Company Financials
- 12.1.1.4. SWOT Analysis
- 12.1.2 Alde Medi Impex Ltd
- 12.1.2.1. Company Overview
- 12.1.2.2. Products
- 12.1.2.3. Company Financials
- 12.1.2.4. SWOT Analysis
- 12.1.3 Taj Pharma
- 12.1.3.1. Company Overview
- 12.1.3.2. Products
- 12.1.3.3. Company Financials
- 12.1.3.4. SWOT Analysis
- 12.1.4 ALTHEA Pharma
- 12.1.4.1. Company Overview
- 12.1.4.2. Products
- 12.1.4.3. Company Financials
- 12.1.4.4. SWOT Analysis
- 12.1.5 Albert David Ltd
- 12.1.5.1. Company Overview
- 12.1.5.2. Products
- 12.1.5.3. Company Financials
- 12.1.5.4. SWOT Analysis
- 12.1.6 Higgs Healthcae
- 12.1.6.1. Company Overview
- 12.1.6.2. Products
- 12.1.6.3. Company Financials
- 12.1.6.4. SWOT Analysis
- 12.1.7 Grifols S A
- 12.1.7.1. Company Overview
- 12.1.7.2. Products
- 12.1.7.3. Company Financials
- 12.1.7.4. SWOT Analysis
- 12.1.8 Baxter International
- 12.1.8.1. Company Overview
- 12.1.8.2. Products
- 12.1.8.3. Company Financials
- 12.1.8.4. SWOT Analysis
- 12.1.9 B Braun SE
- 12.1.9.1. Company Overview
- 12.1.9.2. Products
- 12.1.9.3. Company Financials
- 12.1.9.4. SWOT Analysis
- 12.1.10 BML Parenteral Drugs
- 12.1.10.1. Company Overview
- 12.1.10.2. Products
- 12.1.10.3. Company Financials
- 12.1.10.4. SWOT Analysis
- 12.1.11 Pfizer Inc
- 12.1.11.1. Company Overview
- 12.1.11.2. Products
- 12.1.11.3. Company Financials
- 12.1.11.4. SWOT Analysis
- 12.1.1 Fresenius (Fresenius Kabi AG)
- 12.2. Market Entropy
- 12.2.1 Company's Key Areas Served
- 12.2.2 Recent Developments
- 12.3. Company Market Share Analysis 2025
- 12.3.1 Top 5 Companies Market Share Analysis
- 12.3.2 Top 3 Companies Market Share Analysis
- 12.4. List of Potential Customers
- 13. Research Methodology
List of Figures
- Figure 1: Global Large Volume Parenteral Industry Revenue Breakdown (billion, %) by Region 2025 & 2033
- Figure 2: Global Large Volume Parenteral Industry Volume Breakdown (K Unit, %) by Region 2025 & 2033
- Figure 3: North America Large Volume Parenteral Industry Revenue (billion), by Volume 2025 & 2033
- Figure 4: North America Large Volume Parenteral Industry Volume (K Unit), by Volume 2025 & 2033
- Figure 5: North America Large Volume Parenteral Industry Revenue Share (%), by Volume 2025 & 2033
- Figure 6: North America Large Volume Parenteral Industry Volume Share (%), by Volume 2025 & 2033
- Figure 7: North America Large Volume Parenteral Industry Revenue (billion), by Application 2025 & 2033
- Figure 8: North America Large Volume Parenteral Industry Volume (K Unit), by Application 2025 & 2033
- Figure 9: North America Large Volume Parenteral Industry Revenue Share (%), by Application 2025 & 2033
- Figure 10: North America Large Volume Parenteral Industry Volume Share (%), by Application 2025 & 2033
- Figure 11: North America Large Volume Parenteral Industry Revenue (billion), by Type of Packaging 2025 & 2033
- Figure 12: North America Large Volume Parenteral Industry Volume (K Unit), by Type of Packaging 2025 & 2033
- Figure 13: North America Large Volume Parenteral Industry Revenue Share (%), by Type of Packaging 2025 & 2033
- Figure 14: North America Large Volume Parenteral Industry Volume Share (%), by Type of Packaging 2025 & 2033
- Figure 15: North America Large Volume Parenteral Industry Revenue (billion), by Country 2025 & 2033
- Figure 16: North America Large Volume Parenteral Industry Volume (K Unit), by Country 2025 & 2033
- Figure 17: North America Large Volume Parenteral Industry Revenue Share (%), by Country 2025 & 2033
- Figure 18: North America Large Volume Parenteral Industry Volume Share (%), by Country 2025 & 2033
- Figure 19: Europe Large Volume Parenteral Industry Revenue (billion), by Volume 2025 & 2033
- Figure 20: Europe Large Volume Parenteral Industry Volume (K Unit), by Volume 2025 & 2033
- Figure 21: Europe Large Volume Parenteral Industry Revenue Share (%), by Volume 2025 & 2033
- Figure 22: Europe Large Volume Parenteral Industry Volume Share (%), by Volume 2025 & 2033
- Figure 23: Europe Large Volume Parenteral Industry Revenue (billion), by Application 2025 & 2033
- Figure 24: Europe Large Volume Parenteral Industry Volume (K Unit), by Application 2025 & 2033
- Figure 25: Europe Large Volume Parenteral Industry Revenue Share (%), by Application 2025 & 2033
- Figure 26: Europe Large Volume Parenteral Industry Volume Share (%), by Application 2025 & 2033
- Figure 27: Europe Large Volume Parenteral Industry Revenue (billion), by Type of Packaging 2025 & 2033
- Figure 28: Europe Large Volume Parenteral Industry Volume (K Unit), by Type of Packaging 2025 & 2033
- Figure 29: Europe Large Volume Parenteral Industry Revenue Share (%), by Type of Packaging 2025 & 2033
- Figure 30: Europe Large Volume Parenteral Industry Volume Share (%), by Type of Packaging 2025 & 2033
- Figure 31: Europe Large Volume Parenteral Industry Revenue (billion), by Country 2025 & 2033
- Figure 32: Europe Large Volume Parenteral Industry Volume (K Unit), by Country 2025 & 2033
- Figure 33: Europe Large Volume Parenteral Industry Revenue Share (%), by Country 2025 & 2033
- Figure 34: Europe Large Volume Parenteral Industry Volume Share (%), by Country 2025 & 2033
- Figure 35: Asia Pacific Large Volume Parenteral Industry Revenue (billion), by Volume 2025 & 2033
- Figure 36: Asia Pacific Large Volume Parenteral Industry Volume (K Unit), by Volume 2025 & 2033
- Figure 37: Asia Pacific Large Volume Parenteral Industry Revenue Share (%), by Volume 2025 & 2033
- Figure 38: Asia Pacific Large Volume Parenteral Industry Volume Share (%), by Volume 2025 & 2033
- Figure 39: Asia Pacific Large Volume Parenteral Industry Revenue (billion), by Application 2025 & 2033
- Figure 40: Asia Pacific Large Volume Parenteral Industry Volume (K Unit), by Application 2025 & 2033
- Figure 41: Asia Pacific Large Volume Parenteral Industry Revenue Share (%), by Application 2025 & 2033
- Figure 42: Asia Pacific Large Volume Parenteral Industry Volume Share (%), by Application 2025 & 2033
- Figure 43: Asia Pacific Large Volume Parenteral Industry Revenue (billion), by Type of Packaging 2025 & 2033
- Figure 44: Asia Pacific Large Volume Parenteral Industry Volume (K Unit), by Type of Packaging 2025 & 2033
- Figure 45: Asia Pacific Large Volume Parenteral Industry Revenue Share (%), by Type of Packaging 2025 & 2033
- Figure 46: Asia Pacific Large Volume Parenteral Industry Volume Share (%), by Type of Packaging 2025 & 2033
- Figure 47: Asia Pacific Large Volume Parenteral Industry Revenue (billion), by Country 2025 & 2033
- Figure 48: Asia Pacific Large Volume Parenteral Industry Volume (K Unit), by Country 2025 & 2033
- Figure 49: Asia Pacific Large Volume Parenteral Industry Revenue Share (%), by Country 2025 & 2033
- Figure 50: Asia Pacific Large Volume Parenteral Industry Volume Share (%), by Country 2025 & 2033
- Figure 51: Middle East and Africa Large Volume Parenteral Industry Revenue (billion), by Volume 2025 & 2033
- Figure 52: Middle East and Africa Large Volume Parenteral Industry Volume (K Unit), by Volume 2025 & 2033
- Figure 53: Middle East and Africa Large Volume Parenteral Industry Revenue Share (%), by Volume 2025 & 2033
- Figure 54: Middle East and Africa Large Volume Parenteral Industry Volume Share (%), by Volume 2025 & 2033
- Figure 55: Middle East and Africa Large Volume Parenteral Industry Revenue (billion), by Application 2025 & 2033
- Figure 56: Middle East and Africa Large Volume Parenteral Industry Volume (K Unit), by Application 2025 & 2033
- Figure 57: Middle East and Africa Large Volume Parenteral Industry Revenue Share (%), by Application 2025 & 2033
- Figure 58: Middle East and Africa Large Volume Parenteral Industry Volume Share (%), by Application 2025 & 2033
- Figure 59: Middle East and Africa Large Volume Parenteral Industry Revenue (billion), by Type of Packaging 2025 & 2033
- Figure 60: Middle East and Africa Large Volume Parenteral Industry Volume (K Unit), by Type of Packaging 2025 & 2033
- Figure 61: Middle East and Africa Large Volume Parenteral Industry Revenue Share (%), by Type of Packaging 2025 & 2033
- Figure 62: Middle East and Africa Large Volume Parenteral Industry Volume Share (%), by Type of Packaging 2025 & 2033
- Figure 63: Middle East and Africa Large Volume Parenteral Industry Revenue (billion), by Country 2025 & 2033
- Figure 64: Middle East and Africa Large Volume Parenteral Industry Volume (K Unit), by Country 2025 & 2033
- Figure 65: Middle East and Africa Large Volume Parenteral Industry Revenue Share (%), by Country 2025 & 2033
- Figure 66: Middle East and Africa Large Volume Parenteral Industry Volume Share (%), by Country 2025 & 2033
- Figure 67: South America Large Volume Parenteral Industry Revenue (billion), by Volume 2025 & 2033
- Figure 68: South America Large Volume Parenteral Industry Volume (K Unit), by Volume 2025 & 2033
- Figure 69: South America Large Volume Parenteral Industry Revenue Share (%), by Volume 2025 & 2033
- Figure 70: South America Large Volume Parenteral Industry Volume Share (%), by Volume 2025 & 2033
- Figure 71: South America Large Volume Parenteral Industry Revenue (billion), by Application 2025 & 2033
- Figure 72: South America Large Volume Parenteral Industry Volume (K Unit), by Application 2025 & 2033
- Figure 73: South America Large Volume Parenteral Industry Revenue Share (%), by Application 2025 & 2033
- Figure 74: South America Large Volume Parenteral Industry Volume Share (%), by Application 2025 & 2033
- Figure 75: South America Large Volume Parenteral Industry Revenue (billion), by Type of Packaging 2025 & 2033
- Figure 76: South America Large Volume Parenteral Industry Volume (K Unit), by Type of Packaging 2025 & 2033
- Figure 77: South America Large Volume Parenteral Industry Revenue Share (%), by Type of Packaging 2025 & 2033
- Figure 78: South America Large Volume Parenteral Industry Volume Share (%), by Type of Packaging 2025 & 2033
- Figure 79: South America Large Volume Parenteral Industry Revenue (billion), by Country 2025 & 2033
- Figure 80: South America Large Volume Parenteral Industry Volume (K Unit), by Country 2025 & 2033
- Figure 81: South America Large Volume Parenteral Industry Revenue Share (%), by Country 2025 & 2033
- Figure 82: South America Large Volume Parenteral Industry Volume Share (%), by Country 2025 & 2033
List of Tables
- Table 1: Global Large Volume Parenteral Industry Revenue billion Forecast, by Volume 2020 & 2033
- Table 2: Global Large Volume Parenteral Industry Volume K Unit Forecast, by Volume 2020 & 2033
- Table 3: Global Large Volume Parenteral Industry Revenue billion Forecast, by Application 2020 & 2033
- Table 4: Global Large Volume Parenteral Industry Volume K Unit Forecast, by Application 2020 & 2033
- Table 5: Global Large Volume Parenteral Industry Revenue billion Forecast, by Type of Packaging 2020 & 2033
- Table 6: Global Large Volume Parenteral Industry Volume K Unit Forecast, by Type of Packaging 2020 & 2033
- Table 7: Global Large Volume Parenteral Industry Revenue billion Forecast, by Region 2020 & 2033
- Table 8: Global Large Volume Parenteral Industry Volume K Unit Forecast, by Region 2020 & 2033
- Table 9: Global Large Volume Parenteral Industry Revenue billion Forecast, by Volume 2020 & 2033
- Table 10: Global Large Volume Parenteral Industry Volume K Unit Forecast, by Volume 2020 & 2033
- Table 11: Global Large Volume Parenteral Industry Revenue billion Forecast, by Application 2020 & 2033
- Table 12: Global Large Volume Parenteral Industry Volume K Unit Forecast, by Application 2020 & 2033
- Table 13: Global Large Volume Parenteral Industry Revenue billion Forecast, by Type of Packaging 2020 & 2033
- Table 14: Global Large Volume Parenteral Industry Volume K Unit Forecast, by Type of Packaging 2020 & 2033
- Table 15: Global Large Volume Parenteral Industry Revenue billion Forecast, by Country 2020 & 2033
- Table 16: Global Large Volume Parenteral Industry Volume K Unit Forecast, by Country 2020 & 2033
- Table 17: United States Large Volume Parenteral Industry Revenue (billion) Forecast, by Application 2020 & 2033
- Table 18: United States Large Volume Parenteral Industry Volume (K Unit) Forecast, by Application 2020 & 2033
- Table 19: Canada Large Volume Parenteral Industry Revenue (billion) Forecast, by Application 2020 & 2033
- Table 20: Canada Large Volume Parenteral Industry Volume (K Unit) Forecast, by Application 2020 & 2033
- Table 21: Mexico Large Volume Parenteral Industry Revenue (billion) Forecast, by Application 2020 & 2033
- Table 22: Mexico Large Volume Parenteral Industry Volume (K Unit) Forecast, by Application 2020 & 2033
- Table 23: Global Large Volume Parenteral Industry Revenue billion Forecast, by Volume 2020 & 2033
- Table 24: Global Large Volume Parenteral Industry Volume K Unit Forecast, by Volume 2020 & 2033
- Table 25: Global Large Volume Parenteral Industry Revenue billion Forecast, by Application 2020 & 2033
- Table 26: Global Large Volume Parenteral Industry Volume K Unit Forecast, by Application 2020 & 2033
- Table 27: Global Large Volume Parenteral Industry Revenue billion Forecast, by Type of Packaging 2020 & 2033
- Table 28: Global Large Volume Parenteral Industry Volume K Unit Forecast, by Type of Packaging 2020 & 2033
- Table 29: Global Large Volume Parenteral Industry Revenue billion Forecast, by Country 2020 & 2033
- Table 30: Global Large Volume Parenteral Industry Volume K Unit Forecast, by Country 2020 & 2033
- Table 31: Germany Large Volume Parenteral Industry Revenue (billion) Forecast, by Application 2020 & 2033
- Table 32: Germany Large Volume Parenteral Industry Volume (K Unit) Forecast, by Application 2020 & 2033
- Table 33: United Kingdom Large Volume Parenteral Industry Revenue (billion) Forecast, by Application 2020 & 2033
- Table 34: United Kingdom Large Volume Parenteral Industry Volume (K Unit) Forecast, by Application 2020 & 2033
- Table 35: France Large Volume Parenteral Industry Revenue (billion) Forecast, by Application 2020 & 2033
- Table 36: France Large Volume Parenteral Industry Volume (K Unit) Forecast, by Application 2020 & 2033
- Table 37: Italy Large Volume Parenteral Industry Revenue (billion) Forecast, by Application 2020 & 2033
- Table 38: Italy Large Volume Parenteral Industry Volume (K Unit) Forecast, by Application 2020 & 2033
- Table 39: Spain Large Volume Parenteral Industry Revenue (billion) Forecast, by Application 2020 & 2033
- Table 40: Spain Large Volume Parenteral Industry Volume (K Unit) Forecast, by Application 2020 & 2033
- Table 41: Rest of Europe Large Volume Parenteral Industry Revenue (billion) Forecast, by Application 2020 & 2033
- Table 42: Rest of Europe Large Volume Parenteral Industry Volume (K Unit) Forecast, by Application 2020 & 2033
- Table 43: Global Large Volume Parenteral Industry Revenue billion Forecast, by Volume 2020 & 2033
- Table 44: Global Large Volume Parenteral Industry Volume K Unit Forecast, by Volume 2020 & 2033
- Table 45: Global Large Volume Parenteral Industry Revenue billion Forecast, by Application 2020 & 2033
- Table 46: Global Large Volume Parenteral Industry Volume K Unit Forecast, by Application 2020 & 2033
- Table 47: Global Large Volume Parenteral Industry Revenue billion Forecast, by Type of Packaging 2020 & 2033
- Table 48: Global Large Volume Parenteral Industry Volume K Unit Forecast, by Type of Packaging 2020 & 2033
- Table 49: Global Large Volume Parenteral Industry Revenue billion Forecast, by Country 2020 & 2033
- Table 50: Global Large Volume Parenteral Industry Volume K Unit Forecast, by Country 2020 & 2033
- Table 51: China Large Volume Parenteral Industry Revenue (billion) Forecast, by Application 2020 & 2033
- Table 52: China Large Volume Parenteral Industry Volume (K Unit) Forecast, by Application 2020 & 2033
- Table 53: Japan Large Volume Parenteral Industry Revenue (billion) Forecast, by Application 2020 & 2033
- Table 54: Japan Large Volume Parenteral Industry Volume (K Unit) Forecast, by Application 2020 & 2033
- Table 55: India Large Volume Parenteral Industry Revenue (billion) Forecast, by Application 2020 & 2033
- Table 56: India Large Volume Parenteral Industry Volume (K Unit) Forecast, by Application 2020 & 2033
- Table 57: Australia Large Volume Parenteral Industry Revenue (billion) Forecast, by Application 2020 & 2033
- Table 58: Australia Large Volume Parenteral Industry Volume (K Unit) Forecast, by Application 2020 & 2033
- Table 59: South Korea Large Volume Parenteral Industry Revenue (billion) Forecast, by Application 2020 & 2033
- Table 60: South Korea Large Volume Parenteral Industry Volume (K Unit) Forecast, by Application 2020 & 2033
- Table 61: Rest of Asia Pacific Large Volume Parenteral Industry Revenue (billion) Forecast, by Application 2020 & 2033
- Table 62: Rest of Asia Pacific Large Volume Parenteral Industry Volume (K Unit) Forecast, by Application 2020 & 2033
- Table 63: Global Large Volume Parenteral Industry Revenue billion Forecast, by Volume 2020 & 2033
- Table 64: Global Large Volume Parenteral Industry Volume K Unit Forecast, by Volume 2020 & 2033
- Table 65: Global Large Volume Parenteral Industry Revenue billion Forecast, by Application 2020 & 2033
- Table 66: Global Large Volume Parenteral Industry Volume K Unit Forecast, by Application 2020 & 2033
- Table 67: Global Large Volume Parenteral Industry Revenue billion Forecast, by Type of Packaging 2020 & 2033
- Table 68: Global Large Volume Parenteral Industry Volume K Unit Forecast, by Type of Packaging 2020 & 2033
- Table 69: Global Large Volume Parenteral Industry Revenue billion Forecast, by Country 2020 & 2033
- Table 70: Global Large Volume Parenteral Industry Volume K Unit Forecast, by Country 2020 & 2033
- Table 71: GCC Large Volume Parenteral Industry Revenue (billion) Forecast, by Application 2020 & 2033
- Table 72: GCC Large Volume Parenteral Industry Volume (K Unit) Forecast, by Application 2020 & 2033
- Table 73: South Africa Large Volume Parenteral Industry Revenue (billion) Forecast, by Application 2020 & 2033
- Table 74: South Africa Large Volume Parenteral Industry Volume (K Unit) Forecast, by Application 2020 & 2033
- Table 75: Rest of Middle East and Africa Large Volume Parenteral Industry Revenue (billion) Forecast, by Application 2020 & 2033
- Table 76: Rest of Middle East and Africa Large Volume Parenteral Industry Volume (K Unit) Forecast, by Application 2020 & 2033
- Table 77: Global Large Volume Parenteral Industry Revenue billion Forecast, by Volume 2020 & 2033
- Table 78: Global Large Volume Parenteral Industry Volume K Unit Forecast, by Volume 2020 & 2033
- Table 79: Global Large Volume Parenteral Industry Revenue billion Forecast, by Application 2020 & 2033
- Table 80: Global Large Volume Parenteral Industry Volume K Unit Forecast, by Application 2020 & 2033
- Table 81: Global Large Volume Parenteral Industry Revenue billion Forecast, by Type of Packaging 2020 & 2033
- Table 82: Global Large Volume Parenteral Industry Volume K Unit Forecast, by Type of Packaging 2020 & 2033
- Table 83: Global Large Volume Parenteral Industry Revenue billion Forecast, by Country 2020 & 2033
- Table 84: Global Large Volume Parenteral Industry Volume K Unit Forecast, by Country 2020 & 2033
- Table 85: Brazil Large Volume Parenteral Industry Revenue (billion) Forecast, by Application 2020 & 2033
- Table 86: Brazil Large Volume Parenteral Industry Volume (K Unit) Forecast, by Application 2020 & 2033
- Table 87: Argentina Large Volume Parenteral Industry Revenue (billion) Forecast, by Application 2020 & 2033
- Table 88: Argentina Large Volume Parenteral Industry Volume (K Unit) Forecast, by Application 2020 & 2033
- Table 89: Rest of South America Large Volume Parenteral Industry Revenue (billion) Forecast, by Application 2020 & 2033
- Table 90: Rest of South America Large Volume Parenteral Industry Volume (K Unit) Forecast, by Application 2020 & 2033
Frequently Asked Questions
1. What is the projected Compound Annual Growth Rate (CAGR) of the Large Volume Parenteral Industry?
The projected CAGR is approximately 5.05%.
2. Which companies are prominent players in the Large Volume Parenteral Industry?
Key companies in the market include Fresenius (Fresenius Kabi AG), Alde Medi Impex Ltd, Taj Pharma, ALTHEA Pharma, Albert David Ltd, Higgs Healthcae, Grifols S A, Baxter International, B Braun SE, BML Parenteral Drugs, Pfizer Inc.
3. What are the main segments of the Large Volume Parenteral Industry?
The market segments include Volume, Application, Type of Packaging.
4. Can you provide details about the market size?
The market size is estimated to be USD 12.385 billion as of 2022.
5. What are some drivers contributing to market growth?
Rising Number of Surgeries; Increase in Prevalence of Chronic Diseases and Rise in Adoption of Fluid Replacement Therapies.
6. What are the notable trends driving market growth?
Therapeutics Injections Segment is Expected to Hold a Significant Market Share Over the Forecast Period.
7. Are there any restraints impacting market growth?
Challenges in Formulation of LVPs.
8. Can you provide examples of recent developments in the market?
In November 2022, WuXi STA, a subsidiary of WuXi AppTec, started operating a new parenteral formulation manufacturing line at the drug product site in Wuxi City, China. This new line features a fully automatic vial loading/unloading system and a built-in 15 m2 lyophiliser in a fully enclosed isolator. The filling speed can reach 200 vials per minute, significantly accelerating large-volume parental drug product production speed.
9. What pricing options are available for accessing the report?
Pricing options include single-user, multi-user, and enterprise licenses priced at USD 4750, USD 5250, and USD 8750 respectively.
10. Is the market size provided in terms of value or volume?
The market size is provided in terms of value, measured in billion and volume, measured in K Unit.
11. Are there any specific market keywords associated with the report?
Yes, the market keyword associated with the report is "Large Volume Parenteral Industry," which aids in identifying and referencing the specific market segment covered.
12. How do I determine which pricing option suits my needs best?
The pricing options vary based on user requirements and access needs. Individual users may opt for single-user licenses, while businesses requiring broader access may choose multi-user or enterprise licenses for cost-effective access to the report.
13. Are there any additional resources or data provided in the Large Volume Parenteral Industry report?
While the report offers comprehensive insights, it's advisable to review the specific contents or supplementary materials provided to ascertain if additional resources or data are available.
14. How can I stay updated on further developments or reports in the Large Volume Parenteral Industry?
To stay informed about further developments, trends, and reports in the Large Volume Parenteral Industry, consider subscribing to industry newsletters, following relevant companies and organizations, or regularly checking reputable industry news sources and publications.
Methodology
Step 1 - Identification of Relevant Samples Size from Population Database


Step 2 - Approaches for Defining Global Market Size (Value, Volume* & Price*)

Note*: In applicable scenarios
Step 3 - Data Sources
Primary Research
- Web Analytics
- Survey Reports
- Research Institute
- Latest Research Reports
- Opinion Leaders
Secondary Research
- Annual Reports
- White Paper
- Latest Press Release
- Industry Association
- Paid Database
- Investor Presentations

Step 4 - Data Triangulation
Involves using different sources of information in order to increase the validity of a study
These sources are likely to be stakeholders in a program - participants, other researchers, program staff, other community members, and so on.
Then we put all data in single framework & apply various statistical tools to find out the dynamic on the market.
During the analysis stage, feedback from the stakeholder groups would be compared to determine areas of agreement as well as areas of divergence