
Key Insights
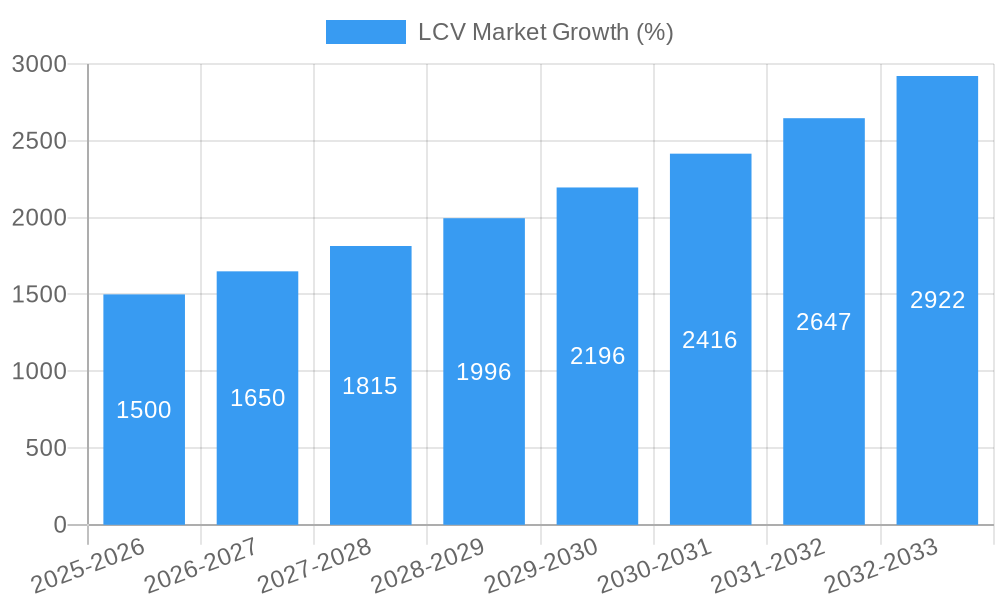
The European Light Commercial Vehicle (LCV) market, encompassing countries like Germany, France, the UK, and others, is experiencing robust growth, projected to maintain a Compound Annual Growth Rate (CAGR) of 10.55% from 2025 to 2033. This expansion is fueled by several key factors. The increasing demand for efficient last-mile delivery solutions, driven by the e-commerce boom and the growth of urban logistics, is a significant contributor. Furthermore, stringent emission regulations are pushing manufacturers to invest heavily in hybrid and electric LCVs, stimulating market innovation and adoption. The burgeoning construction and infrastructure sectors across Europe also contribute to strong demand for LCVs. While the market faces potential headwinds like supply chain disruptions and fluctuating fuel prices, these challenges are being mitigated by advancements in battery technology, improved charging infrastructure, and government incentives promoting greener transportation solutions. Major players like Peugeot S.A., Volkswagen AG, and others are strategically investing in research and development to capitalize on the growing market opportunities, further accelerating the sector's evolution.
The segmentation of the European LCV market reveals interesting trends. While traditional fuel-powered vehicles still hold a significant share, the segment of hybrid and electric LCVs is experiencing exponential growth, driven by both environmental concerns and economic benefits (lower running costs). The LPG (Liquefied Petroleum Gas) segment also holds a notable position, benefitting from its relatively lower emission profile compared to traditional diesel or gasoline engines. Geographical variations exist; countries with robust infrastructure development and strong government support for green initiatives show higher adoption rates for electric and hybrid LCVs. The forecast period indicates a continuous market expansion, with a potential surge in sales driven by new model launches, enhanced technological advancements, and a shifting consumer preference towards sustainable and cost-effective transportation solutions. This growth is expected to be concentrated primarily in larger European economies, reflecting their higher infrastructure investments and demand for transportation services.
LCV Market Report: A Comprehensive Analysis of Trends and Growth (2019-2033)
This in-depth report provides a comprehensive analysis of the Light Commercial Vehicle (LCV) market, offering valuable insights for industry professionals, investors, and strategists. Covering the period 2019-2033, with a focus on the 2025-2033 forecast, this report meticulously examines market dynamics, growth drivers, key players, and future opportunities across various segments and geographies. The report analyzes key players such as Peugeot S A, Volkswagen A G, Fiat Chrysler Automobiles N V, Mercedes-Benz, Groupe Renault, Toyota Motor Corporation, and Ford Motor Company. The market size is projected to reach xx Million by 2033.
LCV Market Structure & Innovation Trends
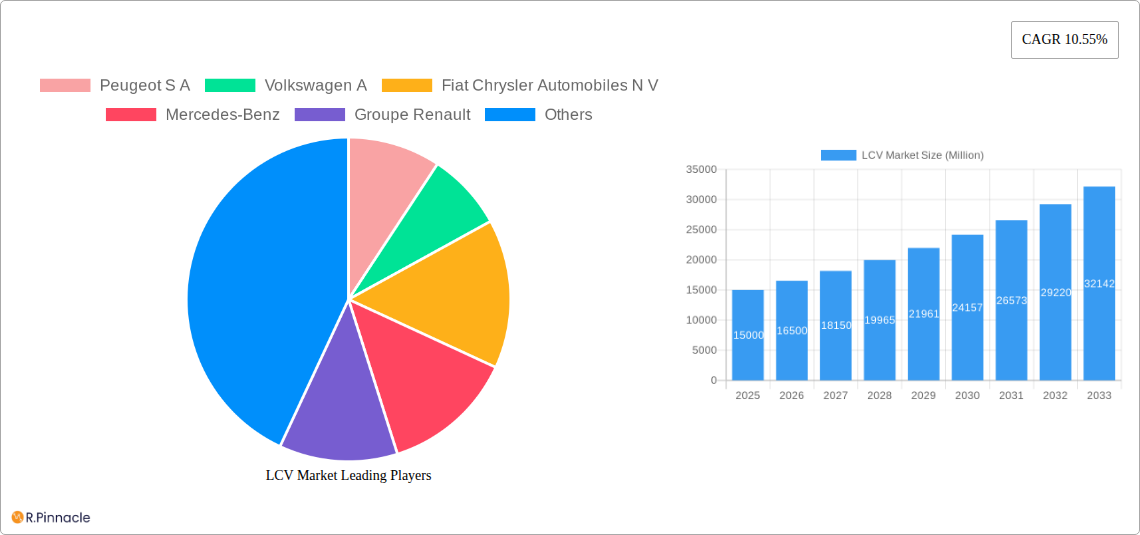
This section analyzes the competitive landscape, focusing on market concentration, innovation drivers, regulatory influences, and market dynamics. The study period (2019-2024) reveals a market share distribution with Peugeot S A holding xx%, Volkswagen AG at xx%, Fiat Chrysler Automobiles N V at xx%, and Mercedes-Benz at xx%. The remaining market share is divided among other key players.
- Market Concentration: The LCV market exhibits a moderately consolidated structure, with a few dominant players accounting for a significant portion of the total market share.
- Innovation Drivers: Stringent emission regulations, increasing demand for fuel-efficient vehicles, and advancements in electric and hybrid technologies are key innovation drivers.
- Regulatory Frameworks: Government policies promoting sustainable transportation and investments in charging infrastructure significantly impact market growth.
- Product Substitutes: Alternatives such as cargo bikes and delivery drones are emerging, posing a potential threat to conventional LCVs.
- End-User Demographics: The expanding e-commerce sector and last-mile delivery services are driving demand for LCVs.
- M&A Activities: Consolidation is expected, with potential M&A deal values estimated at xx Million in the coming years.
LCV Market Dynamics & Trends
The LCV market is characterized by significant growth, driven by factors including rising urbanization, expanding e-commerce, and favorable government policies. The compound annual growth rate (CAGR) during the forecast period (2025-2033) is projected to be xx%. Market penetration of electric and hybrid LCVs is expected to increase to xx% by 2033. Technological advancements, evolving consumer preferences (increased demand for safety features, connectivity and automation) and intense competition are shaping market dynamics.
Dominant Regions & Segments in LCV Market
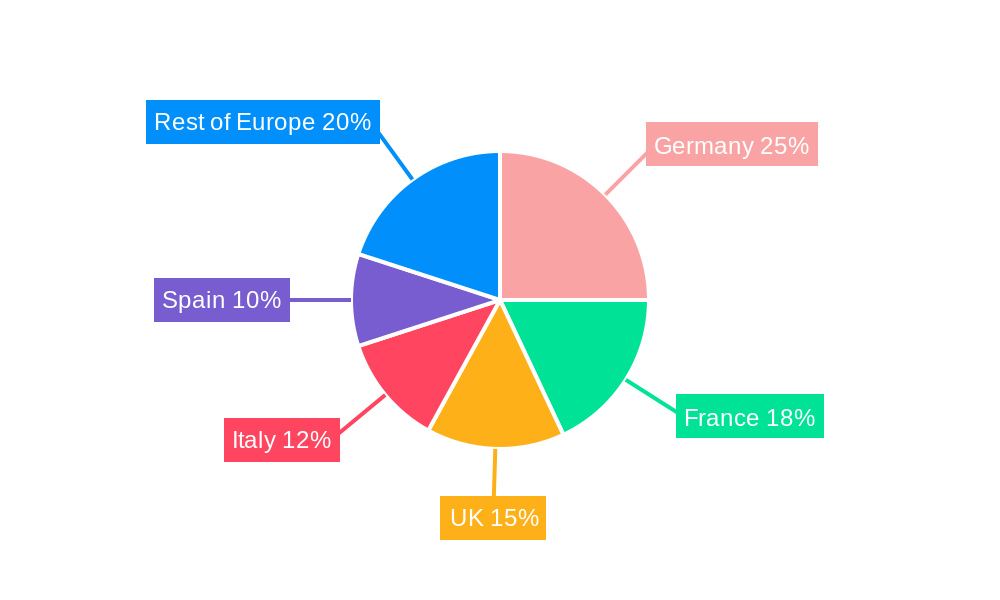
Germany, France, and the UK are leading European markets, exhibiting robust growth due to their strong economies, well-developed infrastructure, and supportive government policies. The hybrid and electric vehicle segment is experiencing rapid growth.
Key Drivers:
- Germany: Strong industrial base, high vehicle ownership, and government incentives for electric vehicles.
- France: Government initiatives promoting sustainable transportation and investments in charging infrastructure.
- UK: Growing demand from e-commerce and delivery services.
- Hybrid & Electric Vehicles: Government regulations and consumer preference for eco-friendly vehicles.
Dominance Analysis: Germany’s dominance is attributed to its robust automotive industry and strong domestic demand. France and the UK are catching up due to their investment in electric vehicle infrastructure and policies favoring electrification.
LCV Market Product Innovations
Recent innovations focus on electrification, improved fuel efficiency, enhanced safety features, and advanced driver-assistance systems (ADAS). The market is witnessing the introduction of electric vans designed for urban deliveries, and increased integration of telematics and connectivity features is enhancing fleet management and operational efficiency.
Report Scope & Segmentation Analysis
This report segments the LCV market by propulsion type (Hybrid and Electric Vehicles, LPG), vehicle type (Commercial Vehicles), and country (Austria, Belgium, Czech Republic, Denmark, Estonia, France, Germany, Ireland, Italy, Latvia, Lithuania, Norway, Poland, Russia, Spain, Sweden, UK, Rest-of-Europe). Each segment's growth projections, market sizes, and competitive dynamics are analyzed in detail.
Propulsion Type: The Hybrid and Electric Vehicles segment shows significant growth potential, driven by environmental concerns and government regulations. The LPG segment shows relatively steady growth compared to hybrid and electric.
Vehicle Type: The Commercial Vehicles segment holds the dominant market share and will continue its strong growth trajectory.
Country: Western European countries, particularly Germany, France, and the UK, have higher growth potential due to mature markets and stronger economies.
Key Drivers of LCV Market Growth
Key growth drivers include:
- Stringent emission regulations: Driving adoption of electric and hybrid vehicles.
- Rising demand for last-mile delivery: Boosting demand for small commercial vehicles.
- Advancements in battery technology: Improving the range and affordability of electric vehicles.
- Government incentives and subsidies: Supporting the transition to sustainable transportation.
Challenges in the LCV Market Sector
Challenges include:
- High initial cost of electric vehicles: Hindering wider adoption.
- Limited charging infrastructure: Restricting the range of electric vehicles.
- Supply chain disruptions: Impacting production and delivery.
- Intense competition: Putting pressure on profit margins.
Emerging Opportunities in LCV Market
Opportunities lie in:
- Expansion into developing markets: Significant untapped potential in emerging economies.
- Development of autonomous driving technologies: Enhancing efficiency and safety.
- Growth of shared mobility services: Increasing demand for flexible transportation solutions.
Leading Players in the LCV Market Market
- Peugeot S A
- Volkswagen A G
- Fiat Chrysler Automobiles N V
- Mercedes-Benz
- Groupe Renault
- Toyota Motor Corporation
- Ford Motor Company
Key Developments in LCV Market Industry
- June 2023: FORD NEXT launches a new pilot program offering flexible electric vehicle leasing options for Uber drivers in select U.S. markets.
- June 2023: Mercedes-Benz expands the availability of its DRIVE PILOT Level 3 autonomous driving system to California.
- May 2023: Mercedes-Benz Vans launches the electric eCitan van, available in two sizes (4498 mm and 5922 mm), targeting inner-city deliveries.
Future Outlook for LCV Market Market
The LCV market is poised for continued growth, driven by technological advancements, favorable government policies, and the increasing demand for efficient and sustainable transportation solutions. The market will experience significant growth in the electric and hybrid segments, along with the expansion of autonomous driving capabilities. Strategic partnerships and investments in innovative technologies will play a crucial role in shaping the future of the LCV market.
LCV Market Segmentation
-
1. Vehicle Type
-
1.1. Commercial Vehicles
- 1.1.1. Light Commercial Pick-up Trucks
- 1.1.2. Light Commercial Vans
-
1.1. Commercial Vehicles
-
2. Propulsion Type
-
2.1. Hybrid and Electric Vehicles
-
2.1.1. By Fuel Category
- 2.1.1.1. BEV
- 2.1.1.2. FCEV
- 2.1.1.3. HEV
- 2.1.1.4. PHEV
-
2.1.1. By Fuel Category
-
2.2. ICE
- 2.2.1. CNG
- 2.2.2. Diesel
- 2.2.3. Gasoline
- 2.2.4. LPG
-
2.1. Hybrid and Electric Vehicles
LCV Market Segmentation By Geography
-
1. North America
- 1.1. United States
- 1.2. Canada
- 1.3. Mexico
-
2. South America
- 2.1. Brazil
- 2.2. Argentina
- 2.3. Rest of South America
-
3. Europe
- 3.1. United Kingdom
- 3.2. Germany
- 3.3. France
- 3.4. Italy
- 3.5. Spain
- 3.6. Russia
- 3.7. Benelux
- 3.8. Nordics
- 3.9. Rest of Europe
-
4. Middle East & Africa
- 4.1. Turkey
- 4.2. Israel
- 4.3. GCC
- 4.4. North Africa
- 4.5. South Africa
- 4.6. Rest of Middle East & Africa
-
5. Asia Pacific
- 5.1. China
- 5.2. India
- 5.3. Japan
- 5.4. South Korea
- 5.5. ASEAN
- 5.6. Oceania
- 5.7. Rest of Asia Pacific
LCV Market REPORT HIGHLIGHTS
| Aspects | Details |
|---|---|
| Study Period | 2019-2033 |
| Base Year | 2024 |
| Estimated Year | 2025 |
| Forecast Period | 2025-2033 |
| Historical Period | 2019-2024 |
| Growth Rate | CAGR of 10.55% from 2019-2033 |
| Segmentation |
|
Table of Contents
- 1. Introduction
- 1.1. Research Scope
- 1.2. Market Segmentation
- 1.3. Research Methodology
- 1.4. Definitions and Assumptions
- 2. Executive Summary
- 2.1. Introduction
- 3. Market Dynamics
- 3.1. Introduction
- 3.2. Market Drivers
- 3.2.1. Growing Travel and Tourism Industry is Driving the Car Rental Market
- 3.3. Market Restrains
- 3.3.1. Increasing Popularity of Ride-Sharing Services Pose Challenges for the Conventional Car Rental Market
- 3.4. Market Trends
- 3.4.1. OTHER KEY INDUSTRY TRENDS COVERED IN THE REPORT
- 4. Market Factor Analysis
- 4.1. Porters Five Forces
- 4.2. Supply/Value Chain
- 4.3. PESTEL analysis
- 4.4. Market Entropy
- 4.5. Patent/Trademark Analysis
- 5. Global LCV Market Analysis, Insights and Forecast, 2019-2031
- 5.1. Market Analysis, Insights and Forecast - by Vehicle Type
- 5.1.1. Commercial Vehicles
- 5.1.1.1. Light Commercial Pick-up Trucks
- 5.1.1.2. Light Commercial Vans
- 5.1.1. Commercial Vehicles
- 5.2. Market Analysis, Insights and Forecast - by Propulsion Type
- 5.2.1. Hybrid and Electric Vehicles
- 5.2.1.1. By Fuel Category
- 5.2.1.1.1. BEV
- 5.2.1.1.2. FCEV
- 5.2.1.1.3. HEV
- 5.2.1.1.4. PHEV
- 5.2.1.1. By Fuel Category
- 5.2.2. ICE
- 5.2.2.1. CNG
- 5.2.2.2. Diesel
- 5.2.2.3. Gasoline
- 5.2.2.4. LPG
- 5.2.1. Hybrid and Electric Vehicles
- 5.3. Market Analysis, Insights and Forecast - by Region
- 5.3.1. North America
- 5.3.2. South America
- 5.3.3. Europe
- 5.3.4. Middle East & Africa
- 5.3.5. Asia Pacific
- 5.1. Market Analysis, Insights and Forecast - by Vehicle Type
- 6. North America LCV Market Analysis, Insights and Forecast, 2019-2031
- 6.1. Market Analysis, Insights and Forecast - by Vehicle Type
- 6.1.1. Commercial Vehicles
- 6.1.1.1. Light Commercial Pick-up Trucks
- 6.1.1.2. Light Commercial Vans
- 6.1.1. Commercial Vehicles
- 6.2. Market Analysis, Insights and Forecast - by Propulsion Type
- 6.2.1. Hybrid and Electric Vehicles
- 6.2.1.1. By Fuel Category
- 6.2.1.1.1. BEV
- 6.2.1.1.2. FCEV
- 6.2.1.1.3. HEV
- 6.2.1.1.4. PHEV
- 6.2.1.1. By Fuel Category
- 6.2.2. ICE
- 6.2.2.1. CNG
- 6.2.2.2. Diesel
- 6.2.2.3. Gasoline
- 6.2.2.4. LPG
- 6.2.1. Hybrid and Electric Vehicles
- 6.1. Market Analysis, Insights and Forecast - by Vehicle Type
- 7. South America LCV Market Analysis, Insights and Forecast, 2019-2031
- 7.1. Market Analysis, Insights and Forecast - by Vehicle Type
- 7.1.1. Commercial Vehicles
- 7.1.1.1. Light Commercial Pick-up Trucks
- 7.1.1.2. Light Commercial Vans
- 7.1.1. Commercial Vehicles
- 7.2. Market Analysis, Insights and Forecast - by Propulsion Type
- 7.2.1. Hybrid and Electric Vehicles
- 7.2.1.1. By Fuel Category
- 7.2.1.1.1. BEV
- 7.2.1.1.2. FCEV
- 7.2.1.1.3. HEV
- 7.2.1.1.4. PHEV
- 7.2.1.1. By Fuel Category
- 7.2.2. ICE
- 7.2.2.1. CNG
- 7.2.2.2. Diesel
- 7.2.2.3. Gasoline
- 7.2.2.4. LPG
- 7.2.1. Hybrid and Electric Vehicles
- 7.1. Market Analysis, Insights and Forecast - by Vehicle Type
- 8. Europe LCV Market Analysis, Insights and Forecast, 2019-2031
- 8.1. Market Analysis, Insights and Forecast - by Vehicle Type
- 8.1.1. Commercial Vehicles
- 8.1.1.1. Light Commercial Pick-up Trucks
- 8.1.1.2. Light Commercial Vans
- 8.1.1. Commercial Vehicles
- 8.2. Market Analysis, Insights and Forecast - by Propulsion Type
- 8.2.1. Hybrid and Electric Vehicles
- 8.2.1.1. By Fuel Category
- 8.2.1.1.1. BEV
- 8.2.1.1.2. FCEV
- 8.2.1.1.3. HEV
- 8.2.1.1.4. PHEV
- 8.2.1.1. By Fuel Category
- 8.2.2. ICE
- 8.2.2.1. CNG
- 8.2.2.2. Diesel
- 8.2.2.3. Gasoline
- 8.2.2.4. LPG
- 8.2.1. Hybrid and Electric Vehicles
- 8.1. Market Analysis, Insights and Forecast - by Vehicle Type
- 9. Middle East & Africa LCV Market Analysis, Insights and Forecast, 2019-2031
- 9.1. Market Analysis, Insights and Forecast - by Vehicle Type
- 9.1.1. Commercial Vehicles
- 9.1.1.1. Light Commercial Pick-up Trucks
- 9.1.1.2. Light Commercial Vans
- 9.1.1. Commercial Vehicles
- 9.2. Market Analysis, Insights and Forecast - by Propulsion Type
- 9.2.1. Hybrid and Electric Vehicles
- 9.2.1.1. By Fuel Category
- 9.2.1.1.1. BEV
- 9.2.1.1.2. FCEV
- 9.2.1.1.3. HEV
- 9.2.1.1.4. PHEV
- 9.2.1.1. By Fuel Category
- 9.2.2. ICE
- 9.2.2.1. CNG
- 9.2.2.2. Diesel
- 9.2.2.3. Gasoline
- 9.2.2.4. LPG
- 9.2.1. Hybrid and Electric Vehicles
- 9.1. Market Analysis, Insights and Forecast - by Vehicle Type
- 10. Asia Pacific LCV Market Analysis, Insights and Forecast, 2019-2031
- 10.1. Market Analysis, Insights and Forecast - by Vehicle Type
- 10.1.1. Commercial Vehicles
- 10.1.1.1. Light Commercial Pick-up Trucks
- 10.1.1.2. Light Commercial Vans
- 10.1.1. Commercial Vehicles
- 10.2. Market Analysis, Insights and Forecast - by Propulsion Type
- 10.2.1. Hybrid and Electric Vehicles
- 10.2.1.1. By Fuel Category
- 10.2.1.1.1. BEV
- 10.2.1.1.2. FCEV
- 10.2.1.1.3. HEV
- 10.2.1.1.4. PHEV
- 10.2.1.1. By Fuel Category
- 10.2.2. ICE
- 10.2.2.1. CNG
- 10.2.2.2. Diesel
- 10.2.2.3. Gasoline
- 10.2.2.4. LPG
- 10.2.1. Hybrid and Electric Vehicles
- 10.1. Market Analysis, Insights and Forecast - by Vehicle Type
- 11. Competitive Analysis
- 11.1. Global Market Share Analysis 2024
- 11.2. Company Profiles
- 11.2.1 Peugeot S A
- 11.2.1.1. Overview
- 11.2.1.2. Products
- 11.2.1.3. SWOT Analysis
- 11.2.1.4. Recent Developments
- 11.2.1.5. Financials (Based on Availability)
- 11.2.2 Volkswagen A
- 11.2.2.1. Overview
- 11.2.2.2. Products
- 11.2.2.3. SWOT Analysis
- 11.2.2.4. Recent Developments
- 11.2.2.5. Financials (Based on Availability)
- 11.2.3 Fiat Chrysler Automobiles N V
- 11.2.3.1. Overview
- 11.2.3.2. Products
- 11.2.3.3. SWOT Analysis
- 11.2.3.4. Recent Developments
- 11.2.3.5. Financials (Based on Availability)
- 11.2.4 Mercedes-Benz
- 11.2.4.1. Overview
- 11.2.4.2. Products
- 11.2.4.3. SWOT Analysis
- 11.2.4.4. Recent Developments
- 11.2.4.5. Financials (Based on Availability)
- 11.2.5 Groupe Renault
- 11.2.5.1. Overview
- 11.2.5.2. Products
- 11.2.5.3. SWOT Analysis
- 11.2.5.4. Recent Developments
- 11.2.5.5. Financials (Based on Availability)
- 11.2.6 Toyota Motor Corporation
- 11.2.6.1. Overview
- 11.2.6.2. Products
- 11.2.6.3. SWOT Analysis
- 11.2.6.4. Recent Developments
- 11.2.6.5. Financials (Based on Availability)
- 11.2.7 Ford Motor Company
- 11.2.7.1. Overview
- 11.2.7.2. Products
- 11.2.7.3. SWOT Analysis
- 11.2.7.4. Recent Developments
- 11.2.7.5. Financials (Based on Availability)
- 11.2.1 Peugeot S A
List of Figures
- Figure 1: Global LCV Market Revenue Breakdown (Million, %) by Region 2024 & 2032
- Figure 2: North America LCV Market Revenue (Million), by Vehicle Type 2024 & 2032
- Figure 3: North America LCV Market Revenue Share (%), by Vehicle Type 2024 & 2032
- Figure 4: North America LCV Market Revenue (Million), by Propulsion Type 2024 & 2032
- Figure 5: North America LCV Market Revenue Share (%), by Propulsion Type 2024 & 2032
- Figure 6: North America LCV Market Revenue (Million), by Country 2024 & 2032
- Figure 7: North America LCV Market Revenue Share (%), by Country 2024 & 2032
- Figure 8: South America LCV Market Revenue (Million), by Vehicle Type 2024 & 2032
- Figure 9: South America LCV Market Revenue Share (%), by Vehicle Type 2024 & 2032
- Figure 10: South America LCV Market Revenue (Million), by Propulsion Type 2024 & 2032
- Figure 11: South America LCV Market Revenue Share (%), by Propulsion Type 2024 & 2032
- Figure 12: South America LCV Market Revenue (Million), by Country 2024 & 2032
- Figure 13: South America LCV Market Revenue Share (%), by Country 2024 & 2032
- Figure 14: Europe LCV Market Revenue (Million), by Vehicle Type 2024 & 2032
- Figure 15: Europe LCV Market Revenue Share (%), by Vehicle Type 2024 & 2032
- Figure 16: Europe LCV Market Revenue (Million), by Propulsion Type 2024 & 2032
- Figure 17: Europe LCV Market Revenue Share (%), by Propulsion Type 2024 & 2032
- Figure 18: Europe LCV Market Revenue (Million), by Country 2024 & 2032
- Figure 19: Europe LCV Market Revenue Share (%), by Country 2024 & 2032
- Figure 20: Middle East & Africa LCV Market Revenue (Million), by Vehicle Type 2024 & 2032
- Figure 21: Middle East & Africa LCV Market Revenue Share (%), by Vehicle Type 2024 & 2032
- Figure 22: Middle East & Africa LCV Market Revenue (Million), by Propulsion Type 2024 & 2032
- Figure 23: Middle East & Africa LCV Market Revenue Share (%), by Propulsion Type 2024 & 2032
- Figure 24: Middle East & Africa LCV Market Revenue (Million), by Country 2024 & 2032
- Figure 25: Middle East & Africa LCV Market Revenue Share (%), by Country 2024 & 2032
- Figure 26: Asia Pacific LCV Market Revenue (Million), by Vehicle Type 2024 & 2032
- Figure 27: Asia Pacific LCV Market Revenue Share (%), by Vehicle Type 2024 & 2032
- Figure 28: Asia Pacific LCV Market Revenue (Million), by Propulsion Type 2024 & 2032
- Figure 29: Asia Pacific LCV Market Revenue Share (%), by Propulsion Type 2024 & 2032
- Figure 30: Asia Pacific LCV Market Revenue (Million), by Country 2024 & 2032
- Figure 31: Asia Pacific LCV Market Revenue Share (%), by Country 2024 & 2032
List of Tables
- Table 1: Global LCV Market Revenue Million Forecast, by Region 2019 & 2032
- Table 2: Global LCV Market Revenue Million Forecast, by Vehicle Type 2019 & 2032
- Table 3: Global LCV Market Revenue Million Forecast, by Propulsion Type 2019 & 2032
- Table 4: Global LCV Market Revenue Million Forecast, by Region 2019 & 2032
- Table 5: Global LCV Market Revenue Million Forecast, by Vehicle Type 2019 & 2032
- Table 6: Global LCV Market Revenue Million Forecast, by Propulsion Type 2019 & 2032
- Table 7: Global LCV Market Revenue Million Forecast, by Country 2019 & 2032
- Table 8: United States LCV Market Revenue (Million) Forecast, by Application 2019 & 2032
- Table 9: Canada LCV Market Revenue (Million) Forecast, by Application 2019 & 2032
- Table 10: Mexico LCV Market Revenue (Million) Forecast, by Application 2019 & 2032
- Table 11: Global LCV Market Revenue Million Forecast, by Vehicle Type 2019 & 2032
- Table 12: Global LCV Market Revenue Million Forecast, by Propulsion Type 2019 & 2032
- Table 13: Global LCV Market Revenue Million Forecast, by Country 2019 & 2032
- Table 14: Brazil LCV Market Revenue (Million) Forecast, by Application 2019 & 2032
- Table 15: Argentina LCV Market Revenue (Million) Forecast, by Application 2019 & 2032
- Table 16: Rest of South America LCV Market Revenue (Million) Forecast, by Application 2019 & 2032
- Table 17: Global LCV Market Revenue Million Forecast, by Vehicle Type 2019 & 2032
- Table 18: Global LCV Market Revenue Million Forecast, by Propulsion Type 2019 & 2032
- Table 19: Global LCV Market Revenue Million Forecast, by Country 2019 & 2032
- Table 20: United Kingdom LCV Market Revenue (Million) Forecast, by Application 2019 & 2032
- Table 21: Germany LCV Market Revenue (Million) Forecast, by Application 2019 & 2032
- Table 22: France LCV Market Revenue (Million) Forecast, by Application 2019 & 2032
- Table 23: Italy LCV Market Revenue (Million) Forecast, by Application 2019 & 2032
- Table 24: Spain LCV Market Revenue (Million) Forecast, by Application 2019 & 2032
- Table 25: Russia LCV Market Revenue (Million) Forecast, by Application 2019 & 2032
- Table 26: Benelux LCV Market Revenue (Million) Forecast, by Application 2019 & 2032
- Table 27: Nordics LCV Market Revenue (Million) Forecast, by Application 2019 & 2032
- Table 28: Rest of Europe LCV Market Revenue (Million) Forecast, by Application 2019 & 2032
- Table 29: Global LCV Market Revenue Million Forecast, by Vehicle Type 2019 & 2032
- Table 30: Global LCV Market Revenue Million Forecast, by Propulsion Type 2019 & 2032
- Table 31: Global LCV Market Revenue Million Forecast, by Country 2019 & 2032
- Table 32: Turkey LCV Market Revenue (Million) Forecast, by Application 2019 & 2032
- Table 33: Israel LCV Market Revenue (Million) Forecast, by Application 2019 & 2032
- Table 34: GCC LCV Market Revenue (Million) Forecast, by Application 2019 & 2032
- Table 35: North Africa LCV Market Revenue (Million) Forecast, by Application 2019 & 2032
- Table 36: South Africa LCV Market Revenue (Million) Forecast, by Application 2019 & 2032
- Table 37: Rest of Middle East & Africa LCV Market Revenue (Million) Forecast, by Application 2019 & 2032
- Table 38: Global LCV Market Revenue Million Forecast, by Vehicle Type 2019 & 2032
- Table 39: Global LCV Market Revenue Million Forecast, by Propulsion Type 2019 & 2032
- Table 40: Global LCV Market Revenue Million Forecast, by Country 2019 & 2032
- Table 41: China LCV Market Revenue (Million) Forecast, by Application 2019 & 2032
- Table 42: India LCV Market Revenue (Million) Forecast, by Application 2019 & 2032
- Table 43: Japan LCV Market Revenue (Million) Forecast, by Application 2019 & 2032
- Table 44: South Korea LCV Market Revenue (Million) Forecast, by Application 2019 & 2032
- Table 45: ASEAN LCV Market Revenue (Million) Forecast, by Application 2019 & 2032
- Table 46: Oceania LCV Market Revenue (Million) Forecast, by Application 2019 & 2032
- Table 47: Rest of Asia Pacific LCV Market Revenue (Million) Forecast, by Application 2019 & 2032
Frequently Asked Questions
1. What is the projected Compound Annual Growth Rate (CAGR) of the LCV Market?
The projected CAGR is approximately 10.55%.
2. Which companies are prominent players in the LCV Market?
Key companies in the market include Peugeot S A, Volkswagen A, Fiat Chrysler Automobiles N V, Mercedes-Benz, Groupe Renault, Toyota Motor Corporation, Ford Motor Company.
3. What are the main segments of the LCV Market?
The market segments include Vehicle Type, Propulsion Type.
4. Can you provide details about the market size?
The market size is estimated to be USD XX Million as of 2022.
5. What are some drivers contributing to market growth?
Growing Travel and Tourism Industry is Driving the Car Rental Market.
6. What are the notable trends driving market growth?
OTHER KEY INDUSTRY TRENDS COVERED IN THE REPORT.
7. Are there any restraints impacting market growth?
Increasing Popularity of Ride-Sharing Services Pose Challenges for the Conventional Car Rental Market.
8. Can you provide examples of recent developments in the market?
June 2023: FORD NEXT launches New pilot program creates flexible electric solutions for drivers who use the Uber platform in select U.S. markets, allowing them to lease a vehicle for more customized time periods.June 2023: Mercedes-Benz DRIVE PILOT expands U.S. availability to California and introduce a SAE Level 3 system in a standard-production vehicle for use on public freeways in the most populous state in the U.S.May 2023: Mercedes Benz Vans is launching its electric small van for innercity deliveries and servicing operations. eCitan is a vehicle panel with 2 options such as the compact version of 4498 mm and 5922 mm.
9. What pricing options are available for accessing the report?
Pricing options include single-user, multi-user, and enterprise licenses priced at USD 3800, USD 4500, and USD 5800 respectively.
10. Is the market size provided in terms of value or volume?
The market size is provided in terms of value, measured in Million.
11. Are there any specific market keywords associated with the report?
Yes, the market keyword associated with the report is "LCV Market," which aids in identifying and referencing the specific market segment covered.
12. How do I determine which pricing option suits my needs best?
The pricing options vary based on user requirements and access needs. Individual users may opt for single-user licenses, while businesses requiring broader access may choose multi-user or enterprise licenses for cost-effective access to the report.
13. Are there any additional resources or data provided in the LCV Market report?
While the report offers comprehensive insights, it's advisable to review the specific contents or supplementary materials provided to ascertain if additional resources or data are available.
14. How can I stay updated on further developments or reports in the LCV Market?
To stay informed about further developments, trends, and reports in the LCV Market, consider subscribing to industry newsletters, following relevant companies and organizations, or regularly checking reputable industry news sources and publications.
Methodology
Step 1 - Identification of Relevant Samples Size from Population Database


Step 2 - Approaches for Defining Global Market Size (Value, Volume* & Price*)

Note*: In applicable scenarios
Step 3 - Data Sources
Primary Research
- Web Analytics
- Survey Reports
- Research Institute
- Latest Research Reports
- Opinion Leaders
Secondary Research
- Annual Reports
- White Paper
- Latest Press Release
- Industry Association
- Paid Database
- Investor Presentations

Step 4 - Data Triangulation
Involves using different sources of information in order to increase the validity of a study
These sources are likely to be stakeholders in a program - participants, other researchers, program staff, other community members, and so on.
Then we put all data in single framework & apply various statistical tools to find out the dynamic on the market.
During the analysis stage, feedback from the stakeholder groups would be compared to determine areas of agreement as well as areas of divergence


