

Key Insights
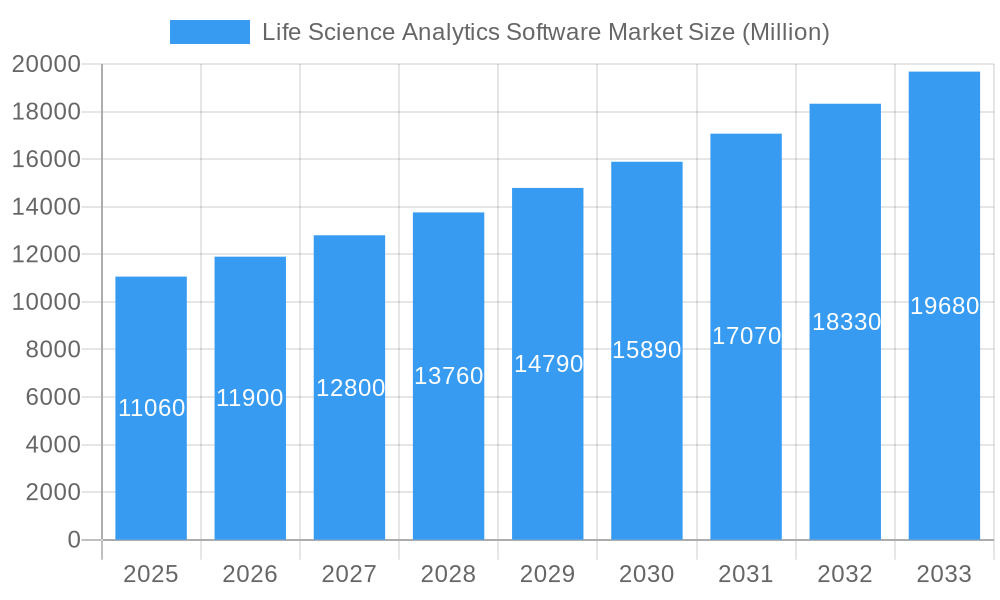
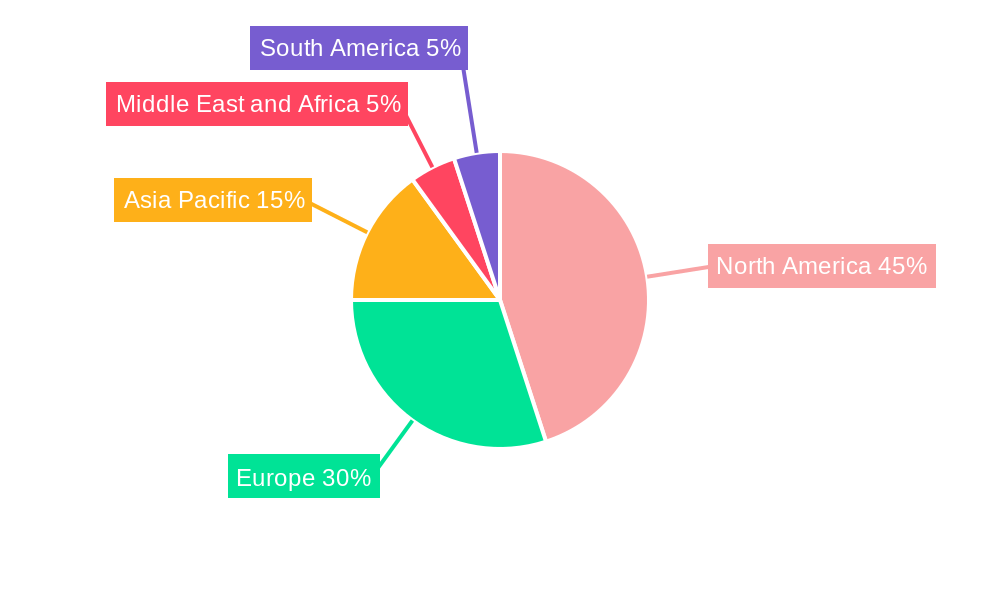
The Life Science Analytics Software market is experiencing robust growth, projected to reach \$11.06 billion in 2025 and maintain a Compound Annual Growth Rate (CAGR) of 7.71% from 2025 to 2033. This expansion is driven by several key factors. The increasing volume of data generated in clinical trials, coupled with the rising need for faster and more efficient drug development, fuels demand for advanced analytics solutions. Pharmaceutical and biotechnology companies are increasingly adopting predictive and prescriptive analytics to optimize drug discovery, clinical trial design, and post-market surveillance, leading to improved outcomes and reduced costs. Furthermore, the growing adoption of cloud-based solutions and the expansion of precision medicine are further catalyzing market growth. The market is segmented by product type (descriptive, predictive, and prescriptive analytics), application (research and development, supply chain analytics, sales and marketing, and other applications), component (services and software), and end-user (clinical research institutions, pharmaceutical and biotechnology companies, medical device companies, and others). North America currently holds a significant market share, driven by robust technological advancements and high adoption rates, followed by Europe and Asia Pacific.
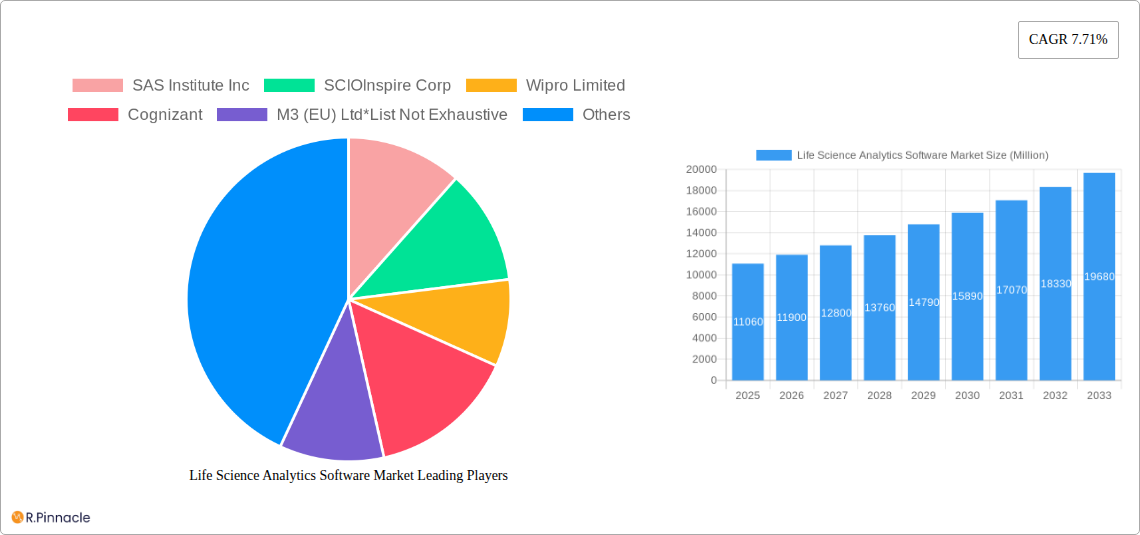
Life Science Analytics Software Market Market Size (In Billion)
The competitive landscape is characterized by a mix of established players like SAS Institute Inc., IBM Corporation, and Oracle Corporation, and emerging specialized companies like SCIOInspire Corp. and M3 (EU) Ltd. The presence of numerous service providers like Wipro Limited, Cognizant, Accenture, and TAKE Solutions indicates a strong service component in the market. Future growth will be influenced by advancements in artificial intelligence (AI), machine learning (ML), and big data technologies, enabling more sophisticated analytics capabilities. Regulatory changes impacting data privacy and security will also play a significant role in shaping market strategies and adoption. The continued focus on personalized medicine and the increasing demand for real-world evidence will further drive market expansion in the coming years. Competition is expected to intensify as players innovate to deliver more comprehensive and integrated solutions.
Life Science Analytics Software Market Company Market Share
Life Science Analytics Software Market: A Comprehensive Report (2019-2033)
This in-depth report provides a comprehensive analysis of the Life Science Analytics Software Market, offering actionable insights for industry professionals. The study period covers 2019-2033, with 2025 as the base and estimated year. The forecast period spans 2025-2033, and the historical period encompasses 2019-2024. The market is projected to reach xx Million by 2033, exhibiting a robust CAGR of xx% during the forecast period. Key players analyzed include SAS Institute Inc, SCIOInspire Corp, Wipro Limited, Cognizant, M3 (EU) Ltd, IBM Corporation, TAKE Solutions Limited, Accenture, IQVIA, Oracle Corporation, MaxisIT Inc, and Dynata (list not exhaustive).
Life Science Analytics Software Market Market Structure & Innovation Trends
The Life Science Analytics Software market is characterized by a dynamic and moderately consolidated structure. A handful of leading players command significant market share, and the competitive landscape is continuously shaped by strategic mergers and acquisitions (M&A). Recent M&A activities have seen deal values ranging from **[Insert Specific Range Here, e.g., $50 Million to $200 Million]**, underscoring a strong industry trend towards consolidation for expanded capabilities and market reach.
- Market Concentration: The top five players are projected to hold an estimated **[Insert Percentage]%** market share by 2025, indicating a concentrated yet competitive environment.
- Innovation Drivers: The forefront of innovation is driven by the relentless advancement of Artificial Intelligence (AI), Machine Learning (ML), and sophisticated Big Data analytics. These technologies are crucial for developing advanced predictive and prescriptive analytics solutions that unlock deeper insights from complex biological data.
- Regulatory Frameworks: Stringent and evolving regulatory compliance requirements, particularly within the pharmaceutical, biotechnology, and healthcare sectors, are pivotal. These regulations not only shape the development of analytics solutions but also mandate their robust validation and secure implementation.
- Product Substitutes: While direct technological substitutes are limited, the market faces indirect competition from traditional statistical software packages and specialized life sciences consulting services that offer analytical expertise.
- End-User Demographics: The primary consumers of life science analytics software are pharmaceutical and biotechnology companies. This is closely followed by Clinical Research Organizations (CROs) and medical device manufacturers, all seeking to optimize their operations and accelerate innovation.
- M&A Activities: Recent M&A trends highlight a strategic push towards vertical integration, aiming to offer end-to-end solutions. There's also a growing interest in expanding into adjacent market segments, including clinical trial management, pharmacovigilance, and regulatory affairs, to provide comprehensive data solutions.
Life Science Analytics Software Market Market Dynamics & Trends
The Life Science Analytics Software market is experiencing robust and accelerated growth. This expansion is primarily propelled by the ever-increasing volume and complexity of biological and clinical data, coupled with an urgent demand for faster drug discovery, development, and commercialization cycles. Technological advancements, especially the widespread adoption of cloud computing and the transformative power of AI/ML, are fundamentally reshaping the market. These technologies are enabling unprecedented scalability, accessibility, and sophisticated analytical capabilities. Concurrently, user preferences are shifting towards integrated, intuitive, and user-friendly solutions that streamline complex data analysis workflows and deliver actionable, real-time insights. The competitive landscape is characterized by intense innovation, with companies focusing on developing differentiated value propositions and leveraging advanced analytics to gain a competitive edge. Market penetration of advanced analytics solutions is rapidly increasing across all segments, with pharmaceutical companies leading this adoption curve. The market is poised for significant expansion, with a projected Compound Annual Growth Rate (CAGR) of **[Insert CAGR Percentage]%** during the forecast period.
Dominant Regions & Segments in Life Science Analytics Software Market
North America currently commands the largest share of the Life Science Analytics Software market. This dominance is attributed to substantial R&D investments, a highly developed pharmaceutical and biotechnology ecosystem, and the early and widespread adoption of cutting-edge analytical technologies. Within market segments, Predictive Analytics is emerging as the fastest-growing area, closely followed by Prescriptive Analytics. This surge is driven by the escalating need for proactive decision-making, risk mitigation, and operational optimization across the entire life sciences value chain.
- Key Drivers (North America): Significant R&D expenditures, high adoption rates of advanced technologies, and a mature, innovation-driven pharmaceutical industry.
- Key Drivers (Europe): Stringent yet progressive regulatory frameworks that increasingly emphasize and promote data-driven decision-making and evidence-based research.
- Dominant Product Type: Predictive Analytics holds a dominant position due to the growing emphasis on proactive risk management, disease forecasting, and patient outcome prediction.
- Dominant Application: Research & Development (R&D) remains the most significant application area as organizations prioritize accelerating the drug discovery and development pipeline through enhanced data analysis.
- Dominant Component: Software is the dominant component, offering unparalleled scalability, accessibility, and the ability to integrate with diverse data sources and existing infrastructure.
- Dominant End-User: Pharmaceutical & Biotechnology Companies continue to be the dominant end-users, investing heavily in R&D and requiring sophisticated data analytics to derive actionable insights.
Life Science Analytics Software Market Product Innovations
Recent product innovations are primarily focused on the deep integration of advanced AI and ML algorithms into existing analytics platforms. This integration significantly enhances predictive capabilities, leading to more nuanced and actionable insights. A strong emphasis is also placed on developing intuitive, user-friendly interfaces that simplify complex data analysis tasks. Furthermore, innovations are geared towards automated data processing pipelines and seamless interoperability with a broad spectrum of other life science tools and systems. These advancements collectively contribute to improved operational efficiency, faster decision-making cycles, and a more robust market fit for the solutions.
Report Scope & Segmentation Analysis
This report provides a detailed segmentation of the Life Science Analytics Software Market across several key parameters.
- Product Type: Descriptive, Predictive, and Prescriptive Analytics, each with distinct growth projections and competitive dynamics. Predictive analytics is projected to be the fastest-growing segment.
- Application: Research & Development, Supply Chain Analytics, Sales & Marketing, and Other Applications— each segment reveals specific industry challenges and opportunities.
- Component: Software and Services— both components are crucial for a complete analytical solution.
- End User: Clinical Research Institutions, Pharmaceutical & Biotechnology Companies, Medical Device Companies, and Other End Users. Pharmaceutical and Biotechnology companies dominate the market due to their higher investment in R&D.
Key Drivers of Life Science Analytics Software Market Growth
The sustained growth of the Life Science Analytics Software market is propelled by several critical factors. Foremost among these are escalating R&D investments within the life sciences sector, the widespread and increasing adoption of flexible and scalable cloud-based analytics solutions, and the imperative driven by regulatory bodies for data-driven decision-making and robust evidence generation. Continuous advancements in AI and ML are instrumental in refining the accuracy, efficiency, and predictive power of analytical tools, thereby further accelerating market expansion. The overarching and persistent need to expedite drug discovery, development, and to optimize clinical trial outcomes significantly contributes to the robust growth trajectory of this market.
Challenges in the Life Science Analytics Software Market Sector
Key challenges include the complexity of integrating diverse data sources, the high cost of implementing advanced analytics solutions, and the need for skilled data scientists and analysts. Data security and privacy concerns also pose significant challenges, particularly with the increasing use of sensitive patient data. The market's competitive intensity further complicates the growth trajectory.
Emerging Opportunities in Life Science Analytics Software Market
Emerging opportunities lie in the development of specialized solutions for specific therapeutic areas, personalized medicine, and real-world evidence generation. The integration of advanced analytics with wearable devices and other connected health technologies presents significant growth potential. Expansion into emerging markets also offers exciting opportunities.
Leading Players in the Life Science Analytics Software Market Market
- SAS Institute Inc
- SCIOInspire Corp
- Wipro Limited
- Cognizant
- M3 (EU) Ltd
- IBM Corporation
- TAKE Solutions Limited
- Accenture
- IQVIA
- Oracle Corporation
- MaxisIT Inc
- Dynata
Key Developments in Life Science Analytics Software Market Industry
- July 2022: Charles River Associates launched the Healthcare Claims Analytics Platform (HCAP), leveraging machine learning and patient analytics.
- March 2022: Databricks launched the Databricks Lakehouse for Healthcare and Life Sciences, a unified platform for data management, analytics, and AI applications.
Future Outlook for Life Science Analytics Software Market Market
The Life Science Analytics Software market is poised for continued robust growth, driven by sustained investment in R&D, technological advancements, and increasing demand for data-driven insights. Strategic partnerships, acquisitions, and the development of innovative solutions will further shape the market landscape, creating significant opportunities for growth and innovation in the coming years.
Life Science Analytics Software Market Segmentation
-
1. Product Type
- 1.1. Descriptive Analytics
- 1.2. Predictive Analytics
- 1.3. Prescriptive Analytics
-
2. Application
- 2.1. Research and Development
- 2.2. Supply Chain Analytics
- 2.3. Sales and Marketing
- 2.4. Other Applications
-
3. Component
- 3.1. Services
- 3.2. Software
-
4. End User
- 4.1. Clinical Research Institutions
- 4.2. Pharmaceutical and Biotechnology Companies
- 4.3. Medical Device Companies
- 4.4. Other End Users
Life Science Analytics Software Market Segmentation By Geography
-
1. North America
- 1.1. United States
- 1.2. Canada
- 1.3. Mexico
-
2. Europe
- 2.1. Germany
- 2.2. United Kingdom
- 2.3. France
- 2.4. Italy
- 2.5. Spain
- 2.6. Rest of Europe
-
3. Asia Pacific
- 3.1. China
- 3.2. Japan
- 3.3. India
- 3.4. Australia
- 3.5. South Korea
- 3.6. Rest of Asia Pacific
-
4. Middle East and Africa
- 4.1. GCC
- 4.2. South Africa
- 4.3. Rest of Middle East and Africa
-
5. South America
- 5.1. Brazil
- 5.2. Argentina
- 5.3. Rest of South America
Life Science Analytics Software Market Regional Market Share
Geographic Coverage of Life Science Analytics Software Market
Life Science Analytics Software Market REPORT HIGHLIGHTS
| Aspects | Details |
|---|---|
| Study Period | 2020-2034 |
| Base Year | 2025 |
| Estimated Year | 2026 |
| Forecast Period | 2026-2034 |
| Historical Period | 2020-2025 |
| Growth Rate | CAGR of 7.71% from 2020-2034 |
| Segmentation |
|
Table of Contents
- 1. Introduction
- 1.1. Research Scope
- 1.2. Market Segmentation
- 1.3. Research Objective
- 1.4. Definitions and Assumptions
- 2. Executive Summary
- 2.1. Market Snapshot
- 3. Market Dynamics
- 3.1. Market Drivers
- 3.2. Market Restrains
- 3.3. Market Trends
- 3.4. Market Opportunities
- 4. Market Factor Analysis
- 4.1. Porters Five Forces
- 4.1.1. Bargaining Power of Suppliers
- 4.1.2. Bargaining Power of Buyers
- 4.1.3. Threat of New Entrants
- 4.1.4. Threat of Substitutes
- 4.1.5. Competitive Rivalry
- 4.2. PESTEL analysis
- 4.3. BCG Analysis
- 4.3.1. Stars (High Growth, High Market Share)
- 4.3.2. Cash Cows (Low Growth, High Market Share)
- 4.3.3. Question Mark (High Growth, Low Market Share)
- 4.3.4. Dogs (Low Growth, Low Market Share)
- 4.4. Ansoff Matrix Analysis
- 4.5. Supply Chain Analysis
- 4.6. Regulatory Landscape
- 4.7. Current Market Potential and Opportunity Assessment (TAM–SAM–SOM Framework)
- 4.8. PRI Analyst Note
- 4.1. Porters Five Forces
- 5. Market Analysis, Insights and Forecast 2021-2033
- 5.1. Market Analysis, Insights and Forecast - by Product Type
- 5.1.1. Descriptive Analytics
- 5.1.2. Predictive Analytics
- 5.1.3. Prescriptive Analytics
- 5.2. Market Analysis, Insights and Forecast - by Application
- 5.2.1. Research and Development
- 5.2.2. Supply Chain Analytics
- 5.2.3. Sales and Marketing
- 5.2.4. Other Applications
- 5.3. Market Analysis, Insights and Forecast - by Component
- 5.3.1. Services
- 5.3.2. Software
- 5.4. Market Analysis, Insights and Forecast - by End User
- 5.4.1. Clinical Research Institutions
- 5.4.2. Pharmaceutical and Biotechnology Companies
- 5.4.3. Medical Device Companies
- 5.4.4. Other End Users
- 5.5. Market Analysis, Insights and Forecast - by Region
- 5.5.1. North America
- 5.5.2. Europe
- 5.5.3. Asia Pacific
- 5.5.4. Middle East and Africa
- 5.5.5. South America
- 5.1. Market Analysis, Insights and Forecast - by Product Type
- 6. Global Life Science Analytics Software Market Analysis, Insights and Forecast, 2021-2033
- 6.1. Market Analysis, Insights and Forecast - by Product Type
- 6.1.1. Descriptive Analytics
- 6.1.2. Predictive Analytics
- 6.1.3. Prescriptive Analytics
- 6.2. Market Analysis, Insights and Forecast - by Application
- 6.2.1. Research and Development
- 6.2.2. Supply Chain Analytics
- 6.2.3. Sales and Marketing
- 6.2.4. Other Applications
- 6.3. Market Analysis, Insights and Forecast - by Component
- 6.3.1. Services
- 6.3.2. Software
- 6.4. Market Analysis, Insights and Forecast - by End User
- 6.4.1. Clinical Research Institutions
- 6.4.2. Pharmaceutical and Biotechnology Companies
- 6.4.3. Medical Device Companies
- 6.4.4. Other End Users
- 6.1. Market Analysis, Insights and Forecast - by Product Type
- 7. North America Life Science Analytics Software Market Analysis, Insights and Forecast, 2020-2032
- 7.1. Market Analysis, Insights and Forecast - by Product Type
- 7.1.1. Descriptive Analytics
- 7.1.2. Predictive Analytics
- 7.1.3. Prescriptive Analytics
- 7.2. Market Analysis, Insights and Forecast - by Application
- 7.2.1. Research and Development
- 7.2.2. Supply Chain Analytics
- 7.2.3. Sales and Marketing
- 7.2.4. Other Applications
- 7.3. Market Analysis, Insights and Forecast - by Component
- 7.3.1. Services
- 7.3.2. Software
- 7.4. Market Analysis, Insights and Forecast - by End User
- 7.4.1. Clinical Research Institutions
- 7.4.2. Pharmaceutical and Biotechnology Companies
- 7.4.3. Medical Device Companies
- 7.4.4. Other End Users
- 7.1. Market Analysis, Insights and Forecast - by Product Type
- 8. Europe Life Science Analytics Software Market Analysis, Insights and Forecast, 2020-2032
- 8.1. Market Analysis, Insights and Forecast - by Product Type
- 8.1.1. Descriptive Analytics
- 8.1.2. Predictive Analytics
- 8.1.3. Prescriptive Analytics
- 8.2. Market Analysis, Insights and Forecast - by Application
- 8.2.1. Research and Development
- 8.2.2. Supply Chain Analytics
- 8.2.3. Sales and Marketing
- 8.2.4. Other Applications
- 8.3. Market Analysis, Insights and Forecast - by Component
- 8.3.1. Services
- 8.3.2. Software
- 8.4. Market Analysis, Insights and Forecast - by End User
- 8.4.1. Clinical Research Institutions
- 8.4.2. Pharmaceutical and Biotechnology Companies
- 8.4.3. Medical Device Companies
- 8.4.4. Other End Users
- 8.1. Market Analysis, Insights and Forecast - by Product Type
- 9. Asia Pacific Life Science Analytics Software Market Analysis, Insights and Forecast, 2020-2032
- 9.1. Market Analysis, Insights and Forecast - by Product Type
- 9.1.1. Descriptive Analytics
- 9.1.2. Predictive Analytics
- 9.1.3. Prescriptive Analytics
- 9.2. Market Analysis, Insights and Forecast - by Application
- 9.2.1. Research and Development
- 9.2.2. Supply Chain Analytics
- 9.2.3. Sales and Marketing
- 9.2.4. Other Applications
- 9.3. Market Analysis, Insights and Forecast - by Component
- 9.3.1. Services
- 9.3.2. Software
- 9.4. Market Analysis, Insights and Forecast - by End User
- 9.4.1. Clinical Research Institutions
- 9.4.2. Pharmaceutical and Biotechnology Companies
- 9.4.3. Medical Device Companies
- 9.4.4. Other End Users
- 9.1. Market Analysis, Insights and Forecast - by Product Type
- 10. Middle East and Africa Life Science Analytics Software Market Analysis, Insights and Forecast, 2020-2032
- 10.1. Market Analysis, Insights and Forecast - by Product Type
- 10.1.1. Descriptive Analytics
- 10.1.2. Predictive Analytics
- 10.1.3. Prescriptive Analytics
- 10.2. Market Analysis, Insights and Forecast - by Application
- 10.2.1. Research and Development
- 10.2.2. Supply Chain Analytics
- 10.2.3. Sales and Marketing
- 10.2.4. Other Applications
- 10.3. Market Analysis, Insights and Forecast - by Component
- 10.3.1. Services
- 10.3.2. Software
- 10.4. Market Analysis, Insights and Forecast - by End User
- 10.4.1. Clinical Research Institutions
- 10.4.2. Pharmaceutical and Biotechnology Companies
- 10.4.3. Medical Device Companies
- 10.4.4. Other End Users
- 10.1. Market Analysis, Insights and Forecast - by Product Type
- 11. South America Life Science Analytics Software Market Analysis, Insights and Forecast, 2020-2032
- 11.1. Market Analysis, Insights and Forecast - by Product Type
- 11.1.1. Descriptive Analytics
- 11.1.2. Predictive Analytics
- 11.1.3. Prescriptive Analytics
- 11.2. Market Analysis, Insights and Forecast - by Application
- 11.2.1. Research and Development
- 11.2.2. Supply Chain Analytics
- 11.2.3. Sales and Marketing
- 11.2.4. Other Applications
- 11.3. Market Analysis, Insights and Forecast - by Component
- 11.3.1. Services
- 11.3.2. Software
- 11.4. Market Analysis, Insights and Forecast - by End User
- 11.4.1. Clinical Research Institutions
- 11.4.2. Pharmaceutical and Biotechnology Companies
- 11.4.3. Medical Device Companies
- 11.4.4. Other End Users
- 11.1. Market Analysis, Insights and Forecast - by Product Type
- 12. Competitive Analysis
- 12.1. Company Profiles
- 12.1.1 SAS Institute Inc
- 12.1.1.1. Company Overview
- 12.1.1.2. Products
- 12.1.1.3. Company Financials
- 12.1.1.4. SWOT Analysis
- 12.1.2 SCIOInspire Corp
- 12.1.2.1. Company Overview
- 12.1.2.2. Products
- 12.1.2.3. Company Financials
- 12.1.2.4. SWOT Analysis
- 12.1.3 Wipro Limited
- 12.1.3.1. Company Overview
- 12.1.3.2. Products
- 12.1.3.3. Company Financials
- 12.1.3.4. SWOT Analysis
- 12.1.4 Cognizant
- 12.1.4.1. Company Overview
- 12.1.4.2. Products
- 12.1.4.3. Company Financials
- 12.1.4.4. SWOT Analysis
- 12.1.5 M3 (EU) Ltd*List Not Exhaustive
- 12.1.5.1. Company Overview
- 12.1.5.2. Products
- 12.1.5.3. Company Financials
- 12.1.5.4. SWOT Analysis
- 12.1.6 IBM Corporation
- 12.1.6.1. Company Overview
- 12.1.6.2. Products
- 12.1.6.3. Company Financials
- 12.1.6.4. SWOT Analysis
- 12.1.7 TAKE Solutions Limited
- 12.1.7.1. Company Overview
- 12.1.7.2. Products
- 12.1.7.3. Company Financials
- 12.1.7.4. SWOT Analysis
- 12.1.8 Accenture
- 12.1.8.1. Company Overview
- 12.1.8.2. Products
- 12.1.8.3. Company Financials
- 12.1.8.4. SWOT Analysis
- 12.1.9 IQVIA
- 12.1.9.1. Company Overview
- 12.1.9.2. Products
- 12.1.9.3. Company Financials
- 12.1.9.4. SWOT Analysis
- 12.1.10 Oracle Corporation
- 12.1.10.1. Company Overview
- 12.1.10.2. Products
- 12.1.10.3. Company Financials
- 12.1.10.4. SWOT Analysis
- 12.1.11 MaxisIT Inc
- 12.1.11.1. Company Overview
- 12.1.11.2. Products
- 12.1.11.3. Company Financials
- 12.1.11.4. SWOT Analysis
- 12.1.12 Dynata
- 12.1.12.1. Company Overview
- 12.1.12.2. Products
- 12.1.12.3. Company Financials
- 12.1.12.4. SWOT Analysis
- 12.1.1 SAS Institute Inc
- 12.2. Market Entropy
- 12.2.1 Company's Key Areas Served
- 12.2.2 Recent Developments
- 12.3. Company Market Share Analysis 2025
- 12.3.1 Top 5 Companies Market Share Analysis
- 12.3.2 Top 3 Companies Market Share Analysis
- 12.4. List of Potential Customers
- 13. Research Methodology
List of Figures
- Figure 1: Global Life Science Analytics Software Market Revenue Breakdown (Million, %) by Region 2025 & 2033
- Figure 2: North America Life Science Analytics Software Market Revenue (Million), by Product Type 2025 & 2033
- Figure 3: North America Life Science Analytics Software Market Revenue Share (%), by Product Type 2025 & 2033
- Figure 4: North America Life Science Analytics Software Market Revenue (Million), by Application 2025 & 2033
- Figure 5: North America Life Science Analytics Software Market Revenue Share (%), by Application 2025 & 2033
- Figure 6: North America Life Science Analytics Software Market Revenue (Million), by Component 2025 & 2033
- Figure 7: North America Life Science Analytics Software Market Revenue Share (%), by Component 2025 & 2033
- Figure 8: North America Life Science Analytics Software Market Revenue (Million), by End User 2025 & 2033
- Figure 9: North America Life Science Analytics Software Market Revenue Share (%), by End User 2025 & 2033
- Figure 10: North America Life Science Analytics Software Market Revenue (Million), by Country 2025 & 2033
- Figure 11: North America Life Science Analytics Software Market Revenue Share (%), by Country 2025 & 2033
- Figure 12: Europe Life Science Analytics Software Market Revenue (Million), by Product Type 2025 & 2033
- Figure 13: Europe Life Science Analytics Software Market Revenue Share (%), by Product Type 2025 & 2033
- Figure 14: Europe Life Science Analytics Software Market Revenue (Million), by Application 2025 & 2033
- Figure 15: Europe Life Science Analytics Software Market Revenue Share (%), by Application 2025 & 2033
- Figure 16: Europe Life Science Analytics Software Market Revenue (Million), by Component 2025 & 2033
- Figure 17: Europe Life Science Analytics Software Market Revenue Share (%), by Component 2025 & 2033
- Figure 18: Europe Life Science Analytics Software Market Revenue (Million), by End User 2025 & 2033
- Figure 19: Europe Life Science Analytics Software Market Revenue Share (%), by End User 2025 & 2033
- Figure 20: Europe Life Science Analytics Software Market Revenue (Million), by Country 2025 & 2033
- Figure 21: Europe Life Science Analytics Software Market Revenue Share (%), by Country 2025 & 2033
- Figure 22: Asia Pacific Life Science Analytics Software Market Revenue (Million), by Product Type 2025 & 2033
- Figure 23: Asia Pacific Life Science Analytics Software Market Revenue Share (%), by Product Type 2025 & 2033
- Figure 24: Asia Pacific Life Science Analytics Software Market Revenue (Million), by Application 2025 & 2033
- Figure 25: Asia Pacific Life Science Analytics Software Market Revenue Share (%), by Application 2025 & 2033
- Figure 26: Asia Pacific Life Science Analytics Software Market Revenue (Million), by Component 2025 & 2033
- Figure 27: Asia Pacific Life Science Analytics Software Market Revenue Share (%), by Component 2025 & 2033
- Figure 28: Asia Pacific Life Science Analytics Software Market Revenue (Million), by End User 2025 & 2033
- Figure 29: Asia Pacific Life Science Analytics Software Market Revenue Share (%), by End User 2025 & 2033
- Figure 30: Asia Pacific Life Science Analytics Software Market Revenue (Million), by Country 2025 & 2033
- Figure 31: Asia Pacific Life Science Analytics Software Market Revenue Share (%), by Country 2025 & 2033
- Figure 32: Middle East and Africa Life Science Analytics Software Market Revenue (Million), by Product Type 2025 & 2033
- Figure 33: Middle East and Africa Life Science Analytics Software Market Revenue Share (%), by Product Type 2025 & 2033
- Figure 34: Middle East and Africa Life Science Analytics Software Market Revenue (Million), by Application 2025 & 2033
- Figure 35: Middle East and Africa Life Science Analytics Software Market Revenue Share (%), by Application 2025 & 2033
- Figure 36: Middle East and Africa Life Science Analytics Software Market Revenue (Million), by Component 2025 & 2033
- Figure 37: Middle East and Africa Life Science Analytics Software Market Revenue Share (%), by Component 2025 & 2033
- Figure 38: Middle East and Africa Life Science Analytics Software Market Revenue (Million), by End User 2025 & 2033
- Figure 39: Middle East and Africa Life Science Analytics Software Market Revenue Share (%), by End User 2025 & 2033
- Figure 40: Middle East and Africa Life Science Analytics Software Market Revenue (Million), by Country 2025 & 2033
- Figure 41: Middle East and Africa Life Science Analytics Software Market Revenue Share (%), by Country 2025 & 2033
- Figure 42: South America Life Science Analytics Software Market Revenue (Million), by Product Type 2025 & 2033
- Figure 43: South America Life Science Analytics Software Market Revenue Share (%), by Product Type 2025 & 2033
- Figure 44: South America Life Science Analytics Software Market Revenue (Million), by Application 2025 & 2033
- Figure 45: South America Life Science Analytics Software Market Revenue Share (%), by Application 2025 & 2033
- Figure 46: South America Life Science Analytics Software Market Revenue (Million), by Component 2025 & 2033
- Figure 47: South America Life Science Analytics Software Market Revenue Share (%), by Component 2025 & 2033
- Figure 48: South America Life Science Analytics Software Market Revenue (Million), by End User 2025 & 2033
- Figure 49: South America Life Science Analytics Software Market Revenue Share (%), by End User 2025 & 2033
- Figure 50: South America Life Science Analytics Software Market Revenue (Million), by Country 2025 & 2033
- Figure 51: South America Life Science Analytics Software Market Revenue Share (%), by Country 2025 & 2033
List of Tables
- Table 1: Global Life Science Analytics Software Market Revenue Million Forecast, by Product Type 2020 & 2033
- Table 2: Global Life Science Analytics Software Market Revenue Million Forecast, by Application 2020 & 2033
- Table 3: Global Life Science Analytics Software Market Revenue Million Forecast, by Component 2020 & 2033
- Table 4: Global Life Science Analytics Software Market Revenue Million Forecast, by End User 2020 & 2033
- Table 5: Global Life Science Analytics Software Market Revenue Million Forecast, by Region 2020 & 2033
- Table 6: Global Life Science Analytics Software Market Revenue Million Forecast, by Product Type 2020 & 2033
- Table 7: Global Life Science Analytics Software Market Revenue Million Forecast, by Application 2020 & 2033
- Table 8: Global Life Science Analytics Software Market Revenue Million Forecast, by Component 2020 & 2033
- Table 9: Global Life Science Analytics Software Market Revenue Million Forecast, by End User 2020 & 2033
- Table 10: Global Life Science Analytics Software Market Revenue Million Forecast, by Country 2020 & 2033
- Table 11: United States Life Science Analytics Software Market Revenue (Million) Forecast, by Application 2020 & 2033
- Table 12: Canada Life Science Analytics Software Market Revenue (Million) Forecast, by Application 2020 & 2033
- Table 13: Mexico Life Science Analytics Software Market Revenue (Million) Forecast, by Application 2020 & 2033
- Table 14: Global Life Science Analytics Software Market Revenue Million Forecast, by Product Type 2020 & 2033
- Table 15: Global Life Science Analytics Software Market Revenue Million Forecast, by Application 2020 & 2033
- Table 16: Global Life Science Analytics Software Market Revenue Million Forecast, by Component 2020 & 2033
- Table 17: Global Life Science Analytics Software Market Revenue Million Forecast, by End User 2020 & 2033
- Table 18: Global Life Science Analytics Software Market Revenue Million Forecast, by Country 2020 & 2033
- Table 19: Germany Life Science Analytics Software Market Revenue (Million) Forecast, by Application 2020 & 2033
- Table 20: United Kingdom Life Science Analytics Software Market Revenue (Million) Forecast, by Application 2020 & 2033
- Table 21: France Life Science Analytics Software Market Revenue (Million) Forecast, by Application 2020 & 2033
- Table 22: Italy Life Science Analytics Software Market Revenue (Million) Forecast, by Application 2020 & 2033
- Table 23: Spain Life Science Analytics Software Market Revenue (Million) Forecast, by Application 2020 & 2033
- Table 24: Rest of Europe Life Science Analytics Software Market Revenue (Million) Forecast, by Application 2020 & 2033
- Table 25: Global Life Science Analytics Software Market Revenue Million Forecast, by Product Type 2020 & 2033
- Table 26: Global Life Science Analytics Software Market Revenue Million Forecast, by Application 2020 & 2033
- Table 27: Global Life Science Analytics Software Market Revenue Million Forecast, by Component 2020 & 2033
- Table 28: Global Life Science Analytics Software Market Revenue Million Forecast, by End User 2020 & 2033
- Table 29: Global Life Science Analytics Software Market Revenue Million Forecast, by Country 2020 & 2033
- Table 30: China Life Science Analytics Software Market Revenue (Million) Forecast, by Application 2020 & 2033
- Table 31: Japan Life Science Analytics Software Market Revenue (Million) Forecast, by Application 2020 & 2033
- Table 32: India Life Science Analytics Software Market Revenue (Million) Forecast, by Application 2020 & 2033
- Table 33: Australia Life Science Analytics Software Market Revenue (Million) Forecast, by Application 2020 & 2033
- Table 34: South Korea Life Science Analytics Software Market Revenue (Million) Forecast, by Application 2020 & 2033
- Table 35: Rest of Asia Pacific Life Science Analytics Software Market Revenue (Million) Forecast, by Application 2020 & 2033
- Table 36: Global Life Science Analytics Software Market Revenue Million Forecast, by Product Type 2020 & 2033
- Table 37: Global Life Science Analytics Software Market Revenue Million Forecast, by Application 2020 & 2033
- Table 38: Global Life Science Analytics Software Market Revenue Million Forecast, by Component 2020 & 2033
- Table 39: Global Life Science Analytics Software Market Revenue Million Forecast, by End User 2020 & 2033
- Table 40: Global Life Science Analytics Software Market Revenue Million Forecast, by Country 2020 & 2033
- Table 41: GCC Life Science Analytics Software Market Revenue (Million) Forecast, by Application 2020 & 2033
- Table 42: South Africa Life Science Analytics Software Market Revenue (Million) Forecast, by Application 2020 & 2033
- Table 43: Rest of Middle East and Africa Life Science Analytics Software Market Revenue (Million) Forecast, by Application 2020 & 2033
- Table 44: Global Life Science Analytics Software Market Revenue Million Forecast, by Product Type 2020 & 2033
- Table 45: Global Life Science Analytics Software Market Revenue Million Forecast, by Application 2020 & 2033
- Table 46: Global Life Science Analytics Software Market Revenue Million Forecast, by Component 2020 & 2033
- Table 47: Global Life Science Analytics Software Market Revenue Million Forecast, by End User 2020 & 2033
- Table 48: Global Life Science Analytics Software Market Revenue Million Forecast, by Country 2020 & 2033
- Table 49: Brazil Life Science Analytics Software Market Revenue (Million) Forecast, by Application 2020 & 2033
- Table 50: Argentina Life Science Analytics Software Market Revenue (Million) Forecast, by Application 2020 & 2033
- Table 51: Rest of South America Life Science Analytics Software Market Revenue (Million) Forecast, by Application 2020 & 2033
Frequently Asked Questions
1. What is the projected Compound Annual Growth Rate (CAGR) of the Life Science Analytics Software Market?
The projected CAGR is approximately 7.71%.
2. Which companies are prominent players in the Life Science Analytics Software Market?
Key companies in the market include SAS Institute Inc, SCIOInspire Corp, Wipro Limited, Cognizant, M3 (EU) Ltd*List Not Exhaustive, IBM Corporation, TAKE Solutions Limited, Accenture, IQVIA, Oracle Corporation, MaxisIT Inc, Dynata.
3. What are the main segments of the Life Science Analytics Software Market?
The market segments include Product Type, Application, Component, End User.
4. Can you provide details about the market size?
The market size is estimated to be USD 11.06 Million as of 2022.
5. What are some drivers contributing to market growth?
Rising Adoption of Analytics Solutions in Pharmaceuticals and Clinical Trials; Growing Pressure to Reduce Healthcare Spending and the Need for Improved Patient Outcomes; Emergence of Advanced Analytics Method in Life Science Companies.
6. What are the notable trends driving market growth?
Pharmaceutical and Biotechnology Companies are Expected to Witness the Rapid Growth in Coming Years.
7. Are there any restraints impacting market growth?
Lack of Skilled Personnel; High Implementation Costs.
8. Can you provide examples of recent developments in the market?
July 2022: Charles River Associates launched the company's new data analytics suite, the Healthcare Claims Analytics Platform (HCAP), at the World Orphan Drug Congress USA 2022 in Boston. HCAP delivers the power of machine learning and patient analytics to inform about market understanding and support intelligent decision-making.
9. What pricing options are available for accessing the report?
Pricing options include single-user, multi-user, and enterprise licenses priced at USD 4750, USD 5250, and USD 8750 respectively.
10. Is the market size provided in terms of value or volume?
The market size is provided in terms of value, measured in Million.
11. Are there any specific market keywords associated with the report?
Yes, the market keyword associated with the report is "Life Science Analytics Software Market," which aids in identifying and referencing the specific market segment covered.
12. How do I determine which pricing option suits my needs best?
The pricing options vary based on user requirements and access needs. Individual users may opt for single-user licenses, while businesses requiring broader access may choose multi-user or enterprise licenses for cost-effective access to the report.
13. Are there any additional resources or data provided in the Life Science Analytics Software Market report?
While the report offers comprehensive insights, it's advisable to review the specific contents or supplementary materials provided to ascertain if additional resources or data are available.
14. How can I stay updated on further developments or reports in the Life Science Analytics Software Market?
To stay informed about further developments, trends, and reports in the Life Science Analytics Software Market, consider subscribing to industry newsletters, following relevant companies and organizations, or regularly checking reputable industry news sources and publications.
Methodology
Step 1 - Identification of Relevant Samples Size from Population Database


Step 2 - Approaches for Defining Global Market Size (Value, Volume* & Price*)

Note*: In applicable scenarios
Step 3 - Data Sources
Primary Research
- Web Analytics
- Survey Reports
- Research Institute
- Latest Research Reports
- Opinion Leaders
Secondary Research
- Annual Reports
- White Paper
- Latest Press Release
- Industry Association
- Paid Database
- Investor Presentations

Step 4 - Data Triangulation
Involves using different sources of information in order to increase the validity of a study
These sources are likely to be stakeholders in a program - participants, other researchers, program staff, other community members, and so on.
Then we put all data in single framework & apply various statistical tools to find out the dynamic on the market.
During the analysis stage, feedback from the stakeholder groups would be compared to determine areas of agreement as well as areas of divergence