

Key Insights
The Lighting as a Service (LaaS) market is poised for significant expansion, driven by escalating demand for energy-efficient and intelligent lighting across commercial, industrial, and outdoor environments. With a projected Compound Annual Growth Rate (CAGR) of 34.8%, the market is expected to reach $3.5 billion by 2025. Key growth catalysts include the widespread adoption of LED technology, which substantially lowers energy consumption and operational expenses, making LaaS a financially advantageous choice for organizations. The integration of smart features, such as remote monitoring, control, and predictive maintenance, further enhances operational efficiency and minimizes downtime. This is particularly evident in commercial buildings focused on optimizing energy management and improving occupant well-being. Additionally, growing environmental consciousness and corporate social responsibility commitments are accelerating the uptake of sustainable lighting solutions like those offered by LaaS models. The accessibility of LaaS, with its reduced upfront capital investment, presents a compelling alternative to conventional lighting procurement, especially for small and medium-sized enterprises.
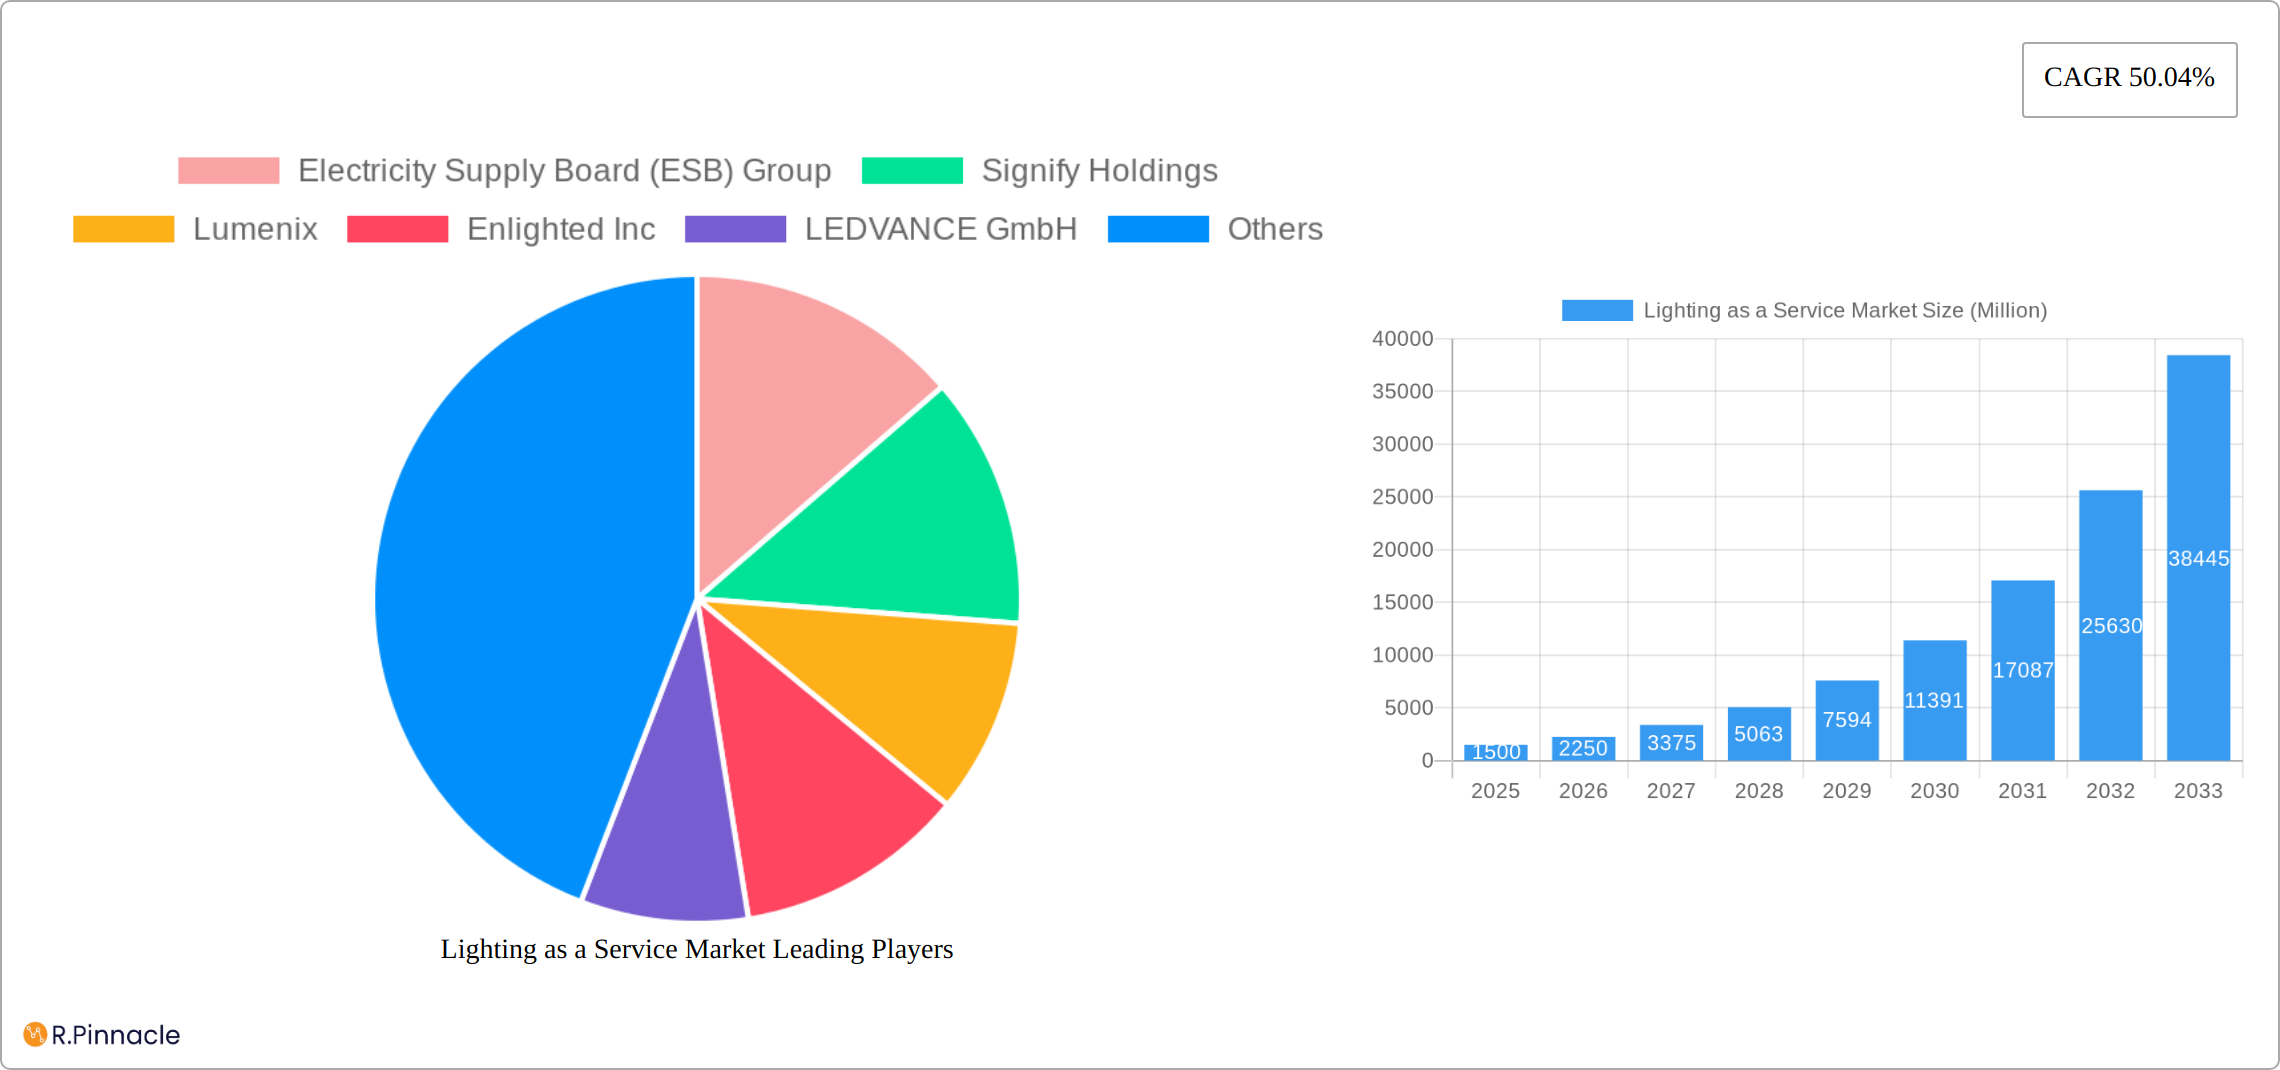
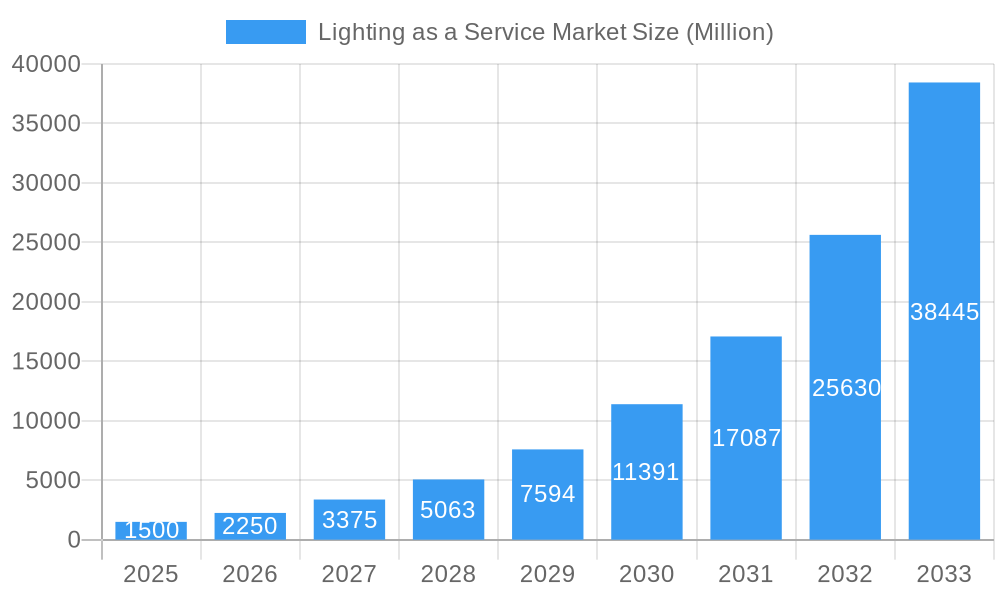
Lighting as a Service Market Market Size (In Billion)
While the market demonstrates robust growth, certain challenges persist. The substantial initial investment required by LaaS providers for infrastructure and service agreements can pose an entry barrier. Competition from established lighting manufacturers offering traditional sales models also remains a factor. Furthermore, the efficacy of LaaS relies heavily on dependable service delivery and strong client relationships, necessitating significant investment in customer support and technical expertise. However, the long-term financial benefits and advanced functionalities provided by LaaS are anticipated to surmount these obstacles, ensuring sustained market growth. Segmentation by end-user (commercial, outdoor, industrial) underscores the broad applicability and growth potential across diverse sectors, with commercial buildings expected to lead due to higher adoption rates and greater investment in smart building technologies. Leading entities such as ESB Group, Signify Holdings, and General Electric are strategically positioned to leverage this expanding market opportunity.
Lighting as a Service Market Company Market Share
Lighting as a Service (LaaS) Market Report: 2019-2033 Forecast
This comprehensive report provides an in-depth analysis of the Lighting as a Service (LaaS) market, offering invaluable insights for industry professionals, investors, and strategic decision-makers. Covering the period from 2019 to 2033, with a focus on 2025, this report unveils the market's structure, dynamics, and future potential. The study incorporates detailed segmentation analysis, competitive landscape assessments, and growth projections, enabling informed business strategies. The report’s findings are supported by rigorous data analysis, industry expert interviews, and comprehensive market research.
Lighting as a Service Market Market Structure & Innovation Trends
The LaaS market exhibits a moderately concentrated structure, with key players like Electricity Supply Board (ESB) Group, Signify Holdings, Lumenix, Enlighted Inc, LEDVANCE GmbH, Lighthouse, Stouch Lighting, Every Watt Matters, General Electric Company, and LumenServe Inc. competing for market share. The estimated combined market share of the top five players in 2025 is xx%. Innovation is driven by advancements in LED technology, IoT integration, and data analytics, enabling energy-efficient and smart lighting solutions. Regulatory frameworks promoting energy conservation and sustainable practices are also significant drivers. Product substitutes include traditional lighting systems, but LaaS's operational efficiency and cost-effectiveness are proving increasingly attractive. Recent M&A activities, with an estimated total deal value of $xx Million in 2024, indicate increasing consolidation within the market. End-user demographics are shifting towards businesses prioritizing energy savings and operational efficiency.
- Market concentration: Moderately concentrated
- Top 5 players’ market share (2025): xx%
- M&A deal value (2024): $xx Million
- Key innovation drivers: LED technology, IoT, data analytics, energy efficiency regulations
Lighting as a Service Market Market Dynamics & Trends
The Lighting as a Service (LaaS) market is experiencing robust growth, fueled by the increasing demand for energy-efficient and intelligent lighting solutions. This surge is driven by several key factors: a global push towards sustainability, advancements in LED technology and IoT integration, and the compelling value proposition of reduced operational costs. The market is undergoing significant transformation with the integration of artificial intelligence (AI) and machine learning (ML), enabling advanced control, automation, and predictive maintenance capabilities. Consumer preferences are shifting decisively towards smart lighting systems offering superior energy efficiency, enhanced user experiences, and remote management features. The competitive landscape is dynamic, with established players and innovative entrants vying for market share through technological advancements and strategic pricing. This competition fosters continuous improvement and innovation within the sector. The Compound Annual Growth Rate (CAGR) is projected to be [Insert Updated CAGR]% during the forecast period (2025-2033), with market penetration expected to reach [Insert Updated Penetration]% by 2033, highlighting the substantial growth potential.
Dominant Regions & Segments in Lighting as a Service Market
The Commercial segment currently dominates the LaaS market, driven by the high concentration of businesses seeking energy-efficient and cost-effective lighting solutions. North America is currently the leading region for LaaS adoption, fueled by strong economic growth and supportive government policies.
Key Drivers for Commercial Segment Dominance:
- High adoption rate amongst large enterprises.
- Strong focus on operational efficiency and cost reduction.
- Increased awareness of energy savings and sustainability.
Key Drivers for North American Regional Dominance:
- Early adoption of smart technologies.
- Robust infrastructure to support LaaS implementation.
- Government initiatives promoting energy efficiency.
The detailed dominance analysis highlights the significant influence of economic policies that incentivize energy-efficient technologies and supportive regulatory frameworks encouraging the adoption of LaaS. Furthermore, advancements in building automation systems and the increasing availability of high-speed internet connectivity further fuel this market segment's growth. The industrial and outdoor segments are also expected to show strong growth in the coming years due to factors like increasing automation and smart city initiatives.
Lighting as a Service Market Product Innovations
Recent product innovations in the LaaS market are characterized by a focus on enhanced intelligence and seamless integration. New solutions are incorporating sophisticated smart sensors, AI-powered controls, and robust data analytics capabilities. These advancements deliver superior energy efficiency, improved lighting quality, personalized user experiences, and streamlined remote management. Competitive advantages are increasingly derived from offering not just cost savings, but also demonstrably improved operational efficiency, enhanced user experiences, and valuable data insights. A significant technological trend is the expanding integration with building management systems (BMS) and the Internet of Things (IoT), creating interconnected and intelligent environments.
Report Scope & Segmentation Analysis
The report analyzes the LaaS market across three key end-user segments: Commercial, Outdoor, and Industrial. The Commercial segment is projected to exhibit the highest growth rate during the forecast period due to increased adoption of energy-efficient solutions in offices and commercial buildings. The Outdoor segment is expected to witness substantial growth driven by smart city initiatives and increased focus on public space lighting optimization. The Industrial segment’s growth is linked to advancements in factory automation and the need for enhanced safety and efficiency in industrial settings. Each segment exhibits distinct competitive dynamics, with varying levels of market concentration and technological adoption rates.
Key Drivers of Lighting as a Service Market Growth
The remarkable growth of the LaaS market is propelled by a confluence of factors. Technological advancements, particularly in LED technology and IoT, are pivotal in delivering substantial energy savings and precise lighting control. Government incentives and increasingly stringent regulations promoting energy efficiency and sustainable practices are further accelerating adoption. The compelling economic advantages, including reduced maintenance costs and significantly lower energy bills, provide a strong business case for transitioning to LaaS. Furthermore, the increasing awareness of the environmental impact of traditional lighting systems is driving the shift towards more sustainable solutions. These factors collectively contribute to the significant and sustained growth of the LaaS market.
Challenges in the Lighting as a Service Market Sector
While the LaaS market presents immense opportunities, several challenges remain. High initial investment costs can serve as a barrier to entry for some businesses, especially smaller organizations. Supply chain vulnerabilities and disruptions can impact the availability of crucial components and potentially increase costs. Intense competition and resulting pricing pressures can also affect profitability for market participants. However, these challenges are being actively addressed through innovative financing options, robust supply chain management strategies, and a focus on long-term value propositions that demonstrate significant cost savings and operational efficiencies provided by LaaS over the lifecycle of the lighting system.
Emerging Opportunities in Lighting as a Service Market
Emerging opportunities include expansion into new markets, such as smart homes and public spaces. Integration of advanced technologies like AI and 5G will unlock further efficiency gains. The growing emphasis on sustainability and reduced carbon footprint will continue to fuel market growth.
Leading Players in the Lighting as a Service Market Market
- Electricity Supply Board (ESB) Group
- Signify Holdings
- Lumenix
- Enlighted Inc
- LEDVANCE GmbH
- Lighthouse
- Stouch Lighting
- Every Watt Matters
- General Electric Company
- LumenServe Inc
Key Developments in Lighting as a Service Market Industry
- 2024 Q4: Signify Holdings launched a new AI-powered lighting management platform, showcasing advancements in intelligent lighting control and data analytics.
- 2023 Q3: A major merger between two LaaS providers significantly altered the market landscape, creating a larger, more influential player and potentially impacting pricing and innovation.
- 2022 Q2: New energy efficiency regulations implemented in several key markets accelerated the adoption of LaaS solutions by creating stricter compliance requirements.
- [Add another recent development here]: [Insert a recent development with a brief description]
Future Outlook for Lighting as a Service Market Market
The future of the LaaS market appears bright, with continued growth projected throughout the forecast period. Technological advancements, coupled with increasing environmental awareness and supportive government policies, will create significant opportunities for market expansion. Strategic partnerships and collaborations among key players will further shape the market landscape, resulting in innovative LaaS solutions catering to a broader spectrum of end-users.
Lighting as a Service Market Segmentation
-
1. End User
- 1.1. Commercial
- 1.2. Outdoor
- 1.3. Industrial
Lighting as a Service Market Segmentation By Geography
- 1. North America
- 2. Europe
- 3. Asia Pacific
- 4. Latin America
- 5. Middle East
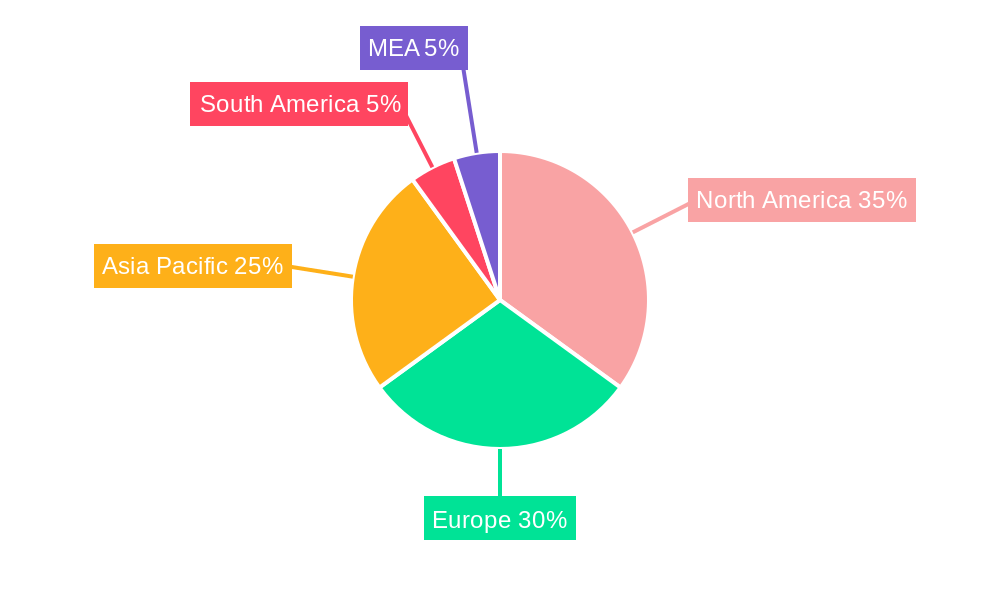
Lighting as a Service Market Regional Market Share
Geographic Coverage of Lighting as a Service Market
Lighting as a Service Market REPORT HIGHLIGHTS
| Aspects | Details |
|---|---|
| Study Period | 2020-2034 |
| Base Year | 2025 |
| Estimated Year | 2026 |
| Forecast Period | 2026-2034 |
| Historical Period | 2020-2025 |
| Growth Rate | CAGR of 34.8% from 2020-2034 |
| Segmentation |
|
Table of Contents
- 1. Introduction
- 1.1. Research Scope
- 1.2. Market Segmentation
- 1.3. Research Objective
- 1.4. Definitions and Assumptions
- 2. Executive Summary
- 2.1. Market Snapshot
- 3. Market Dynamics
- 3.1. Market Drivers
- 3.2. Market Restrains
- 3.3. Market Trends
- 3.4. Market Opportunities
- 4. Market Factor Analysis
- 4.1. Porters Five Forces
- 4.1.1. Bargaining Power of Suppliers
- 4.1.2. Bargaining Power of Buyers
- 4.1.3. Threat of New Entrants
- 4.1.4. Threat of Substitutes
- 4.1.5. Competitive Rivalry
- 4.2. PESTEL analysis
- 4.3. BCG Analysis
- 4.3.1. Stars (High Growth, High Market Share)
- 4.3.2. Cash Cows (Low Growth, High Market Share)
- 4.3.3. Question Mark (High Growth, Low Market Share)
- 4.3.4. Dogs (Low Growth, Low Market Share)
- 4.4. Ansoff Matrix Analysis
- 4.5. Supply Chain Analysis
- 4.6. Regulatory Landscape
- 4.7. Current Market Potential and Opportunity Assessment (TAM–SAM–SOM Framework)
- 4.8. PRI Analyst Note
- 4.1. Porters Five Forces
- 5. Market Analysis, Insights and Forecast 2021-2033
- 5.1. Market Analysis, Insights and Forecast - by End User
- 5.1.1. Commercial
- 5.1.2. Outdoor
- 5.1.3. Industrial
- 5.2. Market Analysis, Insights and Forecast - by Region
- 5.2.1. North America
- 5.2.2. Europe
- 5.2.3. Asia Pacific
- 5.2.4. Latin America
- 5.2.5. Middle East
- 5.1. Market Analysis, Insights and Forecast - by End User
- 6. Global Lighting as a Service Market Analysis, Insights and Forecast, 2021-2033
- 6.1. Market Analysis, Insights and Forecast - by End User
- 6.1.1. Commercial
- 6.1.2. Outdoor
- 6.1.3. Industrial
- 6.1. Market Analysis, Insights and Forecast - by End User
- 7. North America Lighting as a Service Market Analysis, Insights and Forecast, 2020-2032
- 7.1. Market Analysis, Insights and Forecast - by End User
- 7.1.1. Commercial
- 7.1.2. Outdoor
- 7.1.3. Industrial
- 7.1. Market Analysis, Insights and Forecast - by End User
- 8. Europe Lighting as a Service Market Analysis, Insights and Forecast, 2020-2032
- 8.1. Market Analysis, Insights and Forecast - by End User
- 8.1.1. Commercial
- 8.1.2. Outdoor
- 8.1.3. Industrial
- 8.1. Market Analysis, Insights and Forecast - by End User
- 9. Asia Pacific Lighting as a Service Market Analysis, Insights and Forecast, 2020-2032
- 9.1. Market Analysis, Insights and Forecast - by End User
- 9.1.1. Commercial
- 9.1.2. Outdoor
- 9.1.3. Industrial
- 9.1. Market Analysis, Insights and Forecast - by End User
- 10. Latin America Lighting as a Service Market Analysis, Insights and Forecast, 2020-2032
- 10.1. Market Analysis, Insights and Forecast - by End User
- 10.1.1. Commercial
- 10.1.2. Outdoor
- 10.1.3. Industrial
- 10.1. Market Analysis, Insights and Forecast - by End User
- 11. Middle East Lighting as a Service Market Analysis, Insights and Forecast, 2020-2032
- 11.1. Market Analysis, Insights and Forecast - by End User
- 11.1.1. Commercial
- 11.1.2. Outdoor
- 11.1.3. Industrial
- 11.1. Market Analysis, Insights and Forecast - by End User
- 12. Competitive Analysis
- 12.1. Company Profiles
- 12.1.1 Electricity Supply Board (ESB) Group
- 12.1.1.1. Company Overview
- 12.1.1.2. Products
- 12.1.1.3. Company Financials
- 12.1.1.4. SWOT Analysis
- 12.1.2 Signify Holdings
- 12.1.2.1. Company Overview
- 12.1.2.2. Products
- 12.1.2.3. Company Financials
- 12.1.2.4. SWOT Analysis
- 12.1.3 Lumenix
- 12.1.3.1. Company Overview
- 12.1.3.2. Products
- 12.1.3.3. Company Financials
- 12.1.3.4. SWOT Analysis
- 12.1.4 Enlighted Inc
- 12.1.4.1. Company Overview
- 12.1.4.2. Products
- 12.1.4.3. Company Financials
- 12.1.4.4. SWOT Analysis
- 12.1.5 LEDVANCE GmbH
- 12.1.5.1. Company Overview
- 12.1.5.2. Products
- 12.1.5.3. Company Financials
- 12.1.5.4. SWOT Analysis
- 12.1.6 Lighthouse*List Not Exhaustive
- 12.1.6.1. Company Overview
- 12.1.6.2. Products
- 12.1.6.3. Company Financials
- 12.1.6.4. SWOT Analysis
- 12.1.7 Stouch Lighting
- 12.1.7.1. Company Overview
- 12.1.7.2. Products
- 12.1.7.3. Company Financials
- 12.1.7.4. SWOT Analysis
- 12.1.8 Every Watt Matters
- 12.1.8.1. Company Overview
- 12.1.8.2. Products
- 12.1.8.3. Company Financials
- 12.1.8.4. SWOT Analysis
- 12.1.9 General Electric Company
- 12.1.9.1. Company Overview
- 12.1.9.2. Products
- 12.1.9.3. Company Financials
- 12.1.9.4. SWOT Analysis
- 12.1.10 LumenServe Inc
- 12.1.10.1. Company Overview
- 12.1.10.2. Products
- 12.1.10.3. Company Financials
- 12.1.10.4. SWOT Analysis
- 12.1.1 Electricity Supply Board (ESB) Group
- 12.2. Market Entropy
- 12.2.1 Company's Key Areas Served
- 12.2.2 Recent Developments
- 12.3. Company Market Share Analysis 2025
- 12.3.1 Top 5 Companies Market Share Analysis
- 12.3.2 Top 3 Companies Market Share Analysis
- 12.4. List of Potential Customers
- 13. Research Methodology
List of Figures
- Figure 1: Global Lighting as a Service Market Revenue Breakdown (billion, %) by Region 2025 & 2033
- Figure 2: North America Lighting as a Service Market Revenue (billion), by End User 2025 & 2033
- Figure 3: North America Lighting as a Service Market Revenue Share (%), by End User 2025 & 2033
- Figure 4: North America Lighting as a Service Market Revenue (billion), by Country 2025 & 2033
- Figure 5: North America Lighting as a Service Market Revenue Share (%), by Country 2025 & 2033
- Figure 6: Europe Lighting as a Service Market Revenue (billion), by End User 2025 & 2033
- Figure 7: Europe Lighting as a Service Market Revenue Share (%), by End User 2025 & 2033
- Figure 8: Europe Lighting as a Service Market Revenue (billion), by Country 2025 & 2033
- Figure 9: Europe Lighting as a Service Market Revenue Share (%), by Country 2025 & 2033
- Figure 10: Asia Pacific Lighting as a Service Market Revenue (billion), by End User 2025 & 2033
- Figure 11: Asia Pacific Lighting as a Service Market Revenue Share (%), by End User 2025 & 2033
- Figure 12: Asia Pacific Lighting as a Service Market Revenue (billion), by Country 2025 & 2033
- Figure 13: Asia Pacific Lighting as a Service Market Revenue Share (%), by Country 2025 & 2033
- Figure 14: Latin America Lighting as a Service Market Revenue (billion), by End User 2025 & 2033
- Figure 15: Latin America Lighting as a Service Market Revenue Share (%), by End User 2025 & 2033
- Figure 16: Latin America Lighting as a Service Market Revenue (billion), by Country 2025 & 2033
- Figure 17: Latin America Lighting as a Service Market Revenue Share (%), by Country 2025 & 2033
- Figure 18: Middle East Lighting as a Service Market Revenue (billion), by End User 2025 & 2033
- Figure 19: Middle East Lighting as a Service Market Revenue Share (%), by End User 2025 & 2033
- Figure 20: Middle East Lighting as a Service Market Revenue (billion), by Country 2025 & 2033
- Figure 21: Middle East Lighting as a Service Market Revenue Share (%), by Country 2025 & 2033
List of Tables
- Table 1: Global Lighting as a Service Market Revenue billion Forecast, by End User 2020 & 2033
- Table 2: Global Lighting as a Service Market Revenue billion Forecast, by Region 2020 & 2033
- Table 3: Global Lighting as a Service Market Revenue billion Forecast, by End User 2020 & 2033
- Table 4: Global Lighting as a Service Market Revenue billion Forecast, by Country 2020 & 2033
- Table 5: Global Lighting as a Service Market Revenue billion Forecast, by End User 2020 & 2033
- Table 6: Global Lighting as a Service Market Revenue billion Forecast, by Country 2020 & 2033
- Table 7: Global Lighting as a Service Market Revenue billion Forecast, by End User 2020 & 2033
- Table 8: Global Lighting as a Service Market Revenue billion Forecast, by Country 2020 & 2033
- Table 9: Global Lighting as a Service Market Revenue billion Forecast, by End User 2020 & 2033
- Table 10: Global Lighting as a Service Market Revenue billion Forecast, by Country 2020 & 2033
- Table 11: Global Lighting as a Service Market Revenue billion Forecast, by End User 2020 & 2033
- Table 12: Global Lighting as a Service Market Revenue billion Forecast, by Country 2020 & 2033
Frequently Asked Questions
1. What is the projected Compound Annual Growth Rate (CAGR) of the Lighting as a Service Market?
The projected CAGR is approximately 34.8%.
2. Which companies are prominent players in the Lighting as a Service Market?
Key companies in the market include Electricity Supply Board (ESB) Group, Signify Holdings, Lumenix, Enlighted Inc, LEDVANCE GmbH, Lighthouse*List Not Exhaustive, Stouch Lighting, Every Watt Matters, General Electric Company, LumenServe Inc.
3. What are the main segments of the Lighting as a Service Market?
The market segments include End User.
4. Can you provide details about the market size?
The market size is estimated to be USD 3.5 billion as of 2022.
5. What are some drivers contributing to market growth?
; Government Policies for the Adoption of Energy-efficient Lighting Systems; Adoption of IoT with Lighting Systems.
6. What are the notable trends driving market growth?
Commercial Segment to Dominate the Market.
7. Are there any restraints impacting market growth?
4.; The global shift toward renewable sources for electricity generation.
8. Can you provide examples of recent developments in the market?
N/A
9. What pricing options are available for accessing the report?
Pricing options include single-user, multi-user, and enterprise licenses priced at USD 4750, USD 5250, and USD 8750 respectively.
10. Is the market size provided in terms of value or volume?
The market size is provided in terms of value, measured in billion.
11. Are there any specific market keywords associated with the report?
Yes, the market keyword associated with the report is "Lighting as a Service Market," which aids in identifying and referencing the specific market segment covered.
12. How do I determine which pricing option suits my needs best?
The pricing options vary based on user requirements and access needs. Individual users may opt for single-user licenses, while businesses requiring broader access may choose multi-user or enterprise licenses for cost-effective access to the report.
13. Are there any additional resources or data provided in the Lighting as a Service Market report?
While the report offers comprehensive insights, it's advisable to review the specific contents or supplementary materials provided to ascertain if additional resources or data are available.
14. How can I stay updated on further developments or reports in the Lighting as a Service Market?
To stay informed about further developments, trends, and reports in the Lighting as a Service Market, consider subscribing to industry newsletters, following relevant companies and organizations, or regularly checking reputable industry news sources and publications.
Methodology
Step 1 - Identification of Relevant Samples Size from Population Database


Step 2 - Approaches for Defining Global Market Size (Value, Volume* & Price*)

Note*: In applicable scenarios
Step 3 - Data Sources
Primary Research
- Web Analytics
- Survey Reports
- Research Institute
- Latest Research Reports
- Opinion Leaders
Secondary Research
- Annual Reports
- White Paper
- Latest Press Release
- Industry Association
- Paid Database
- Investor Presentations

Step 4 - Data Triangulation
Involves using different sources of information in order to increase the validity of a study
These sources are likely to be stakeholders in a program - participants, other researchers, program staff, other community members, and so on.
Then we put all data in single framework & apply various statistical tools to find out the dynamic on the market.
During the analysis stage, feedback from the stakeholder groups would be compared to determine areas of agreement as well as areas of divergence