

Key Insights
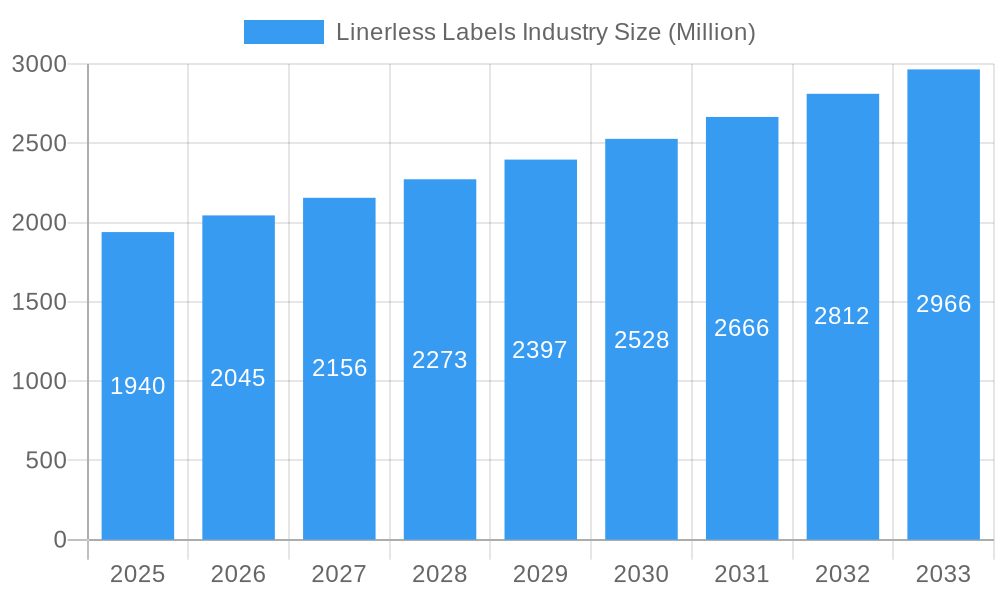
The linerless label market, valued at $1.94 billion in 2025, is projected to experience robust growth, driven by increasing demand for sustainable packaging solutions and advancements in printing technologies. The Compound Annual Growth Rate (CAGR) of 5.28% from 2025 to 2033 indicates a significant expansion, fueled by the rising adoption of linerless labels across diverse end-user industries. The food and beverage sector is a key driver, seeking eco-friendly alternatives to traditional labels. The healthcare industry's focus on hygiene and efficient labeling further contributes to market growth. Furthermore, the burgeoning e-commerce sector's need for efficient and cost-effective labeling systems is significantly boosting demand. While the initial investment in new printing technologies might pose a restraint for some smaller companies, the long-term cost savings and environmental benefits are expected to outweigh this initial hurdle. The shift toward digital printing technologies, offering greater flexibility and customization, is a prominent trend shaping the market landscape. Different printing technologies like flexography and gravure printing continue to hold significant market share, catering to varying production volumes and label designs. The market segmentation by end-user industry (food, beverage, healthcare, cosmetics, etc.) and printing technology (gravure, flexography, digital) provides valuable insights for strategic decision-making within the industry. Geographic expansion, especially within the rapidly developing economies of Asia-Pacific, presents lucrative opportunities for market players.
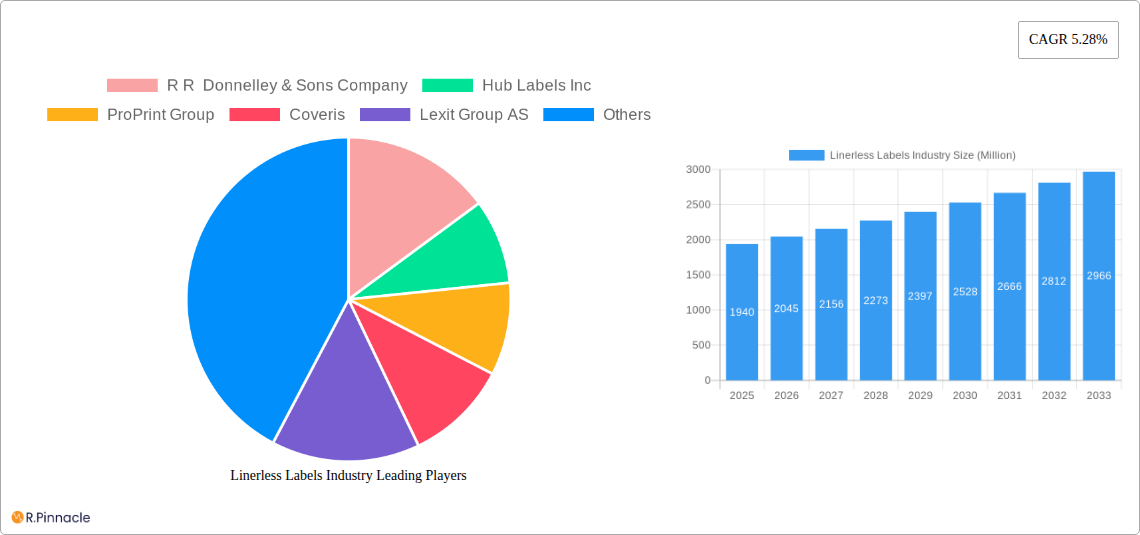
Linerless Labels Industry Market Size (In Billion)
The competitive landscape is characterized by both established players and emerging companies. Major players like R R Donnelley & Sons Company, Hub Labels Inc., and others are investing heavily in research and development to enhance their product offerings and cater to the evolving demands of various industries. This competitive landscape fosters innovation and drives the development of more sustainable and efficient linerless label solutions. Future growth will be influenced by factors such as government regulations promoting sustainable packaging, technological advancements, and the increasing focus on reducing environmental impact throughout the supply chain. The market's potential for growth is considerable, with ongoing opportunities for both established manufacturers and new entrants seeking to capitalize on the rising demand for environmentally friendly and cost-effective labeling solutions.
Linerless Labels Industry Company Market Share
This in-depth report provides a comprehensive analysis of the Linerless Labels industry, offering invaluable insights for industry professionals, investors, and strategic decision-makers. Covering the period 2019-2033, with a base year of 2025 and a forecast period of 2025-2033, this report meticulously examines market dynamics, growth drivers, challenges, and opportunities within this rapidly evolving sector. The global Linerless Labels market is projected to reach xx Million by 2033.
Linerless Labels Industry Market Structure & Innovation Trends
This section analyzes the competitive landscape of the Linerless Labels industry, evaluating market concentration, innovation drivers, regulatory frameworks, and M&A activities. The report examines the market share of key players, including R R Donnelley & Sons Company, Hub Labels Inc, ProPrint Group, Coveris, Lexit Group AS, Gipako UAB, Optimum Group, Skanem AS, NAStar Inc, Reflex Labels Ltd, Innovia Films (CCL Industries), and SATO Europe GmbH (Note: List not exhaustive).
- Market Concentration: The market exhibits a [Describe level of concentration: e.g., moderately concentrated/highly fragmented] structure, with the top five players holding an estimated [xx]% market share in 2024.
- Innovation Drivers: Key innovation drivers include advancements in printing technologies (e.g., digital printing), the rising demand for sustainable packaging solutions, and increasing focus on brand enhancement through label design.
- Regulatory Frameworks: Government regulations concerning waste reduction and sustainable packaging significantly influence market growth. [Include specific examples of regulations and their impact].
- Product Substitutes: [Discuss potential substitute products and their impact on market dynamics].
- End-User Demographics: The report analyzes end-user demographics across various segments, including the Food & Beverage, Healthcare, Cosmetics, Household, Industrial, and Logistics industries. [Include specific data points, if available]
- M&A Activities: The report identifies significant mergers and acquisitions in the Linerless Labels industry, detailing deal values and their impact on market consolidation. For example, the investment by ProPrint Group reflects a trend towards increased capacity and market share expansion. [Include further examples and total M&A deal value for the period if available].
Linerless Labels Industry Market Dynamics & Trends
This section delves into the key market dynamics driving growth and shaping the future of the Linerless Labels industry. The analysis includes a detailed examination of market growth drivers, technological disruptions, evolving consumer preferences, and competitive dynamics.
The market is experiencing significant growth, driven by factors such as [Explain factors driving growth, including specifics on CAGR and market penetration data]. Technological advancements in printing techniques, particularly digital printing, are increasing the efficiency and cost-effectiveness of linerless label production, further fueling market expansion. [Include detail on the impact of specific technologies and consumer preferences]. The competitive landscape is characterized by [Describe the nature of competition: e.g., intense competition/moderate competition], with companies focusing on product innovation, strategic partnerships, and geographic expansion to maintain their market position. The CAGR for the Linerless Labels market during the forecast period (2025-2033) is estimated to be [xx]%.
Dominant Regions & Segments in Linerless Labels Industry
This section identifies the leading regions and segments within the Linerless Labels industry.
By End-user Industry:
- Food & Beverage: This segment dominates the market due to [Explain reasons for dominance, including specific market size].
- Healthcare: The increasing demand for tamper-evident labels in the pharmaceutical and medical device sectors drives growth in this segment.
- Other segments: [Analyze the other end-user industries and their market share and growth drivers.]
By Printing Technology:
- Flexography: Flexography remains the dominant printing technology due to its versatility and cost-effectiveness.
- Digital Printing: Digital printing is gaining traction due to its ability to provide customized and short-run labels. [Explain its market share and growth potential].
- Other Processes of Printing: [Analyze the market share and growth drivers of other printing technologies.]
[Provide a detailed dominance analysis for the leading region(s) and segment(s) including economic policies and infrastructure as key drivers. Include quantitative data to support the analysis wherever possible.]
Linerless Labels Industry Product Innovations
Recent product innovations focus on improving sustainability, enhancing label performance, and broadening application possibilities. These advancements include [Describe specific product innovations and their competitive advantages]. Technological trends like the increasing adoption of digital printing and the development of more environmentally friendly adhesive materials are shaping the market landscape and driving product innovation.
Report Scope & Segmentation Analysis
This report segments the Linerless Labels market by end-user industry (Food, Beverage, Healthcare, Cosmetics, Household, Industrial, Logistics, Other) and printing technology (Gravure, Flexography, Digital, Other). Each segment's growth projections, market size, and competitive dynamics are analyzed in detail. [Include specific quantitative data on market size and growth for each segment].
Key Drivers of Linerless Labels Industry Growth
Several factors fuel the Linerless Labels market's growth, including:
- Sustainability concerns: Increasing consumer and regulatory pressure to reduce waste drives adoption of eco-friendly linerless labels.
- Technological advancements: Innovations in printing and adhesive technologies improve efficiency and expand application possibilities.
- Brand enhancement: Linerless labels offer enhanced design flexibility and branding opportunities.
Challenges in the Linerless Labels Industry Sector
The Linerless Labels industry faces several challenges, including:
- Supply chain disruptions: [Explain impact with quantifiable data, if available].
- Raw material costs: Fluctuations in raw material prices can impact production costs and profitability.
- Intense competition: [Quantify the impact of competitive pressures, if possible].
Emerging Opportunities in Linerless Labels Industry
Emerging opportunities include:
- Expansion into new markets: Untapped potential exists in developing economies with growing consumer demand.
- Development of novel materials: Research and development of sustainable and high-performance materials present significant opportunities.
- Growth in specialized applications: Applications in niche markets, such as pharmaceuticals and high-value goods, present growth opportunities.
Leading Players in the Linerless Labels Industry Market
- R R Donnelley & Sons Company
- Hub Labels Inc
- ProPrint Group
- Coveris
- Lexit Group AS
- Gipako UAB
- Optimum Group
- Skanem AS
- NAStar Inc
- Reflex Labels Ltd
- Innovia Films (CCL Industries)
- SATO Europe GmbH
Key Developments in Linerless Labels Industry
- February 2022: ProPrint Group invested almost EUR 1 million in a new Ravenwood Com500 Coater and a 10-colour Edale FL3 flexo press, significantly increasing its linerless label production capacity.
- February 2022: Lexit Group partnered with Markem-Imaje (MI) to distribute their products in Norway, Sweden, and Denmark, expanding its market reach.
Future Outlook for Linerless Labels Industry Market
The Linerless Labels market is poised for continued growth driven by strong demand for sustainable packaging, technological advancements, and increasing brand awareness. Strategic partnerships, acquisitions, and geographic expansion will be key strategies for market players to capitalize on this growth potential. The market is projected to witness significant expansion, with substantial growth opportunities in emerging economies and specialized market segments.
Linerless Labels Industry Segmentation
-
1. Printing Technology
- 1.1. Gravure
- 1.2. Flexography
- 1.3. Digital
- 1.4. Other Processes of Printing
-
2. End-user Industry
- 2.1. Food
- 2.2. Beverage
- 2.3. Healthcare
- 2.4. Cosmetics
- 2.5. Household
- 2.6. Industrial
- 2.7. Logistics
- 2.8. Other End-user Industries
Linerless Labels Industry Segmentation By Geography
- 1. North America
- 2. Europe
- 3. Asia Pacific
- 4. Latin America
- 5. Middle East and Africa
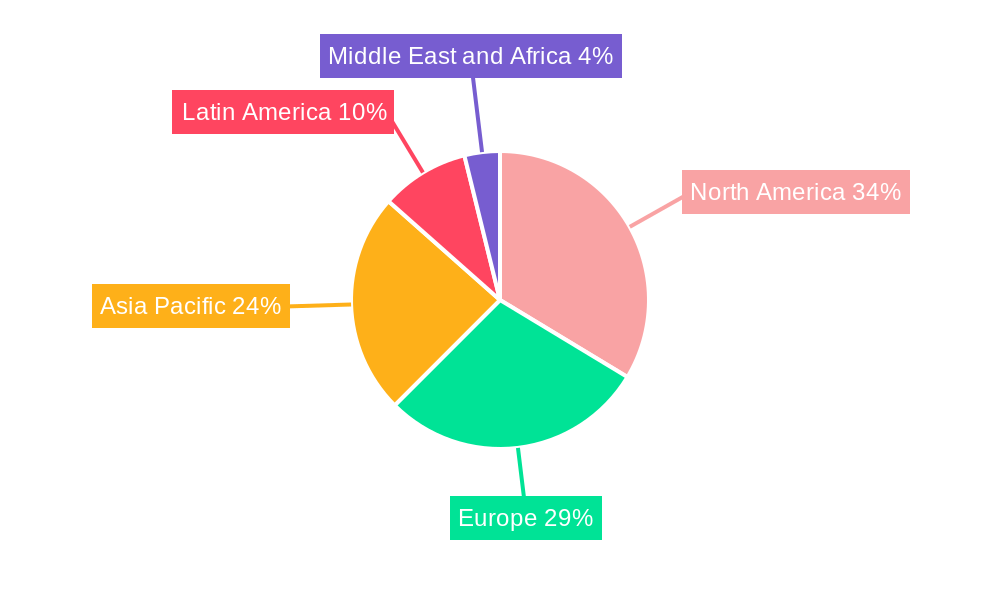
Linerless Labels Industry Regional Market Share
Geographic Coverage of Linerless Labels Industry
Linerless Labels Industry REPORT HIGHLIGHTS
| Aspects | Details |
|---|---|
| Study Period | 2020-2034 |
| Base Year | 2025 |
| Estimated Year | 2026 |
| Forecast Period | 2026-2034 |
| Historical Period | 2020-2025 |
| Growth Rate | CAGR of 5.28% from 2020-2034 |
| Segmentation |
|
Table of Contents
- 1. Introduction
- 1.1. Research Scope
- 1.2. Market Segmentation
- 1.3. Research Objective
- 1.4. Definitions and Assumptions
- 2. Executive Summary
- 2.1. Market Snapshot
- 3. Market Dynamics
- 3.1. Market Drivers
- 3.2. Market Restrains
- 3.3. Market Trends
- 3.4. Market Opportunities
- 4. Market Factor Analysis
- 4.1. Porters Five Forces
- 4.1.1. Bargaining Power of Suppliers
- 4.1.2. Bargaining Power of Buyers
- 4.1.3. Threat of New Entrants
- 4.1.4. Threat of Substitutes
- 4.1.5. Competitive Rivalry
- 4.2. PESTEL analysis
- 4.3. BCG Analysis
- 4.3.1. Stars (High Growth, High Market Share)
- 4.3.2. Cash Cows (Low Growth, High Market Share)
- 4.3.3. Question Mark (High Growth, Low Market Share)
- 4.3.4. Dogs (Low Growth, Low Market Share)
- 4.4. Ansoff Matrix Analysis
- 4.5. Supply Chain Analysis
- 4.6. Regulatory Landscape
- 4.7. Current Market Potential and Opportunity Assessment (TAM–SAM–SOM Framework)
- 4.8. PRI Analyst Note
- 4.1. Porters Five Forces
- 5. Market Analysis, Insights and Forecast 2021-2033
- 5.1. Market Analysis, Insights and Forecast - by Printing Technology
- 5.1.1. Gravure
- 5.1.2. Flexography
- 5.1.3. Digital
- 5.1.4. Other Processes of Printing
- 5.2. Market Analysis, Insights and Forecast - by End-user Industry
- 5.2.1. Food
- 5.2.2. Beverage
- 5.2.3. Healthcare
- 5.2.4. Cosmetics
- 5.2.5. Household
- 5.2.6. Industrial
- 5.2.7. Logistics
- 5.2.8. Other End-user Industries
- 5.3. Market Analysis, Insights and Forecast - by Region
- 5.3.1. North America
- 5.3.2. Europe
- 5.3.3. Asia Pacific
- 5.3.4. Latin America
- 5.3.5. Middle East and Africa
- 5.1. Market Analysis, Insights and Forecast - by Printing Technology
- 6. Global Linerless Labels Industry Analysis, Insights and Forecast, 2021-2033
- 6.1. Market Analysis, Insights and Forecast - by Printing Technology
- 6.1.1. Gravure
- 6.1.2. Flexography
- 6.1.3. Digital
- 6.1.4. Other Processes of Printing
- 6.2. Market Analysis, Insights and Forecast - by End-user Industry
- 6.2.1. Food
- 6.2.2. Beverage
- 6.2.3. Healthcare
- 6.2.4. Cosmetics
- 6.2.5. Household
- 6.2.6. Industrial
- 6.2.7. Logistics
- 6.2.8. Other End-user Industries
- 6.1. Market Analysis, Insights and Forecast - by Printing Technology
- 7. North America Linerless Labels Industry Analysis, Insights and Forecast, 2020-2032
- 7.1. Market Analysis, Insights and Forecast - by Printing Technology
- 7.1.1. Gravure
- 7.1.2. Flexography
- 7.1.3. Digital
- 7.1.4. Other Processes of Printing
- 7.2. Market Analysis, Insights and Forecast - by End-user Industry
- 7.2.1. Food
- 7.2.2. Beverage
- 7.2.3. Healthcare
- 7.2.4. Cosmetics
- 7.2.5. Household
- 7.2.6. Industrial
- 7.2.7. Logistics
- 7.2.8. Other End-user Industries
- 7.1. Market Analysis, Insights and Forecast - by Printing Technology
- 8. Europe Linerless Labels Industry Analysis, Insights and Forecast, 2020-2032
- 8.1. Market Analysis, Insights and Forecast - by Printing Technology
- 8.1.1. Gravure
- 8.1.2. Flexography
- 8.1.3. Digital
- 8.1.4. Other Processes of Printing
- 8.2. Market Analysis, Insights and Forecast - by End-user Industry
- 8.2.1. Food
- 8.2.2. Beverage
- 8.2.3. Healthcare
- 8.2.4. Cosmetics
- 8.2.5. Household
- 8.2.6. Industrial
- 8.2.7. Logistics
- 8.2.8. Other End-user Industries
- 8.1. Market Analysis, Insights and Forecast - by Printing Technology
- 9. Asia Pacific Linerless Labels Industry Analysis, Insights and Forecast, 2020-2032
- 9.1. Market Analysis, Insights and Forecast - by Printing Technology
- 9.1.1. Gravure
- 9.1.2. Flexography
- 9.1.3. Digital
- 9.1.4. Other Processes of Printing
- 9.2. Market Analysis, Insights and Forecast - by End-user Industry
- 9.2.1. Food
- 9.2.2. Beverage
- 9.2.3. Healthcare
- 9.2.4. Cosmetics
- 9.2.5. Household
- 9.2.6. Industrial
- 9.2.7. Logistics
- 9.2.8. Other End-user Industries
- 9.1. Market Analysis, Insights and Forecast - by Printing Technology
- 10. Latin America Linerless Labels Industry Analysis, Insights and Forecast, 2020-2032
- 10.1. Market Analysis, Insights and Forecast - by Printing Technology
- 10.1.1. Gravure
- 10.1.2. Flexography
- 10.1.3. Digital
- 10.1.4. Other Processes of Printing
- 10.2. Market Analysis, Insights and Forecast - by End-user Industry
- 10.2.1. Food
- 10.2.2. Beverage
- 10.2.3. Healthcare
- 10.2.4. Cosmetics
- 10.2.5. Household
- 10.2.6. Industrial
- 10.2.7. Logistics
- 10.2.8. Other End-user Industries
- 10.1. Market Analysis, Insights and Forecast - by Printing Technology
- 11. Middle East and Africa Linerless Labels Industry Analysis, Insights and Forecast, 2020-2032
- 11.1. Market Analysis, Insights and Forecast - by Printing Technology
- 11.1.1. Gravure
- 11.1.2. Flexography
- 11.1.3. Digital
- 11.1.4. Other Processes of Printing
- 11.2. Market Analysis, Insights and Forecast - by End-user Industry
- 11.2.1. Food
- 11.2.2. Beverage
- 11.2.3. Healthcare
- 11.2.4. Cosmetics
- 11.2.5. Household
- 11.2.6. Industrial
- 11.2.7. Logistics
- 11.2.8. Other End-user Industries
- 11.1. Market Analysis, Insights and Forecast - by Printing Technology
- 12. Competitive Analysis
- 12.1. Company Profiles
- 12.1.1 R R Donnelley & Sons Company
- 12.1.1.1. Company Overview
- 12.1.1.2. Products
- 12.1.1.3. Company Financials
- 12.1.1.4. SWOT Analysis
- 12.1.2 Hub Labels Inc
- 12.1.2.1. Company Overview
- 12.1.2.2. Products
- 12.1.2.3. Company Financials
- 12.1.2.4. SWOT Analysis
- 12.1.3 ProPrint Group
- 12.1.3.1. Company Overview
- 12.1.3.2. Products
- 12.1.3.3. Company Financials
- 12.1.3.4. SWOT Analysis
- 12.1.4 Coveris
- 12.1.4.1. Company Overview
- 12.1.4.2. Products
- 12.1.4.3. Company Financials
- 12.1.4.4. SWOT Analysis
- 12.1.5 Lexit Group AS
- 12.1.5.1. Company Overview
- 12.1.5.2. Products
- 12.1.5.3. Company Financials
- 12.1.5.4. SWOT Analysis
- 12.1.6 Gipako UAB*List Not Exhaustive
- 12.1.6.1. Company Overview
- 12.1.6.2. Products
- 12.1.6.3. Company Financials
- 12.1.6.4. SWOT Analysis
- 12.1.7 Optimum Group
- 12.1.7.1. Company Overview
- 12.1.7.2. Products
- 12.1.7.3. Company Financials
- 12.1.7.4. SWOT Analysis
- 12.1.8 Skanem AS
- 12.1.8.1. Company Overview
- 12.1.8.2. Products
- 12.1.8.3. Company Financials
- 12.1.8.4. SWOT Analysis
- 12.1.9 NAStar Inc
- 12.1.9.1. Company Overview
- 12.1.9.2. Products
- 12.1.9.3. Company Financials
- 12.1.9.4. SWOT Analysis
- 12.1.10 Reflex Labels Ltd
- 12.1.10.1. Company Overview
- 12.1.10.2. Products
- 12.1.10.3. Company Financials
- 12.1.10.4. SWOT Analysis
- 12.1.11 Innovia Films (CCL Industries)
- 12.1.11.1. Company Overview
- 12.1.11.2. Products
- 12.1.11.3. Company Financials
- 12.1.11.4. SWOT Analysis
- 12.1.12 SATO Europe GmbH
- 12.1.12.1. Company Overview
- 12.1.12.2. Products
- 12.1.12.3. Company Financials
- 12.1.12.4. SWOT Analysis
- 12.1.1 R R Donnelley & Sons Company
- 12.2. Market Entropy
- 12.2.1 Company's Key Areas Served
- 12.2.2 Recent Developments
- 12.3. Company Market Share Analysis 2025
- 12.3.1 Top 5 Companies Market Share Analysis
- 12.3.2 Top 3 Companies Market Share Analysis
- 12.4. List of Potential Customers
- 13. Research Methodology
List of Figures
- Figure 1: Global Linerless Labels Industry Revenue Breakdown (Million, %) by Region 2025 & 2033
- Figure 2: North America Linerless Labels Industry Revenue (Million), by Printing Technology 2025 & 2033
- Figure 3: North America Linerless Labels Industry Revenue Share (%), by Printing Technology 2025 & 2033
- Figure 4: North America Linerless Labels Industry Revenue (Million), by End-user Industry 2025 & 2033
- Figure 5: North America Linerless Labels Industry Revenue Share (%), by End-user Industry 2025 & 2033
- Figure 6: North America Linerless Labels Industry Revenue (Million), by Country 2025 & 2033
- Figure 7: North America Linerless Labels Industry Revenue Share (%), by Country 2025 & 2033
- Figure 8: Europe Linerless Labels Industry Revenue (Million), by Printing Technology 2025 & 2033
- Figure 9: Europe Linerless Labels Industry Revenue Share (%), by Printing Technology 2025 & 2033
- Figure 10: Europe Linerless Labels Industry Revenue (Million), by End-user Industry 2025 & 2033
- Figure 11: Europe Linerless Labels Industry Revenue Share (%), by End-user Industry 2025 & 2033
- Figure 12: Europe Linerless Labels Industry Revenue (Million), by Country 2025 & 2033
- Figure 13: Europe Linerless Labels Industry Revenue Share (%), by Country 2025 & 2033
- Figure 14: Asia Pacific Linerless Labels Industry Revenue (Million), by Printing Technology 2025 & 2033
- Figure 15: Asia Pacific Linerless Labels Industry Revenue Share (%), by Printing Technology 2025 & 2033
- Figure 16: Asia Pacific Linerless Labels Industry Revenue (Million), by End-user Industry 2025 & 2033
- Figure 17: Asia Pacific Linerless Labels Industry Revenue Share (%), by End-user Industry 2025 & 2033
- Figure 18: Asia Pacific Linerless Labels Industry Revenue (Million), by Country 2025 & 2033
- Figure 19: Asia Pacific Linerless Labels Industry Revenue Share (%), by Country 2025 & 2033
- Figure 20: Latin America Linerless Labels Industry Revenue (Million), by Printing Technology 2025 & 2033
- Figure 21: Latin America Linerless Labels Industry Revenue Share (%), by Printing Technology 2025 & 2033
- Figure 22: Latin America Linerless Labels Industry Revenue (Million), by End-user Industry 2025 & 2033
- Figure 23: Latin America Linerless Labels Industry Revenue Share (%), by End-user Industry 2025 & 2033
- Figure 24: Latin America Linerless Labels Industry Revenue (Million), by Country 2025 & 2033
- Figure 25: Latin America Linerless Labels Industry Revenue Share (%), by Country 2025 & 2033
- Figure 26: Middle East and Africa Linerless Labels Industry Revenue (Million), by Printing Technology 2025 & 2033
- Figure 27: Middle East and Africa Linerless Labels Industry Revenue Share (%), by Printing Technology 2025 & 2033
- Figure 28: Middle East and Africa Linerless Labels Industry Revenue (Million), by End-user Industry 2025 & 2033
- Figure 29: Middle East and Africa Linerless Labels Industry Revenue Share (%), by End-user Industry 2025 & 2033
- Figure 30: Middle East and Africa Linerless Labels Industry Revenue (Million), by Country 2025 & 2033
- Figure 31: Middle East and Africa Linerless Labels Industry Revenue Share (%), by Country 2025 & 2033
List of Tables
- Table 1: Global Linerless Labels Industry Revenue Million Forecast, by Printing Technology 2020 & 2033
- Table 2: Global Linerless Labels Industry Revenue Million Forecast, by End-user Industry 2020 & 2033
- Table 3: Global Linerless Labels Industry Revenue Million Forecast, by Region 2020 & 2033
- Table 4: Global Linerless Labels Industry Revenue Million Forecast, by Printing Technology 2020 & 2033
- Table 5: Global Linerless Labels Industry Revenue Million Forecast, by End-user Industry 2020 & 2033
- Table 6: Global Linerless Labels Industry Revenue Million Forecast, by Country 2020 & 2033
- Table 7: Global Linerless Labels Industry Revenue Million Forecast, by Printing Technology 2020 & 2033
- Table 8: Global Linerless Labels Industry Revenue Million Forecast, by End-user Industry 2020 & 2033
- Table 9: Global Linerless Labels Industry Revenue Million Forecast, by Country 2020 & 2033
- Table 10: Global Linerless Labels Industry Revenue Million Forecast, by Printing Technology 2020 & 2033
- Table 11: Global Linerless Labels Industry Revenue Million Forecast, by End-user Industry 2020 & 2033
- Table 12: Global Linerless Labels Industry Revenue Million Forecast, by Country 2020 & 2033
- Table 13: Global Linerless Labels Industry Revenue Million Forecast, by Printing Technology 2020 & 2033
- Table 14: Global Linerless Labels Industry Revenue Million Forecast, by End-user Industry 2020 & 2033
- Table 15: Global Linerless Labels Industry Revenue Million Forecast, by Country 2020 & 2033
- Table 16: Global Linerless Labels Industry Revenue Million Forecast, by Printing Technology 2020 & 2033
- Table 17: Global Linerless Labels Industry Revenue Million Forecast, by End-user Industry 2020 & 2033
- Table 18: Global Linerless Labels Industry Revenue Million Forecast, by Country 2020 & 2033
Frequently Asked Questions
1. What is the projected Compound Annual Growth Rate (CAGR) of the Linerless Labels Industry?
The projected CAGR is approximately 5.28%.
2. Which companies are prominent players in the Linerless Labels Industry?
Key companies in the market include R R Donnelley & Sons Company, Hub Labels Inc, ProPrint Group, Coveris, Lexit Group AS, Gipako UAB*List Not Exhaustive, Optimum Group, Skanem AS, NAStar Inc, Reflex Labels Ltd, Innovia Films (CCL Industries), SATO Europe GmbH.
3. What are the main segments of the Linerless Labels Industry?
The market segments include Printing Technology, End-user Industry.
4. Can you provide details about the market size?
The market size is estimated to be USD 1.94 Million as of 2022.
5. What are some drivers contributing to market growth?
Increasing Demand for Packaged Foods and Beverages; Increasing Demand for Pharmaceutical Supplies.
6. What are the notable trends driving market growth?
Food and Beverage Expected to Hold the Largest Market Share.
7. Are there any restraints impacting market growth?
Fluctuation in the Prices of Raw Materials.
8. Can you provide examples of recent developments in the market?
Feb 2022 - ProPrintGroup installed a new Ravenwood Com500 Coater. There will also be a new advanced 10-colour EdaleFL3 flexo press. As a result, ProPrint'sLinerless Labels segment now has a total investment of almost EUR 1 million. ProPrintwill becomes a first-class Linerless Labels provider as a result of the transfer, which will greatly increase Linerless Labeling capacity.
9. What pricing options are available for accessing the report?
Pricing options include single-user, multi-user, and enterprise licenses priced at USD 4750, USD 5250, and USD 8750 respectively.
10. Is the market size provided in terms of value or volume?
The market size is provided in terms of value, measured in Million.
11. Are there any specific market keywords associated with the report?
Yes, the market keyword associated with the report is "Linerless Labels Industry," which aids in identifying and referencing the specific market segment covered.
12. How do I determine which pricing option suits my needs best?
The pricing options vary based on user requirements and access needs. Individual users may opt for single-user licenses, while businesses requiring broader access may choose multi-user or enterprise licenses for cost-effective access to the report.
13. Are there any additional resources or data provided in the Linerless Labels Industry report?
While the report offers comprehensive insights, it's advisable to review the specific contents or supplementary materials provided to ascertain if additional resources or data are available.
14. How can I stay updated on further developments or reports in the Linerless Labels Industry?
To stay informed about further developments, trends, and reports in the Linerless Labels Industry, consider subscribing to industry newsletters, following relevant companies and organizations, or regularly checking reputable industry news sources and publications.
Methodology
Step 1 - Identification of Relevant Samples Size from Population Database


Step 2 - Approaches for Defining Global Market Size (Value, Volume* & Price*)

Note*: In applicable scenarios
Step 3 - Data Sources
Primary Research
- Web Analytics
- Survey Reports
- Research Institute
- Latest Research Reports
- Opinion Leaders
Secondary Research
- Annual Reports
- White Paper
- Latest Press Release
- Industry Association
- Paid Database
- Investor Presentations

Step 4 - Data Triangulation
Involves using different sources of information in order to increase the validity of a study
These sources are likely to be stakeholders in a program - participants, other researchers, program staff, other community members, and so on.
Then we put all data in single framework & apply various statistical tools to find out the dynamic on the market.
During the analysis stage, feedback from the stakeholder groups would be compared to determine areas of agreement as well as areas of divergence