


Key Insights
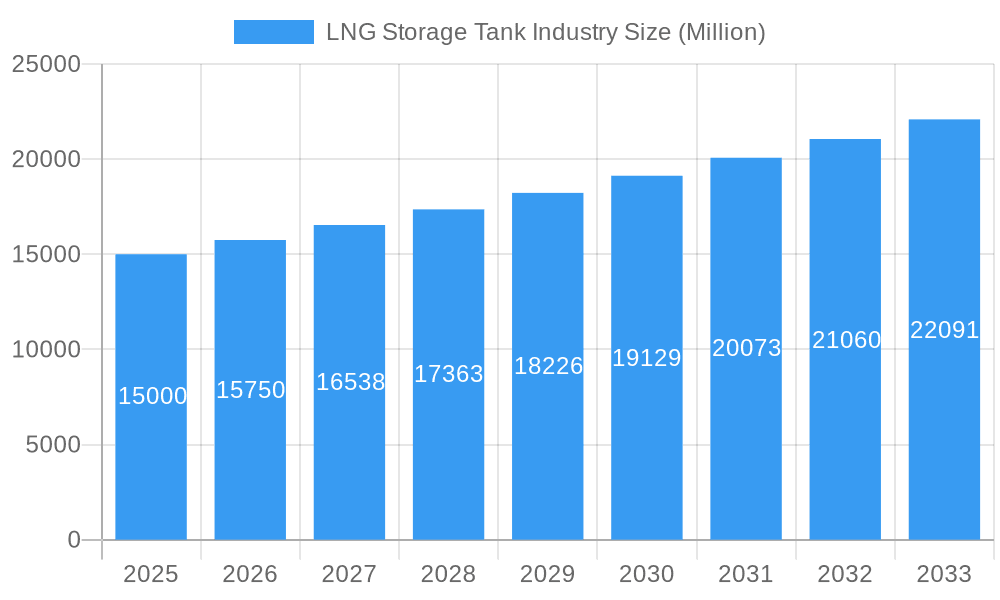
The Liquefied Natural Gas (LNG) Storage Tank market is projected for significant expansion, propelled by escalating global demand for cleaner energy solutions and the continuous development of LNG infrastructure. The market is currently valued at approximately $16.45 billion and is expected to grow at a Compound Annual Growth Rate (CAGR) of 8.23% from 2025 to 2033. Key growth drivers include substantial investments in LNG infrastructure, supportive environmental regulations favoring cleaner energy, and the increasing utilization of LNG in transportation and power generation. Emerging economies, particularly in Asia-Pacific and South America, are vital contributors to this market's upward trajectory.
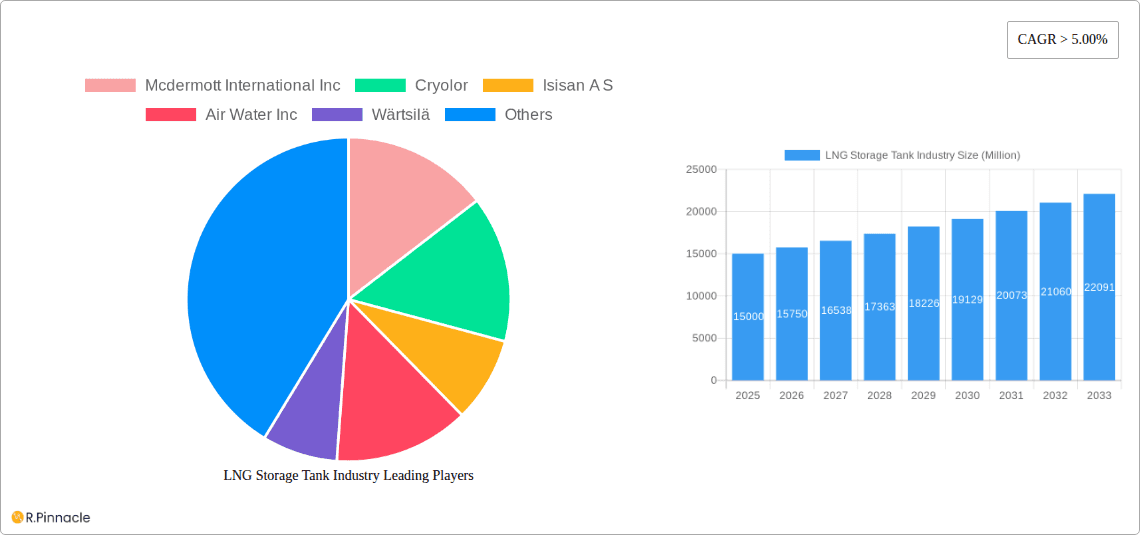
LNG Storage Tank Industry Market Size (In Billion)

Segmentation analysis indicates a strong preference for self-supporting tanks, primarily constructed from steel and 9% nickel steel, owing to their inherent strength and durability. While aluminum alloys are seeing increased adoption due to their lightweight nature and superior corrosion resistance, their higher initial cost remains a consideration.
LNG Storage Tank Industry Company Market Share
Market limitations include the substantial capital investment required for LNG storage tank development, potentially hindering smaller market participants. Volatility in LNG pricing and geopolitical uncertainties in key supply regions also present challenges. Nevertheless, technological advancements in tank design, safety enhancements, and more efficient cryogenic insulation are critical trends defining the industry's evolution. Leading companies such as McDermott International Inc., Cryolor, and Chart Industries are actively pursuing innovation, fostering competition and market dynamism. Geographic analysis highlights robust growth potential in Asia-Pacific and North America, driven by rising energy needs and ongoing infrastructure projects. Strategic initiatives focused on technological innovation and global expansion will be paramount for key players in overcoming market hurdles and capitalizing on growth opportunities throughout the forecast period.
LNG Storage Tank Industry: A Comprehensive Market Report (2019-2033)
This comprehensive report provides an in-depth analysis of the LNG Storage Tank industry, offering invaluable insights for industry professionals, investors, and strategic decision-makers. Covering the period from 2019 to 2033, with a base year of 2025 and a forecast period of 2025-2033, this report unveils the market's dynamics, trends, and future outlook. The report encompasses detailed segmentation analysis across product type and material type, highlighting key players and significant industry developments. Expect detailed data and projections, including market size in Millions and CAGR projections.
LNG Storage Tank Industry Market Structure & Innovation Trends
This section analyzes the competitive landscape of the LNG Storage Tank industry, examining market concentration, key innovation drivers, regulatory frameworks, and prevalent M&A activities. The report delves into the impact of substitute products and evolving end-user demographics on market dynamics.
Market Concentration: The report quantifies market share held by key players such as McDermott International Inc, Cryolor, Isisan A S, Air Water Inc, Wärtsilä, Linde Plc, CIMC Enric, Chart Industries, IHI Corporation, and Inox India, providing a clear picture of the industry's competitive intensity. We project a xx% market concentration for the top 5 players by 2033.
Innovation Drivers: The report identifies key innovation drivers, including advancements in materials science (e.g., the adoption of 9% Nickel Steel and Aluminium Alloys), enhanced design capabilities (Self-Supporting vs. Non-Self-Supporting tanks), and the increasing demand for efficient and safe storage solutions.
Regulatory Frameworks: The report analyzes the impact of international and regional regulations on market growth, highlighting compliance costs and potential future regulatory changes.
M&A Activities: The report assesses the impact of past and predicted mergers and acquisitions (M&A) on market consolidation and competitive dynamics. We estimate that M&A deal values will reach xx Million by 2033.
LNG Storage Tank Industry Market Dynamics & Trends
This section provides a thorough examination of the market’s growth trajectory, identifying key drivers, technological disruptions, evolving consumer preferences, and the competitive dynamics at play. Specific metrics such as CAGR and market penetration are provided, offering a robust understanding of the market's evolution.
The LNG Storage Tank market is experiencing robust growth, driven by the increasing demand for natural gas globally. Factors such as the rising adoption of LNG as a cleaner fuel source and the expansion of LNG infrastructure are significantly contributing to market expansion. Technological advancements, including the development of more efficient and cost-effective storage solutions, are further accelerating market growth. We project a CAGR of xx% during the forecast period (2025-2033), with market penetration expected to reach xx% by 2033. The competitive landscape is characterized by intense rivalry among key players, who are continuously striving to improve their product offerings and expand their market share.
Dominant Regions & Segments in LNG Storage Tank Industry
This section pinpoints the leading regions, countries, and market segments within the LNG Storage Tank industry. Detailed analysis is provided for each segment, including product type (Self-Supporting Tanks, Non-Self-Supporting Tanks) and material type (Steel, 9% Nickel Steel, Aluminium Alloys, Other).
Leading Regions: The report identifies the dominant regions, analyzing factors driving their market leadership. (Specific region details and reasons for dominance will be detailed in the full report).
Leading Segments: The report details the dominance of specific product types and material types. For instance, the high strength-to-weight ratio and superior cryogenic properties of 9% Nickel Steel may contribute to its market dominance over Steel in specific applications. Similarly, self-supporting tanks may enjoy a larger market share due to their inherent advantages in construction and operational simplicity compared to non-self-supporting types. (Further breakdown and specific market share data will be in the complete report).
Key Drivers:
- Economic Policies: Government incentives and investment in LNG infrastructure significantly impact regional market growth.
- Infrastructure Development: The expansion of LNG import and export terminals fuels demand for storage tanks.
- Energy Transition: The global shift towards cleaner energy sources is driving the adoption of LNG.
LNG Storage Tank Industry Product Innovations
This section summarizes recent advancements in LNG storage tank technology, highlighting new product developments and their competitive advantages in the marketplace.
Recent innovations are focused on improving tank efficiency, safety, and cost-effectiveness. This includes advancements in materials science leading to lighter, stronger, and more durable tanks. Furthermore, advancements in tank design and construction techniques are leading to reduced construction time and cost, improving overall market competitiveness. These innovations are crucial in meeting the growing demand for LNG storage capacity and accommodating increasingly stringent safety regulations.
Report Scope & Segmentation Analysis
This section details the market segmentation of the report across product type and material type. Each segment’s growth projections, market size, and competitive dynamics will be thoroughly analyzed.
Product Type:
- Self-Supporting Tanks: This segment will explore the market size, growth trajectory, and competitive landscape for self-supporting LNG storage tanks. Specific growth projections will be provided for the forecast period.
- Non-Self-Supporting Tanks: Similar detailed analysis will be applied to the non-self-supporting tank segment.
Material Type:
- Steel: This section will cover market size, growth rates, and competitive aspects of Steel-based LNG tanks.
- 9% Nickel Steel: The analysis will encompass the advantages, market penetration, and future prospects of 9% Nickel Steel in the LNG storage tank market.
- Aluminum Alloys: This segment will evaluate the market potential and challenges of using Aluminum Alloys in LNG storage tank construction.
- Other: This section will cover any other relevant material types used in LNG storage tank manufacturing.
Key Drivers of LNG Storage Tank Industry Growth
This section outlines the key factors driving the growth of the LNG storage tank industry.
The increasing global demand for natural gas, driven by its role as a transition fuel and a cleaner alternative to coal, is a primary driver. Government support for LNG infrastructure development, including subsidies and tax incentives, further accelerates market expansion. Technological advancements, leading to more efficient and cost-effective storage solutions, are also instrumental in driving market growth. Finally, rising energy security concerns, pushing nations to diversify their energy sources, contribute significantly to market expansion.
Challenges in the LNG Storage Tank Industry Sector
This section identifies the key challenges and restraints impacting the growth of the LNG storage tank industry.
Stringent safety and environmental regulations pose significant challenges, increasing compliance costs. Supply chain disruptions and fluctuations in raw material prices can impact production costs and profitability. Furthermore, intense competition among established players and the emergence of new entrants can exert downward pressure on prices. These factors can constrain market growth if not addressed proactively. We project that these factors will negatively impact market growth by approximately xx% by 2033 if not effectively managed.
Emerging Opportunities in LNG Storage Tank Industry
This section highlights the key emerging trends and opportunities within the LNG storage tank industry.
The growing adoption of LNG as a fuel for transportation (e.g., LNG-powered ships and trucks) and the expansion of LNG bunkering infrastructure represent significant opportunities. Technological advancements, such as the development of innovative materials and tank designs, will create new market niches. Furthermore, the increasing focus on carbon capture and storage technologies provides opportunities for specialized LNG storage solutions.
Leading Players in the LNG Storage Tank Industry Market
- McDermott International Inc
- Cryolor
- Isisan A S
- Air Water Inc
- Wärtsilä
- Linde Plc
- CIMC Enric
- Chart Industries
- IHI Corporation
- Inox India
Key Developments in LNG Storage Tank Industry
April 2022: Linde Plc announced the expansion of its La Porte, Texas facility, doubling its merchant liquid production capacity by 2024. This expansion will significantly increase the supply of LNG and related products to various sectors in the U.S. Gulf Coast.
May 2022: CIMC Enric successfully developed China's first large-scale liquid helium storage tank container, marking a significant milestone in domestic high-end manufacturing of cryogenic storage and transportation equipment.
Future Outlook for LNG Storage Tank Industry Market
The LNG storage tank industry is poised for continued growth, driven by the global transition to cleaner energy sources and increasing demand for natural gas. Technological advancements and strategic partnerships will play a crucial role in shaping the future market landscape. The industry's future prospects are bright, with significant potential for expansion in both established and emerging markets. However, successful navigation of regulatory hurdles and supply chain challenges will remain crucial for sustained growth.
LNG Storage Tank Industry Segmentation
-
1. Product Type
- 1.1. Self-Supporting Tanks
- 1.2. Non-Self Supporting Tanks
-
2. Material Type
- 2.1. Steel
- 2.2. 9% Nickel Steel
- 2.3. Aluminium Alloys
- 2.4. Other
LNG Storage Tank Industry Segmentation By Geography
-
1. North America
- 1.1. US
- 1.2. Canada
- 1.3. Mexico
-
2. Europe
- 2.1. Germany
- 2.2. UK
- 2.3. France
- 2.4. Russia
- 2.5. Spain
- 2.6. Rest of Europe
-
3. Asia Pacific
- 3.1. India
- 3.2. China
- 3.3. Japan
- 3.4. Singapore
- 3.5. Malaysia
- 3.6. South Korea
- 3.7. Australia
- 3.8. Rest of Asia Pacific
-
4. South America
- 4.1. Brazil
- 4.2. Argentina
- 4.3. Rest of South America
- 5. Middle East
-
6. UAE
- 6.1. Saudi Arabia
- 6.2. South Africa
- 6.3. Rest of Middle East
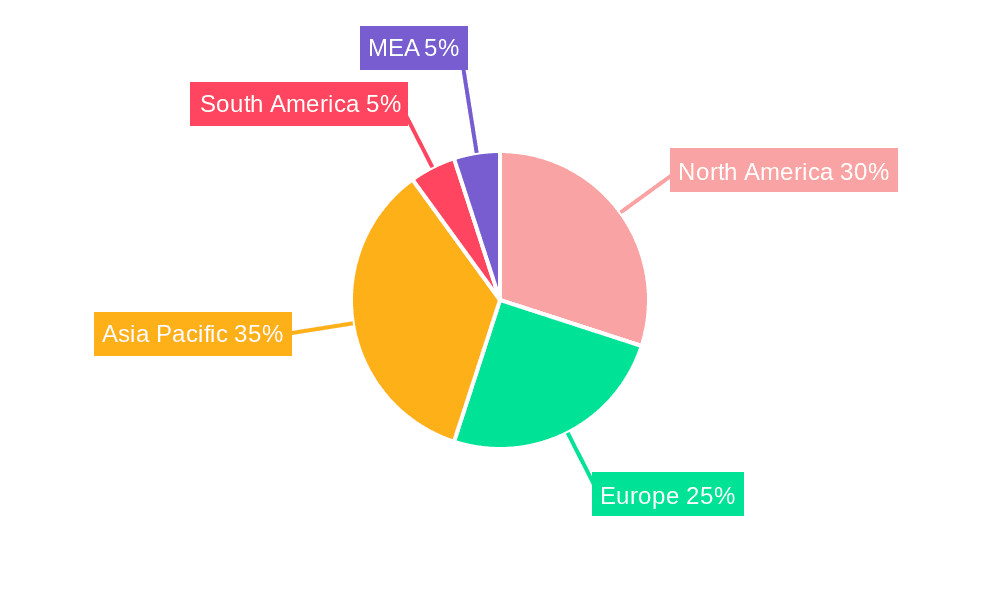
LNG Storage Tank Industry Regional Market Share
Geographic Coverage of LNG Storage Tank Industry
LNG Storage Tank Industry REPORT HIGHLIGHTS
| Aspects | Details |
|---|---|
| Study Period | 2020-2034 |
| Base Year | 2025 |
| Estimated Year | 2026 |
| Forecast Period | 2026-2034 |
| Historical Period | 2020-2025 |
| Growth Rate | CAGR of 8.23% from 2020-2034 |
| Segmentation |
|
Table of Contents
- 1. Introduction
- 1.1. Research Scope
- 1.2. Market Segmentation
- 1.3. Research Methodology
- 1.4. Definitions and Assumptions
- 2. Executive Summary
- 2.1. Introduction
- 3. Market Dynamics
- 3.1. Introduction
- 3.2. Market Drivers
- 3.2.1. 4.; Increasing Demand From Refining And Industrial Sector4.; Favourable Government Policies
- 3.3. Market Restrains
- 3.3.1. 4.; High Capital Costs For Hydrogen Energy Storage
- 3.4. Market Trends
- 3.4.1. Increasing demand for LNG
- 4. Market Factor Analysis
- 4.1. Porters Five Forces
- 4.2. Supply/Value Chain
- 4.3. PESTEL analysis
- 4.4. Market Entropy
- 4.5. Patent/Trademark Analysis
- 5. Global LNG Storage Tank Industry Analysis, Insights and Forecast, 2020-2032
- 5.1. Market Analysis, Insights and Forecast - by Product Type
- 5.1.1. Self-Supporting Tanks
- 5.1.2. Non-Self Supporting Tanks
- 5.2. Market Analysis, Insights and Forecast - by Material Type
- 5.2.1. Steel
- 5.2.2. 9% Nickel Steel
- 5.2.3. Aluminium Alloys
- 5.2.4. Other
- 5.3. Market Analysis, Insights and Forecast - by Region
- 5.3.1. North America
- 5.3.2. Europe
- 5.3.3. Asia Pacific
- 5.3.4. South America
- 5.3.5. Middle East
- 5.3.6. UAE
- 5.1. Market Analysis, Insights and Forecast - by Product Type
- 6. North America LNG Storage Tank Industry Analysis, Insights and Forecast, 2020-2032
- 6.1. Market Analysis, Insights and Forecast - by Product Type
- 6.1.1. Self-Supporting Tanks
- 6.1.2. Non-Self Supporting Tanks
- 6.2. Market Analysis, Insights and Forecast - by Material Type
- 6.2.1. Steel
- 6.2.2. 9% Nickel Steel
- 6.2.3. Aluminium Alloys
- 6.2.4. Other
- 6.1. Market Analysis, Insights and Forecast - by Product Type
- 7. Europe LNG Storage Tank Industry Analysis, Insights and Forecast, 2020-2032
- 7.1. Market Analysis, Insights and Forecast - by Product Type
- 7.1.1. Self-Supporting Tanks
- 7.1.2. Non-Self Supporting Tanks
- 7.2. Market Analysis, Insights and Forecast - by Material Type
- 7.2.1. Steel
- 7.2.2. 9% Nickel Steel
- 7.2.3. Aluminium Alloys
- 7.2.4. Other
- 7.1. Market Analysis, Insights and Forecast - by Product Type
- 8. Asia Pacific LNG Storage Tank Industry Analysis, Insights and Forecast, 2020-2032
- 8.1. Market Analysis, Insights and Forecast - by Product Type
- 8.1.1. Self-Supporting Tanks
- 8.1.2. Non-Self Supporting Tanks
- 8.2. Market Analysis, Insights and Forecast - by Material Type
- 8.2.1. Steel
- 8.2.2. 9% Nickel Steel
- 8.2.3. Aluminium Alloys
- 8.2.4. Other
- 8.1. Market Analysis, Insights and Forecast - by Product Type
- 9. South America LNG Storage Tank Industry Analysis, Insights and Forecast, 2020-2032
- 9.1. Market Analysis, Insights and Forecast - by Product Type
- 9.1.1. Self-Supporting Tanks
- 9.1.2. Non-Self Supporting Tanks
- 9.2. Market Analysis, Insights and Forecast - by Material Type
- 9.2.1. Steel
- 9.2.2. 9% Nickel Steel
- 9.2.3. Aluminium Alloys
- 9.2.4. Other
- 9.1. Market Analysis, Insights and Forecast - by Product Type
- 10. Middle East LNG Storage Tank Industry Analysis, Insights and Forecast, 2020-2032
- 10.1. Market Analysis, Insights and Forecast - by Product Type
- 10.1.1. Self-Supporting Tanks
- 10.1.2. Non-Self Supporting Tanks
- 10.2. Market Analysis, Insights and Forecast - by Material Type
- 10.2.1. Steel
- 10.2.2. 9% Nickel Steel
- 10.2.3. Aluminium Alloys
- 10.2.4. Other
- 10.1. Market Analysis, Insights and Forecast - by Product Type
- 11. UAE LNG Storage Tank Industry Analysis, Insights and Forecast, 2020-2032
- 11.1. Market Analysis, Insights and Forecast - by Product Type
- 11.1.1. Self-Supporting Tanks
- 11.1.2. Non-Self Supporting Tanks
- 11.2. Market Analysis, Insights and Forecast - by Material Type
- 11.2.1. Steel
- 11.2.2. 9% Nickel Steel
- 11.2.3. Aluminium Alloys
- 11.2.4. Other
- 11.1. Market Analysis, Insights and Forecast - by Product Type
- 12. Competitive Analysis
- 12.1. Global Market Share Analysis 2025
- 12.2. Company Profiles
- 12.2.1 Mcdermott International Inc
- 12.2.1.1. Overview
- 12.2.1.2. Products
- 12.2.1.3. SWOT Analysis
- 12.2.1.4. Recent Developments
- 12.2.1.5. Financials (Based on Availability)
- 12.2.2 Cryolor
- 12.2.2.1. Overview
- 12.2.2.2. Products
- 12.2.2.3. SWOT Analysis
- 12.2.2.4. Recent Developments
- 12.2.2.5. Financials (Based on Availability)
- 12.2.3 Isisan A S
- 12.2.3.1. Overview
- 12.2.3.2. Products
- 12.2.3.3. SWOT Analysis
- 12.2.3.4. Recent Developments
- 12.2.3.5. Financials (Based on Availability)
- 12.2.4 Air Water Inc
- 12.2.4.1. Overview
- 12.2.4.2. Products
- 12.2.4.3. SWOT Analysis
- 12.2.4.4. Recent Developments
- 12.2.4.5. Financials (Based on Availability)
- 12.2.5 Wärtsilä
- 12.2.5.1. Overview
- 12.2.5.2. Products
- 12.2.5.3. SWOT Analysis
- 12.2.5.4. Recent Developments
- 12.2.5.5. Financials (Based on Availability)
- 12.2.6 Linde Plc
- 12.2.6.1. Overview
- 12.2.6.2. Products
- 12.2.6.3. SWOT Analysis
- 12.2.6.4. Recent Developments
- 12.2.6.5. Financials (Based on Availability)
- 12.2.7 Cimc Enric
- 12.2.7.1. Overview
- 12.2.7.2. Products
- 12.2.7.3. SWOT Analysis
- 12.2.7.4. Recent Developments
- 12.2.7.5. Financials (Based on Availability)
- 12.2.8 Chart Industries
- 12.2.8.1. Overview
- 12.2.8.2. Products
- 12.2.8.3. SWOT Analysis
- 12.2.8.4. Recent Developments
- 12.2.8.5. Financials (Based on Availability)
- 12.2.9 IHI Corporation
- 12.2.9.1. Overview
- 12.2.9.2. Products
- 12.2.9.3. SWOT Analysis
- 12.2.9.4. Recent Developments
- 12.2.9.5. Financials (Based on Availability)
- 12.2.10 Inox India
- 12.2.10.1. Overview
- 12.2.10.2. Products
- 12.2.10.3. SWOT Analysis
- 12.2.10.4. Recent Developments
- 12.2.10.5. Financials (Based on Availability)
- 12.2.1 Mcdermott International Inc
List of Figures
- Figure 1: Global LNG Storage Tank Industry Revenue Breakdown (billion, %) by Region 2025 & 2033
- Figure 2: Global LNG Storage Tank Industry Volume Breakdown (Litre, %) by Region 2025 & 2033
- Figure 3: North America LNG Storage Tank Industry Revenue (billion), by Product Type 2025 & 2033
- Figure 4: North America LNG Storage Tank Industry Volume (Litre), by Product Type 2025 & 2033
- Figure 5: North America LNG Storage Tank Industry Revenue Share (%), by Product Type 2025 & 2033
- Figure 6: North America LNG Storage Tank Industry Volume Share (%), by Product Type 2025 & 2033
- Figure 7: North America LNG Storage Tank Industry Revenue (billion), by Material Type 2025 & 2033
- Figure 8: North America LNG Storage Tank Industry Volume (Litre), by Material Type 2025 & 2033
- Figure 9: North America LNG Storage Tank Industry Revenue Share (%), by Material Type 2025 & 2033
- Figure 10: North America LNG Storage Tank Industry Volume Share (%), by Material Type 2025 & 2033
- Figure 11: North America LNG Storage Tank Industry Revenue (billion), by Country 2025 & 2033
- Figure 12: North America LNG Storage Tank Industry Volume (Litre), by Country 2025 & 2033
- Figure 13: North America LNG Storage Tank Industry Revenue Share (%), by Country 2025 & 2033
- Figure 14: North America LNG Storage Tank Industry Volume Share (%), by Country 2025 & 2033
- Figure 15: Europe LNG Storage Tank Industry Revenue (billion), by Product Type 2025 & 2033
- Figure 16: Europe LNG Storage Tank Industry Volume (Litre), by Product Type 2025 & 2033
- Figure 17: Europe LNG Storage Tank Industry Revenue Share (%), by Product Type 2025 & 2033
- Figure 18: Europe LNG Storage Tank Industry Volume Share (%), by Product Type 2025 & 2033
- Figure 19: Europe LNG Storage Tank Industry Revenue (billion), by Material Type 2025 & 2033
- Figure 20: Europe LNG Storage Tank Industry Volume (Litre), by Material Type 2025 & 2033
- Figure 21: Europe LNG Storage Tank Industry Revenue Share (%), by Material Type 2025 & 2033
- Figure 22: Europe LNG Storage Tank Industry Volume Share (%), by Material Type 2025 & 2033
- Figure 23: Europe LNG Storage Tank Industry Revenue (billion), by Country 2025 & 2033
- Figure 24: Europe LNG Storage Tank Industry Volume (Litre), by Country 2025 & 2033
- Figure 25: Europe LNG Storage Tank Industry Revenue Share (%), by Country 2025 & 2033
- Figure 26: Europe LNG Storage Tank Industry Volume Share (%), by Country 2025 & 2033
- Figure 27: Asia Pacific LNG Storage Tank Industry Revenue (billion), by Product Type 2025 & 2033
- Figure 28: Asia Pacific LNG Storage Tank Industry Volume (Litre), by Product Type 2025 & 2033
- Figure 29: Asia Pacific LNG Storage Tank Industry Revenue Share (%), by Product Type 2025 & 2033
- Figure 30: Asia Pacific LNG Storage Tank Industry Volume Share (%), by Product Type 2025 & 2033
- Figure 31: Asia Pacific LNG Storage Tank Industry Revenue (billion), by Material Type 2025 & 2033
- Figure 32: Asia Pacific LNG Storage Tank Industry Volume (Litre), by Material Type 2025 & 2033
- Figure 33: Asia Pacific LNG Storage Tank Industry Revenue Share (%), by Material Type 2025 & 2033
- Figure 34: Asia Pacific LNG Storage Tank Industry Volume Share (%), by Material Type 2025 & 2033
- Figure 35: Asia Pacific LNG Storage Tank Industry Revenue (billion), by Country 2025 & 2033
- Figure 36: Asia Pacific LNG Storage Tank Industry Volume (Litre), by Country 2025 & 2033
- Figure 37: Asia Pacific LNG Storage Tank Industry Revenue Share (%), by Country 2025 & 2033
- Figure 38: Asia Pacific LNG Storage Tank Industry Volume Share (%), by Country 2025 & 2033
- Figure 39: South America LNG Storage Tank Industry Revenue (billion), by Product Type 2025 & 2033
- Figure 40: South America LNG Storage Tank Industry Volume (Litre), by Product Type 2025 & 2033
- Figure 41: South America LNG Storage Tank Industry Revenue Share (%), by Product Type 2025 & 2033
- Figure 42: South America LNG Storage Tank Industry Volume Share (%), by Product Type 2025 & 2033
- Figure 43: South America LNG Storage Tank Industry Revenue (billion), by Material Type 2025 & 2033
- Figure 44: South America LNG Storage Tank Industry Volume (Litre), by Material Type 2025 & 2033
- Figure 45: South America LNG Storage Tank Industry Revenue Share (%), by Material Type 2025 & 2033
- Figure 46: South America LNG Storage Tank Industry Volume Share (%), by Material Type 2025 & 2033
- Figure 47: South America LNG Storage Tank Industry Revenue (billion), by Country 2025 & 2033
- Figure 48: South America LNG Storage Tank Industry Volume (Litre), by Country 2025 & 2033
- Figure 49: South America LNG Storage Tank Industry Revenue Share (%), by Country 2025 & 2033
- Figure 50: South America LNG Storage Tank Industry Volume Share (%), by Country 2025 & 2033
- Figure 51: Middle East LNG Storage Tank Industry Revenue (billion), by Product Type 2025 & 2033
- Figure 52: Middle East LNG Storage Tank Industry Volume (Litre), by Product Type 2025 & 2033
- Figure 53: Middle East LNG Storage Tank Industry Revenue Share (%), by Product Type 2025 & 2033
- Figure 54: Middle East LNG Storage Tank Industry Volume Share (%), by Product Type 2025 & 2033
- Figure 55: Middle East LNG Storage Tank Industry Revenue (billion), by Material Type 2025 & 2033
- Figure 56: Middle East LNG Storage Tank Industry Volume (Litre), by Material Type 2025 & 2033
- Figure 57: Middle East LNG Storage Tank Industry Revenue Share (%), by Material Type 2025 & 2033
- Figure 58: Middle East LNG Storage Tank Industry Volume Share (%), by Material Type 2025 & 2033
- Figure 59: Middle East LNG Storage Tank Industry Revenue (billion), by Country 2025 & 2033
- Figure 60: Middle East LNG Storage Tank Industry Volume (Litre), by Country 2025 & 2033
- Figure 61: Middle East LNG Storage Tank Industry Revenue Share (%), by Country 2025 & 2033
- Figure 62: Middle East LNG Storage Tank Industry Volume Share (%), by Country 2025 & 2033
- Figure 63: UAE LNG Storage Tank Industry Revenue (billion), by Product Type 2025 & 2033
- Figure 64: UAE LNG Storage Tank Industry Volume (Litre), by Product Type 2025 & 2033
- Figure 65: UAE LNG Storage Tank Industry Revenue Share (%), by Product Type 2025 & 2033
- Figure 66: UAE LNG Storage Tank Industry Volume Share (%), by Product Type 2025 & 2033
- Figure 67: UAE LNG Storage Tank Industry Revenue (billion), by Material Type 2025 & 2033
- Figure 68: UAE LNG Storage Tank Industry Volume (Litre), by Material Type 2025 & 2033
- Figure 69: UAE LNG Storage Tank Industry Revenue Share (%), by Material Type 2025 & 2033
- Figure 70: UAE LNG Storage Tank Industry Volume Share (%), by Material Type 2025 & 2033
- Figure 71: UAE LNG Storage Tank Industry Revenue (billion), by Country 2025 & 2033
- Figure 72: UAE LNG Storage Tank Industry Volume (Litre), by Country 2025 & 2033
- Figure 73: UAE LNG Storage Tank Industry Revenue Share (%), by Country 2025 & 2033
- Figure 74: UAE LNG Storage Tank Industry Volume Share (%), by Country 2025 & 2033
List of Tables
- Table 1: Global LNG Storage Tank Industry Revenue billion Forecast, by Product Type 2020 & 2033
- Table 2: Global LNG Storage Tank Industry Volume Litre Forecast, by Product Type 2020 & 2033
- Table 3: Global LNG Storage Tank Industry Revenue billion Forecast, by Material Type 2020 & 2033
- Table 4: Global LNG Storage Tank Industry Volume Litre Forecast, by Material Type 2020 & 2033
- Table 5: Global LNG Storage Tank Industry Revenue billion Forecast, by Region 2020 & 2033
- Table 6: Global LNG Storage Tank Industry Volume Litre Forecast, by Region 2020 & 2033
- Table 7: Global LNG Storage Tank Industry Revenue billion Forecast, by Product Type 2020 & 2033
- Table 8: Global LNG Storage Tank Industry Volume Litre Forecast, by Product Type 2020 & 2033
- Table 9: Global LNG Storage Tank Industry Revenue billion Forecast, by Material Type 2020 & 2033
- Table 10: Global LNG Storage Tank Industry Volume Litre Forecast, by Material Type 2020 & 2033
- Table 11: Global LNG Storage Tank Industry Revenue billion Forecast, by Country 2020 & 2033
- Table 12: Global LNG Storage Tank Industry Volume Litre Forecast, by Country 2020 & 2033
- Table 13: US LNG Storage Tank Industry Revenue (billion) Forecast, by Application 2020 & 2033
- Table 14: US LNG Storage Tank Industry Volume (Litre) Forecast, by Application 2020 & 2033
- Table 15: Canada LNG Storage Tank Industry Revenue (billion) Forecast, by Application 2020 & 2033
- Table 16: Canada LNG Storage Tank Industry Volume (Litre) Forecast, by Application 2020 & 2033
- Table 17: Mexico LNG Storage Tank Industry Revenue (billion) Forecast, by Application 2020 & 2033
- Table 18: Mexico LNG Storage Tank Industry Volume (Litre) Forecast, by Application 2020 & 2033
- Table 19: Global LNG Storage Tank Industry Revenue billion Forecast, by Product Type 2020 & 2033
- Table 20: Global LNG Storage Tank Industry Volume Litre Forecast, by Product Type 2020 & 2033
- Table 21: Global LNG Storage Tank Industry Revenue billion Forecast, by Material Type 2020 & 2033
- Table 22: Global LNG Storage Tank Industry Volume Litre Forecast, by Material Type 2020 & 2033
- Table 23: Global LNG Storage Tank Industry Revenue billion Forecast, by Country 2020 & 2033
- Table 24: Global LNG Storage Tank Industry Volume Litre Forecast, by Country 2020 & 2033
- Table 25: Germany LNG Storage Tank Industry Revenue (billion) Forecast, by Application 2020 & 2033
- Table 26: Germany LNG Storage Tank Industry Volume (Litre) Forecast, by Application 2020 & 2033
- Table 27: UK LNG Storage Tank Industry Revenue (billion) Forecast, by Application 2020 & 2033
- Table 28: UK LNG Storage Tank Industry Volume (Litre) Forecast, by Application 2020 & 2033
- Table 29: France LNG Storage Tank Industry Revenue (billion) Forecast, by Application 2020 & 2033
- Table 30: France LNG Storage Tank Industry Volume (Litre) Forecast, by Application 2020 & 2033
- Table 31: Russia LNG Storage Tank Industry Revenue (billion) Forecast, by Application 2020 & 2033
- Table 32: Russia LNG Storage Tank Industry Volume (Litre) Forecast, by Application 2020 & 2033
- Table 33: Spain LNG Storage Tank Industry Revenue (billion) Forecast, by Application 2020 & 2033
- Table 34: Spain LNG Storage Tank Industry Volume (Litre) Forecast, by Application 2020 & 2033
- Table 35: Rest of Europe LNG Storage Tank Industry Revenue (billion) Forecast, by Application 2020 & 2033
- Table 36: Rest of Europe LNG Storage Tank Industry Volume (Litre) Forecast, by Application 2020 & 2033
- Table 37: Global LNG Storage Tank Industry Revenue billion Forecast, by Product Type 2020 & 2033
- Table 38: Global LNG Storage Tank Industry Volume Litre Forecast, by Product Type 2020 & 2033
- Table 39: Global LNG Storage Tank Industry Revenue billion Forecast, by Material Type 2020 & 2033
- Table 40: Global LNG Storage Tank Industry Volume Litre Forecast, by Material Type 2020 & 2033
- Table 41: Global LNG Storage Tank Industry Revenue billion Forecast, by Country 2020 & 2033
- Table 42: Global LNG Storage Tank Industry Volume Litre Forecast, by Country 2020 & 2033
- Table 43: India LNG Storage Tank Industry Revenue (billion) Forecast, by Application 2020 & 2033
- Table 44: India LNG Storage Tank Industry Volume (Litre) Forecast, by Application 2020 & 2033
- Table 45: China LNG Storage Tank Industry Revenue (billion) Forecast, by Application 2020 & 2033
- Table 46: China LNG Storage Tank Industry Volume (Litre) Forecast, by Application 2020 & 2033
- Table 47: Japan LNG Storage Tank Industry Revenue (billion) Forecast, by Application 2020 & 2033
- Table 48: Japan LNG Storage Tank Industry Volume (Litre) Forecast, by Application 2020 & 2033
- Table 49: Singapore LNG Storage Tank Industry Revenue (billion) Forecast, by Application 2020 & 2033
- Table 50: Singapore LNG Storage Tank Industry Volume (Litre) Forecast, by Application 2020 & 2033
- Table 51: Malaysia LNG Storage Tank Industry Revenue (billion) Forecast, by Application 2020 & 2033
- Table 52: Malaysia LNG Storage Tank Industry Volume (Litre) Forecast, by Application 2020 & 2033
- Table 53: South Korea LNG Storage Tank Industry Revenue (billion) Forecast, by Application 2020 & 2033
- Table 54: South Korea LNG Storage Tank Industry Volume (Litre) Forecast, by Application 2020 & 2033
- Table 55: Australia LNG Storage Tank Industry Revenue (billion) Forecast, by Application 2020 & 2033
- Table 56: Australia LNG Storage Tank Industry Volume (Litre) Forecast, by Application 2020 & 2033
- Table 57: Rest of Asia Pacific LNG Storage Tank Industry Revenue (billion) Forecast, by Application 2020 & 2033
- Table 58: Rest of Asia Pacific LNG Storage Tank Industry Volume (Litre) Forecast, by Application 2020 & 2033
- Table 59: Global LNG Storage Tank Industry Revenue billion Forecast, by Product Type 2020 & 2033
- Table 60: Global LNG Storage Tank Industry Volume Litre Forecast, by Product Type 2020 & 2033
- Table 61: Global LNG Storage Tank Industry Revenue billion Forecast, by Material Type 2020 & 2033
- Table 62: Global LNG Storage Tank Industry Volume Litre Forecast, by Material Type 2020 & 2033
- Table 63: Global LNG Storage Tank Industry Revenue billion Forecast, by Country 2020 & 2033
- Table 64: Global LNG Storage Tank Industry Volume Litre Forecast, by Country 2020 & 2033
- Table 65: Brazil LNG Storage Tank Industry Revenue (billion) Forecast, by Application 2020 & 2033
- Table 66: Brazil LNG Storage Tank Industry Volume (Litre) Forecast, by Application 2020 & 2033
- Table 67: Argentina LNG Storage Tank Industry Revenue (billion) Forecast, by Application 2020 & 2033
- Table 68: Argentina LNG Storage Tank Industry Volume (Litre) Forecast, by Application 2020 & 2033
- Table 69: Rest of South America LNG Storage Tank Industry Revenue (billion) Forecast, by Application 2020 & 2033
- Table 70: Rest of South America LNG Storage Tank Industry Volume (Litre) Forecast, by Application 2020 & 2033
- Table 71: Global LNG Storage Tank Industry Revenue billion Forecast, by Product Type 2020 & 2033
- Table 72: Global LNG Storage Tank Industry Volume Litre Forecast, by Product Type 2020 & 2033
- Table 73: Global LNG Storage Tank Industry Revenue billion Forecast, by Material Type 2020 & 2033
- Table 74: Global LNG Storage Tank Industry Volume Litre Forecast, by Material Type 2020 & 2033
- Table 75: Global LNG Storage Tank Industry Revenue billion Forecast, by Country 2020 & 2033
- Table 76: Global LNG Storage Tank Industry Volume Litre Forecast, by Country 2020 & 2033
- Table 77: Global LNG Storage Tank Industry Revenue billion Forecast, by Product Type 2020 & 2033
- Table 78: Global LNG Storage Tank Industry Volume Litre Forecast, by Product Type 2020 & 2033
- Table 79: Global LNG Storage Tank Industry Revenue billion Forecast, by Material Type 2020 & 2033
- Table 80: Global LNG Storage Tank Industry Volume Litre Forecast, by Material Type 2020 & 2033
- Table 81: Global LNG Storage Tank Industry Revenue billion Forecast, by Country 2020 & 2033
- Table 82: Global LNG Storage Tank Industry Volume Litre Forecast, by Country 2020 & 2033
- Table 83: Saudi Arabia LNG Storage Tank Industry Revenue (billion) Forecast, by Application 2020 & 2033
- Table 84: Saudi Arabia LNG Storage Tank Industry Volume (Litre) Forecast, by Application 2020 & 2033
- Table 85: South Africa LNG Storage Tank Industry Revenue (billion) Forecast, by Application 2020 & 2033
- Table 86: South Africa LNG Storage Tank Industry Volume (Litre) Forecast, by Application 2020 & 2033
- Table 87: Rest of Middle East LNG Storage Tank Industry Revenue (billion) Forecast, by Application 2020 & 2033
- Table 88: Rest of Middle East LNG Storage Tank Industry Volume (Litre) Forecast, by Application 2020 & 2033
Frequently Asked Questions
1. What is the projected Compound Annual Growth Rate (CAGR) of the LNG Storage Tank Industry?
The projected CAGR is approximately 8.23%.
2. Which companies are prominent players in the LNG Storage Tank Industry?
Key companies in the market include Mcdermott International Inc, Cryolor, Isisan A S, Air Water Inc, Wärtsilä, Linde Plc, Cimc Enric, Chart Industries, IHI Corporation, Inox India.
3. What are the main segments of the LNG Storage Tank Industry?
The market segments include Product Type, Material Type.
4. Can you provide details about the market size?
The market size is estimated to be USD 16.45 billion as of 2022.
5. What are some drivers contributing to market growth?
4.; Increasing Demand From Refining And Industrial Sector4.; Favourable Government Policies.
6. What are the notable trends driving market growth?
Increasing demand for LNG.
7. Are there any restraints impacting market growth?
4.; High Capital Costs For Hydrogen Energy Storage.
8. Can you provide examples of recent developments in the market?
On 13 April 2022, Linde announced that it is expanding its La Porte, Texas, facility, effectively doubling the facility's merchant liquid production capacity. The increased capacity will help Linde to meet growing demand from the petrochemicals, clean energy, manufacturing, food and aerospace sectors in the U.S. Gulf Coast and is estimated to start by 2024. The expansion will also supply Linde's existing Gulf Coast pipeline system, which includes nitrogen and oxygen pipelines extending from the Houston ship channel south to Freeport, Texas.
9. What pricing options are available for accessing the report?
Pricing options include single-user, multi-user, and enterprise licenses priced at USD 4750, USD 5250, and USD 8750 respectively.
10. Is the market size provided in terms of value or volume?
The market size is provided in terms of value, measured in billion and volume, measured in Litre.
11. Are there any specific market keywords associated with the report?
Yes, the market keyword associated with the report is "LNG Storage Tank Industry," which aids in identifying and referencing the specific market segment covered.
12. How do I determine which pricing option suits my needs best?
The pricing options vary based on user requirements and access needs. Individual users may opt for single-user licenses, while businesses requiring broader access may choose multi-user or enterprise licenses for cost-effective access to the report.
13. Are there any additional resources or data provided in the LNG Storage Tank Industry report?
While the report offers comprehensive insights, it's advisable to review the specific contents or supplementary materials provided to ascertain if additional resources or data are available.
14. How can I stay updated on further developments or reports in the LNG Storage Tank Industry?
To stay informed about further developments, trends, and reports in the LNG Storage Tank Industry, consider subscribing to industry newsletters, following relevant companies and organizations, or regularly checking reputable industry news sources and publications.
Methodology
Step 1 - Identification of Relevant Samples Size from Population Database


Step 2 - Approaches for Defining Global Market Size (Value, Volume* & Price*)

Note*: In applicable scenarios
Step 3 - Data Sources
Primary Research
- Web Analytics
- Survey Reports
- Research Institute
- Latest Research Reports
- Opinion Leaders
Secondary Research
- Annual Reports
- White Paper
- Latest Press Release
- Industry Association
- Paid Database
- Investor Presentations

Step 4 - Data Triangulation
Involves using different sources of information in order to increase the validity of a study
These sources are likely to be stakeholders in a program - participants, other researchers, program staff, other community members, and so on.
Then we put all data in single framework & apply various statistical tools to find out the dynamic on the market.
During the analysis stage, feedback from the stakeholder groups would be compared to determine areas of agreement as well as areas of divergence