
Key Insights
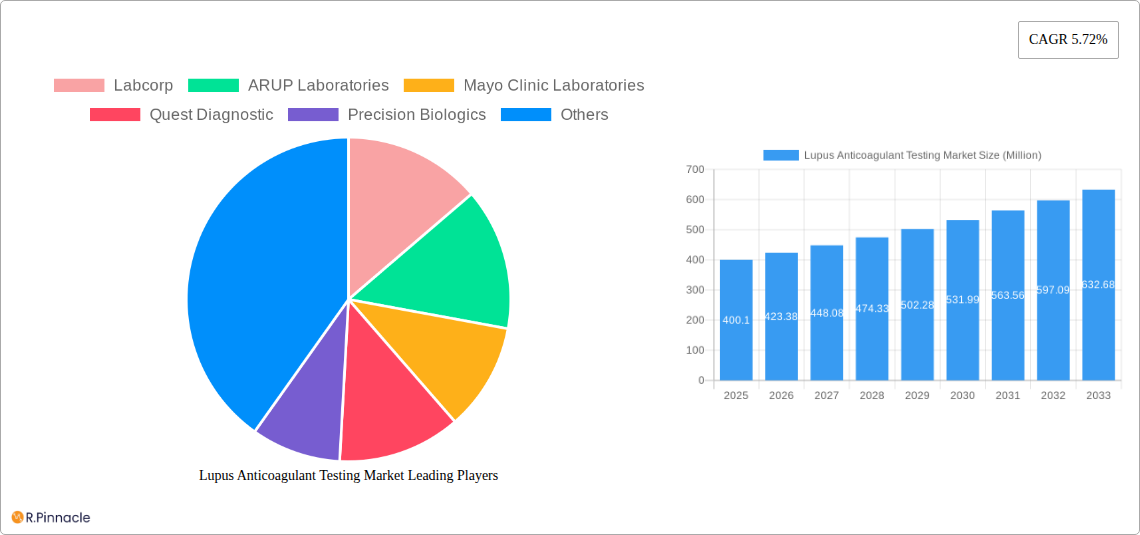
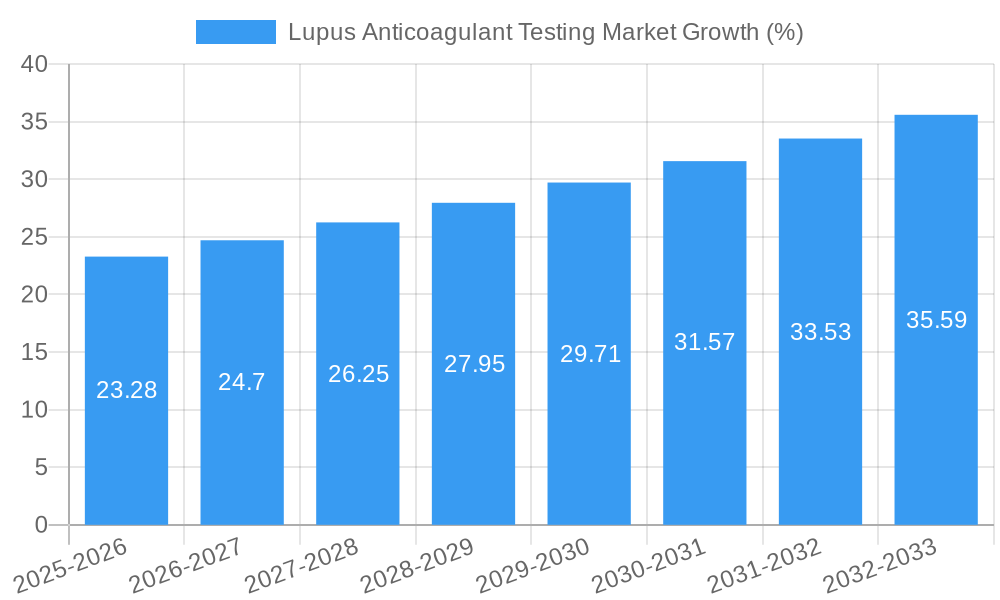
The Lupus Anticoagulant (LA) Testing market, valued at $400.10 million in 2025, is projected to experience robust growth, driven by the increasing prevalence of autoimmune disorders like lupus and the rising demand for accurate diagnostic tools. The market's Compound Annual Growth Rate (CAGR) of 5.72% from 2025 to 2033 indicates a significant expansion, propelled by advancements in testing technologies offering improved sensitivity and specificity. This allows for earlier and more accurate diagnosis, leading to timely interventions and improved patient outcomes. Furthermore, the growing awareness among healthcare professionals and patients about the importance of early diagnosis and management of LA-related conditions is contributing to the market's growth. Increased research and development efforts focused on refining LA testing methods and developing point-of-care diagnostics are also fueling market expansion. While challenges such as the high cost of advanced testing and variability in test results across different laboratories exist, the overall market outlook remains positive due to the unmet medical need and the continuous innovation in this field.
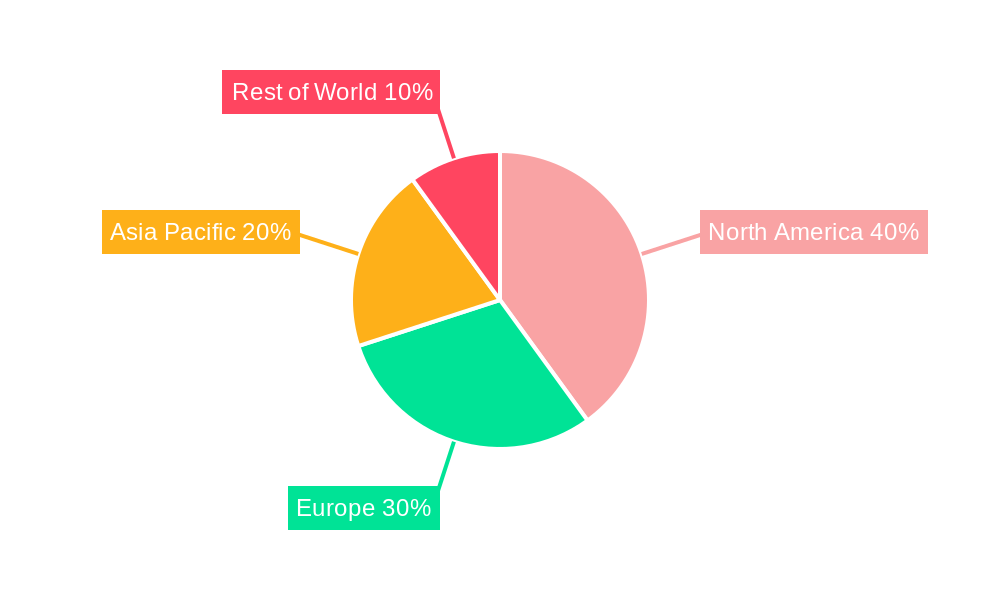
The market is segmented by various factors, including test type (e.g., dilute Russell viper venom time (dRVVT), activated partial thromboplastin time (aPTT)), end-user (hospitals, diagnostic laboratories, research institutions), and geography. Major players like Labcorp, ARUP Laboratories, and Quest Diagnostics are significantly influencing market dynamics through their technological advancements, strategic partnerships, and global reach. The competitive landscape is characterized by both large established players and smaller specialized companies, fostering innovation and driving the development of new and improved LA testing solutions. The market is expected to witness further consolidation as larger companies acquire smaller players to expand their market share and product portfolios. Regional variations in healthcare infrastructure and disease prevalence will influence market growth patterns, with developed regions like North America and Europe likely to maintain a significant market share.
Lupus Anticoagulant Testing Market: A Comprehensive Report (2019-2033)
This in-depth report provides a comprehensive analysis of the Lupus Anticoagulant Testing market, offering actionable insights for industry professionals, investors, and stakeholders. Covering the period from 2019 to 2033, with a focus on the 2025-2033 forecast, this report unveils key market dynamics, technological advancements, and competitive landscapes. The study period (2019-2024) provides a strong historical context, while the estimated year (2025) serves as the base for future projections.
Lupus Anticoagulant Testing Market Structure & Innovation Trends
The Lupus Anticoagulant Testing market exhibits a moderately concentrated structure, with key players such as Labcorp, ARUP Laboratories, Mayo Clinic Laboratories, Quest Diagnostics, and Diagnostica Stago Inc. holding significant market share. Precise market share figures for each player are unavailable at this time (xx%). However, the recent acquisition of Precision BioLogic by Procuritas Capital Investors VII signifies a significant shift in the market dynamics. This merger, valued at xx Million, is expected to reshape the competitive landscape.
Innovation in this sector is driven by the need for improved accuracy, faster turnaround times, and cost-effective testing solutions. Regulatory frameworks, particularly those related to diagnostic testing and quality control, play a crucial role in shaping market practices. While limited direct substitutes exist, continuous advancements in related technologies, like advanced coagulation assays, pose an indirect competitive threat. The end-user demographics primarily consist of hospitals, diagnostic laboratories, and specialized research centers. Further M&A activities are expected, driving consolidation within the market.
- Market Concentration: Moderately Concentrated (xx% held by top 5 players)
- Innovation Drivers: Improved Accuracy, Faster Turnaround Time, Cost Reduction
- Regulatory Influence: Significant impact on quality control and market access
- Product Substitutes: Limited direct substitutes, indirect competition from advanced coagulation technologies
- M&A Activity: High, with recent acquisitions significantly altering the competitive landscape (e.g., Precision BioLogic acquisition).
- End-User Demographics: Hospitals, diagnostic laboratories, research centers.
Lupus Anticoagulant Testing Market Dynamics & Trends
The Lupus Anticoagulant Testing market is experiencing robust growth, driven by increasing prevalence of autoimmune diseases, rising demand for accurate diagnostic tools, and technological advancements leading to improved testing methodologies. The market is projected to witness a Compound Annual Growth Rate (CAGR) of xx% during the forecast period (2025-2033). Market penetration is currently at xx%, with significant room for expansion, particularly in emerging markets. Technological disruptions, such as the introduction of automated and point-of-care testing systems, are further accelerating market growth. Consumer preferences, including a demand for faster and more convenient testing solutions, are influencing product development strategies. The competitive dynamics are characterized by ongoing innovation, strategic partnerships, and acquisitions. The increasing prevalence of thrombotic events and improved understanding of lupus anticoagulant significantly impact market growth.
Dominant Regions & Segments in Lupus Anticoagulant Testing Market
While precise data on regional dominance is unavailable at this time (xx), North America is anticipated to maintain a leading position in the Lupus Anticoagulant Testing market throughout the forecast period.
North America:
- Key Drivers: High prevalence of autoimmune diseases, well-established healthcare infrastructure, advanced technological capabilities, and high healthcare expenditure.
- Dominance Analysis: North America benefits from a large patient population requiring these tests, combined with the availability of advanced technology and well-funded healthcare systems. Stringent regulatory frameworks also ensure quality assurance and contribute to market growth.
Europe: (Additional regional analysis would be included here for a complete report. Data unavailable at this time (xx))
Asia-Pacific: (Additional regional analysis would be included here for a complete report. Data unavailable at this time (xx))
Lupus Anticoagulant Testing Market Product Innovations
Recent advancements in lupus anticoagulant testing encompass the development of more sensitive and specific assays, improved automation for high-throughput testing, and the integration of advanced analytics for faster and more accurate results. These innovations aim to enhance diagnostic accuracy, reduce turnaround times, and improve overall efficiency, ultimately leading to better patient outcomes and streamlined clinical workflows. The market fit for these new products is excellent, driven by the growing demand for advanced diagnostic solutions in the field of hematology and immunology.
Report Scope & Segmentation Analysis
This report segments the Lupus Anticoagulant Testing market based on several factors, including:
- By Product Type: (Details on market size, growth projections and competitive dynamics for each segment would be detailed here. Data unavailable at this time (xx))
- By End-User: (Details on market size, growth projections and competitive dynamics for each segment would be detailed here. Data unavailable at this time (xx))
- By Geography: (Details on market size, growth projections and competitive dynamics for each segment would be detailed here. Data unavailable at this time (xx))
Key Drivers of Lupus Anticoagulant Testing Market Growth
Several factors contribute to the growth of the Lupus Anticoagulant Testing market. The increasing prevalence of autoimmune diseases, such as lupus, is a primary driver. Technological advancements, resulting in improved assay sensitivity and automation, significantly enhance testing efficiency and accuracy. Furthermore, supportive regulatory frameworks and rising healthcare expenditure contribute to market expansion. The rising awareness regarding the importance of early diagnosis and effective management of lupus anticoagulant-related disorders also fuels the market's growth.
Challenges in the Lupus Anticoagulant Testing Market Sector
Despite the promising growth trajectory, the Lupus Anticoagulant Testing market faces several challenges. Regulatory hurdles, including stringent approval processes and reimbursement policies, can hinder market entry for new players. Furthermore, maintaining a consistent supply chain for reagents and other consumables can be difficult, particularly during periods of high demand. Finally, intense competition from established players requires continuous innovation and efficient operational management to maintain market share.
Emerging Opportunities in Lupus Anticoagulant Testing Market
Emerging opportunities lie in the development of point-of-care testing devices for faster and more accessible diagnosis. Expansion into underserved markets, particularly in developing countries, presents significant growth potential. Advancements in molecular diagnostics and the integration of artificial intelligence offer exciting avenues for improving the accuracy and efficiency of lupus anticoagulant testing.
Leading Players in the Lupus Anticoagulant Testing Market Market
- Labcorp
- ARUP Laboratories
- Mayo Clinic Laboratories
- Quest Diagnostics
- Precision Biologics
- Ulta Lab Tests LLC
- Diagnostica Stago Inc
- Precision BioLogic Incorporated
- Contract Laboratory
- F Hoffmann-La Roche Ltd
- *List Not Exhaustive
Key Developments in Lupus Anticoagulant Testing Market Industry
- February 2024: ARUP Laboratories launched an updated lupus anticoagulant reflexive panel, enhancing accuracy and minimizing interference from anticoagulant medications.
- February 2024: Procuritas Capital Investors VII acquired Precision BioLogic, expanding its coagulation diagnostics portfolio and reshaping market dynamics.
Future Outlook for Lupus Anticoagulant Testing Market Market
The Lupus Anticoagulant Testing market is poised for continued expansion driven by technological advancements, increasing disease prevalence, and growing demand for accurate and efficient diagnostic solutions. Strategic partnerships, further acquisitions, and the development of innovative testing methodologies will shape the future competitive landscape. The market's future growth hinges on addressing existing challenges while capitalizing on emerging opportunities. The focus will remain on improving assay performance, streamlining workflows, and expanding access to these vital diagnostic tests globally.
Lupus Anticoagulant Testing Market Segmentation
-
1. Test Type
- 1.1. Prothrombin Time (PT)
- 1.2. Activated Partial Thrombopl Time
- 1.3. Dilute Russells Viper Venom Time
- 1.4. Coagulation Factor VIII Assay
-
2. End Users
- 2.1. Hospitals
- 2.2. Clinics
- 2.3. Diagnostic Centers
Lupus Anticoagulant Testing Market Segmentation By Geography
-
1. North America
- 1.1. United States
- 1.2. Canada
- 1.3. Mexico
-
2. Europe
- 2.1. Germany
- 2.2. United Kingdom
- 2.3. France
- 2.4. Italy
- 2.5. Spain
- 2.6. Rest of Europe
-
3. Asia Pacific
- 3.1. China
- 3.2. Japan
- 3.3. India
- 3.4. Australia
- 3.5. South Korea
- 3.6. Rest of Asia Pacific
-
4. Middle East and Africa
- 4.1. GCC
- 4.2. South Africa
- 4.3. Rest of Middle East and Africa
-
5. South America
- 5.1. Brazil
- 5.2. Argentina
- 5.3. Rest of South America
Lupus Anticoagulant Testing Market REPORT HIGHLIGHTS
| Aspects | Details |
|---|---|
| Study Period | 2019-2033 |
| Base Year | 2024 |
| Estimated Year | 2025 |
| Forecast Period | 2025-2033 |
| Historical Period | 2019-2024 |
| Growth Rate | CAGR of 5.72% from 2019-2033 |
| Segmentation |
|
Table of Contents
- 1. Introduction
- 1.1. Research Scope
- 1.2. Market Segmentation
- 1.3. Research Methodology
- 1.4. Definitions and Assumptions
- 2. Executive Summary
- 2.1. Introduction
- 3. Market Dynamics
- 3.1. Introduction
- 3.2. Market Drivers
- 3.2.1. Increasing Prevalence of Autoimmune Diseases; Growing Awareness About Blood Coagulation Disorders
- 3.3. Market Restrains
- 3.3.1. Increasing Prevalence of Autoimmune Diseases; Growing Awareness About Blood Coagulation Disorders
- 3.4. Market Trends
- 3.4.1. Dilute Russell's Viper Venom Time Test is Expected to Show Significant Growth During the Forecast Period
- 4. Market Factor Analysis
- 4.1. Porters Five Forces
- 4.2. Supply/Value Chain
- 4.3. PESTEL analysis
- 4.4. Market Entropy
- 4.5. Patent/Trademark Analysis
- 5. Global Lupus Anticoagulant Testing Market Analysis, Insights and Forecast, 2019-2031
- 5.1. Market Analysis, Insights and Forecast - by Test Type
- 5.1.1. Prothrombin Time (PT)
- 5.1.2. Activated Partial Thrombopl Time
- 5.1.3. Dilute Russells Viper Venom Time
- 5.1.4. Coagulation Factor VIII Assay
- 5.2. Market Analysis, Insights and Forecast - by End Users
- 5.2.1. Hospitals
- 5.2.2. Clinics
- 5.2.3. Diagnostic Centers
- 5.3. Market Analysis, Insights and Forecast - by Region
- 5.3.1. North America
- 5.3.2. Europe
- 5.3.3. Asia Pacific
- 5.3.4. Middle East and Africa
- 5.3.5. South America
- 5.1. Market Analysis, Insights and Forecast - by Test Type
- 6. North America Lupus Anticoagulant Testing Market Analysis, Insights and Forecast, 2019-2031
- 6.1. Market Analysis, Insights and Forecast - by Test Type
- 6.1.1. Prothrombin Time (PT)
- 6.1.2. Activated Partial Thrombopl Time
- 6.1.3. Dilute Russells Viper Venom Time
- 6.1.4. Coagulation Factor VIII Assay
- 6.2. Market Analysis, Insights and Forecast - by End Users
- 6.2.1. Hospitals
- 6.2.2. Clinics
- 6.2.3. Diagnostic Centers
- 6.1. Market Analysis, Insights and Forecast - by Test Type
- 7. Europe Lupus Anticoagulant Testing Market Analysis, Insights and Forecast, 2019-2031
- 7.1. Market Analysis, Insights and Forecast - by Test Type
- 7.1.1. Prothrombin Time (PT)
- 7.1.2. Activated Partial Thrombopl Time
- 7.1.3. Dilute Russells Viper Venom Time
- 7.1.4. Coagulation Factor VIII Assay
- 7.2. Market Analysis, Insights and Forecast - by End Users
- 7.2.1. Hospitals
- 7.2.2. Clinics
- 7.2.3. Diagnostic Centers
- 7.1. Market Analysis, Insights and Forecast - by Test Type
- 8. Asia Pacific Lupus Anticoagulant Testing Market Analysis, Insights and Forecast, 2019-2031
- 8.1. Market Analysis, Insights and Forecast - by Test Type
- 8.1.1. Prothrombin Time (PT)
- 8.1.2. Activated Partial Thrombopl Time
- 8.1.3. Dilute Russells Viper Venom Time
- 8.1.4. Coagulation Factor VIII Assay
- 8.2. Market Analysis, Insights and Forecast - by End Users
- 8.2.1. Hospitals
- 8.2.2. Clinics
- 8.2.3. Diagnostic Centers
- 8.1. Market Analysis, Insights and Forecast - by Test Type
- 9. Middle East and Africa Lupus Anticoagulant Testing Market Analysis, Insights and Forecast, 2019-2031
- 9.1. Market Analysis, Insights and Forecast - by Test Type
- 9.1.1. Prothrombin Time (PT)
- 9.1.2. Activated Partial Thrombopl Time
- 9.1.3. Dilute Russells Viper Venom Time
- 9.1.4. Coagulation Factor VIII Assay
- 9.2. Market Analysis, Insights and Forecast - by End Users
- 9.2.1. Hospitals
- 9.2.2. Clinics
- 9.2.3. Diagnostic Centers
- 9.1. Market Analysis, Insights and Forecast - by Test Type
- 10. South America Lupus Anticoagulant Testing Market Analysis, Insights and Forecast, 2019-2031
- 10.1. Market Analysis, Insights and Forecast - by Test Type
- 10.1.1. Prothrombin Time (PT)
- 10.1.2. Activated Partial Thrombopl Time
- 10.1.3. Dilute Russells Viper Venom Time
- 10.1.4. Coagulation Factor VIII Assay
- 10.2. Market Analysis, Insights and Forecast - by End Users
- 10.2.1. Hospitals
- 10.2.2. Clinics
- 10.2.3. Diagnostic Centers
- 10.1. Market Analysis, Insights and Forecast - by Test Type
- 11. Competitive Analysis
- 11.1. Global Market Share Analysis 2024
- 11.2. Company Profiles
- 11.2.1 Labcorp
- 11.2.1.1. Overview
- 11.2.1.2. Products
- 11.2.1.3. SWOT Analysis
- 11.2.1.4. Recent Developments
- 11.2.1.5. Financials (Based on Availability)
- 11.2.2 ARUP Laboratories
- 11.2.2.1. Overview
- 11.2.2.2. Products
- 11.2.2.3. SWOT Analysis
- 11.2.2.4. Recent Developments
- 11.2.2.5. Financials (Based on Availability)
- 11.2.3 Mayo Clinic Laboratories
- 11.2.3.1. Overview
- 11.2.3.2. Products
- 11.2.3.3. SWOT Analysis
- 11.2.3.4. Recent Developments
- 11.2.3.5. Financials (Based on Availability)
- 11.2.4 Quest Diagnostic
- 11.2.4.1. Overview
- 11.2.4.2. Products
- 11.2.4.3. SWOT Analysis
- 11.2.4.4. Recent Developments
- 11.2.4.5. Financials (Based on Availability)
- 11.2.5 Precision Biologics
- 11.2.5.1. Overview
- 11.2.5.2. Products
- 11.2.5.3. SWOT Analysis
- 11.2.5.4. Recent Developments
- 11.2.5.5. Financials (Based on Availability)
- 11.2.6 Ulta Lab Tests LLC
- 11.2.6.1. Overview
- 11.2.6.2. Products
- 11.2.6.3. SWOT Analysis
- 11.2.6.4. Recent Developments
- 11.2.6.5. Financials (Based on Availability)
- 11.2.7 Diagnostica Stago Inc
- 11.2.7.1. Overview
- 11.2.7.2. Products
- 11.2.7.3. SWOT Analysis
- 11.2.7.4. Recent Developments
- 11.2.7.5. Financials (Based on Availability)
- 11.2.8 Precision BioLogic Incorporated
- 11.2.8.1. Overview
- 11.2.8.2. Products
- 11.2.8.3. SWOT Analysis
- 11.2.8.4. Recent Developments
- 11.2.8.5. Financials (Based on Availability)
- 11.2.9 Contract Laboratory
- 11.2.9.1. Overview
- 11.2.9.2. Products
- 11.2.9.3. SWOT Analysis
- 11.2.9.4. Recent Developments
- 11.2.9.5. Financials (Based on Availability)
- 11.2.10 F Hoffmann-La Roche Ltd*List Not Exhaustive
- 11.2.10.1. Overview
- 11.2.10.2. Products
- 11.2.10.3. SWOT Analysis
- 11.2.10.4. Recent Developments
- 11.2.10.5. Financials (Based on Availability)
- 11.2.1 Labcorp
List of Figures
- Figure 1: Global Lupus Anticoagulant Testing Market Revenue Breakdown (Million, %) by Region 2024 & 2032
- Figure 2: Global Lupus Anticoagulant Testing Market Volume Breakdown (Million, %) by Region 2024 & 2032
- Figure 3: North America Lupus Anticoagulant Testing Market Revenue (Million), by Test Type 2024 & 2032
- Figure 4: North America Lupus Anticoagulant Testing Market Volume (Million), by Test Type 2024 & 2032
- Figure 5: North America Lupus Anticoagulant Testing Market Revenue Share (%), by Test Type 2024 & 2032
- Figure 6: North America Lupus Anticoagulant Testing Market Volume Share (%), by Test Type 2024 & 2032
- Figure 7: North America Lupus Anticoagulant Testing Market Revenue (Million), by End Users 2024 & 2032
- Figure 8: North America Lupus Anticoagulant Testing Market Volume (Million), by End Users 2024 & 2032
- Figure 9: North America Lupus Anticoagulant Testing Market Revenue Share (%), by End Users 2024 & 2032
- Figure 10: North America Lupus Anticoagulant Testing Market Volume Share (%), by End Users 2024 & 2032
- Figure 11: North America Lupus Anticoagulant Testing Market Revenue (Million), by Country 2024 & 2032
- Figure 12: North America Lupus Anticoagulant Testing Market Volume (Million), by Country 2024 & 2032
- Figure 13: North America Lupus Anticoagulant Testing Market Revenue Share (%), by Country 2024 & 2032
- Figure 14: North America Lupus Anticoagulant Testing Market Volume Share (%), by Country 2024 & 2032
- Figure 15: Europe Lupus Anticoagulant Testing Market Revenue (Million), by Test Type 2024 & 2032
- Figure 16: Europe Lupus Anticoagulant Testing Market Volume (Million), by Test Type 2024 & 2032
- Figure 17: Europe Lupus Anticoagulant Testing Market Revenue Share (%), by Test Type 2024 & 2032
- Figure 18: Europe Lupus Anticoagulant Testing Market Volume Share (%), by Test Type 2024 & 2032
- Figure 19: Europe Lupus Anticoagulant Testing Market Revenue (Million), by End Users 2024 & 2032
- Figure 20: Europe Lupus Anticoagulant Testing Market Volume (Million), by End Users 2024 & 2032
- Figure 21: Europe Lupus Anticoagulant Testing Market Revenue Share (%), by End Users 2024 & 2032
- Figure 22: Europe Lupus Anticoagulant Testing Market Volume Share (%), by End Users 2024 & 2032
- Figure 23: Europe Lupus Anticoagulant Testing Market Revenue (Million), by Country 2024 & 2032
- Figure 24: Europe Lupus Anticoagulant Testing Market Volume (Million), by Country 2024 & 2032
- Figure 25: Europe Lupus Anticoagulant Testing Market Revenue Share (%), by Country 2024 & 2032
- Figure 26: Europe Lupus Anticoagulant Testing Market Volume Share (%), by Country 2024 & 2032
- Figure 27: Asia Pacific Lupus Anticoagulant Testing Market Revenue (Million), by Test Type 2024 & 2032
- Figure 28: Asia Pacific Lupus Anticoagulant Testing Market Volume (Million), by Test Type 2024 & 2032
- Figure 29: Asia Pacific Lupus Anticoagulant Testing Market Revenue Share (%), by Test Type 2024 & 2032
- Figure 30: Asia Pacific Lupus Anticoagulant Testing Market Volume Share (%), by Test Type 2024 & 2032
- Figure 31: Asia Pacific Lupus Anticoagulant Testing Market Revenue (Million), by End Users 2024 & 2032
- Figure 32: Asia Pacific Lupus Anticoagulant Testing Market Volume (Million), by End Users 2024 & 2032
- Figure 33: Asia Pacific Lupus Anticoagulant Testing Market Revenue Share (%), by End Users 2024 & 2032
- Figure 34: Asia Pacific Lupus Anticoagulant Testing Market Volume Share (%), by End Users 2024 & 2032
- Figure 35: Asia Pacific Lupus Anticoagulant Testing Market Revenue (Million), by Country 2024 & 2032
- Figure 36: Asia Pacific Lupus Anticoagulant Testing Market Volume (Million), by Country 2024 & 2032
- Figure 37: Asia Pacific Lupus Anticoagulant Testing Market Revenue Share (%), by Country 2024 & 2032
- Figure 38: Asia Pacific Lupus Anticoagulant Testing Market Volume Share (%), by Country 2024 & 2032
- Figure 39: Middle East and Africa Lupus Anticoagulant Testing Market Revenue (Million), by Test Type 2024 & 2032
- Figure 40: Middle East and Africa Lupus Anticoagulant Testing Market Volume (Million), by Test Type 2024 & 2032
- Figure 41: Middle East and Africa Lupus Anticoagulant Testing Market Revenue Share (%), by Test Type 2024 & 2032
- Figure 42: Middle East and Africa Lupus Anticoagulant Testing Market Volume Share (%), by Test Type 2024 & 2032
- Figure 43: Middle East and Africa Lupus Anticoagulant Testing Market Revenue (Million), by End Users 2024 & 2032
- Figure 44: Middle East and Africa Lupus Anticoagulant Testing Market Volume (Million), by End Users 2024 & 2032
- Figure 45: Middle East and Africa Lupus Anticoagulant Testing Market Revenue Share (%), by End Users 2024 & 2032
- Figure 46: Middle East and Africa Lupus Anticoagulant Testing Market Volume Share (%), by End Users 2024 & 2032
- Figure 47: Middle East and Africa Lupus Anticoagulant Testing Market Revenue (Million), by Country 2024 & 2032
- Figure 48: Middle East and Africa Lupus Anticoagulant Testing Market Volume (Million), by Country 2024 & 2032
- Figure 49: Middle East and Africa Lupus Anticoagulant Testing Market Revenue Share (%), by Country 2024 & 2032
- Figure 50: Middle East and Africa Lupus Anticoagulant Testing Market Volume Share (%), by Country 2024 & 2032
- Figure 51: South America Lupus Anticoagulant Testing Market Revenue (Million), by Test Type 2024 & 2032
- Figure 52: South America Lupus Anticoagulant Testing Market Volume (Million), by Test Type 2024 & 2032
- Figure 53: South America Lupus Anticoagulant Testing Market Revenue Share (%), by Test Type 2024 & 2032
- Figure 54: South America Lupus Anticoagulant Testing Market Volume Share (%), by Test Type 2024 & 2032
- Figure 55: South America Lupus Anticoagulant Testing Market Revenue (Million), by End Users 2024 & 2032
- Figure 56: South America Lupus Anticoagulant Testing Market Volume (Million), by End Users 2024 & 2032
- Figure 57: South America Lupus Anticoagulant Testing Market Revenue Share (%), by End Users 2024 & 2032
- Figure 58: South America Lupus Anticoagulant Testing Market Volume Share (%), by End Users 2024 & 2032
- Figure 59: South America Lupus Anticoagulant Testing Market Revenue (Million), by Country 2024 & 2032
- Figure 60: South America Lupus Anticoagulant Testing Market Volume (Million), by Country 2024 & 2032
- Figure 61: South America Lupus Anticoagulant Testing Market Revenue Share (%), by Country 2024 & 2032
- Figure 62: South America Lupus Anticoagulant Testing Market Volume Share (%), by Country 2024 & 2032
List of Tables
- Table 1: Global Lupus Anticoagulant Testing Market Revenue Million Forecast, by Region 2019 & 2032
- Table 2: Global Lupus Anticoagulant Testing Market Volume Million Forecast, by Region 2019 & 2032
- Table 3: Global Lupus Anticoagulant Testing Market Revenue Million Forecast, by Test Type 2019 & 2032
- Table 4: Global Lupus Anticoagulant Testing Market Volume Million Forecast, by Test Type 2019 & 2032
- Table 5: Global Lupus Anticoagulant Testing Market Revenue Million Forecast, by End Users 2019 & 2032
- Table 6: Global Lupus Anticoagulant Testing Market Volume Million Forecast, by End Users 2019 & 2032
- Table 7: Global Lupus Anticoagulant Testing Market Revenue Million Forecast, by Region 2019 & 2032
- Table 8: Global Lupus Anticoagulant Testing Market Volume Million Forecast, by Region 2019 & 2032
- Table 9: Global Lupus Anticoagulant Testing Market Revenue Million Forecast, by Test Type 2019 & 2032
- Table 10: Global Lupus Anticoagulant Testing Market Volume Million Forecast, by Test Type 2019 & 2032
- Table 11: Global Lupus Anticoagulant Testing Market Revenue Million Forecast, by End Users 2019 & 2032
- Table 12: Global Lupus Anticoagulant Testing Market Volume Million Forecast, by End Users 2019 & 2032
- Table 13: Global Lupus Anticoagulant Testing Market Revenue Million Forecast, by Country 2019 & 2032
- Table 14: Global Lupus Anticoagulant Testing Market Volume Million Forecast, by Country 2019 & 2032
- Table 15: United States Lupus Anticoagulant Testing Market Revenue (Million) Forecast, by Application 2019 & 2032
- Table 16: United States Lupus Anticoagulant Testing Market Volume (Million) Forecast, by Application 2019 & 2032
- Table 17: Canada Lupus Anticoagulant Testing Market Revenue (Million) Forecast, by Application 2019 & 2032
- Table 18: Canada Lupus Anticoagulant Testing Market Volume (Million) Forecast, by Application 2019 & 2032
- Table 19: Mexico Lupus Anticoagulant Testing Market Revenue (Million) Forecast, by Application 2019 & 2032
- Table 20: Mexico Lupus Anticoagulant Testing Market Volume (Million) Forecast, by Application 2019 & 2032
- Table 21: Global Lupus Anticoagulant Testing Market Revenue Million Forecast, by Test Type 2019 & 2032
- Table 22: Global Lupus Anticoagulant Testing Market Volume Million Forecast, by Test Type 2019 & 2032
- Table 23: Global Lupus Anticoagulant Testing Market Revenue Million Forecast, by End Users 2019 & 2032
- Table 24: Global Lupus Anticoagulant Testing Market Volume Million Forecast, by End Users 2019 & 2032
- Table 25: Global Lupus Anticoagulant Testing Market Revenue Million Forecast, by Country 2019 & 2032
- Table 26: Global Lupus Anticoagulant Testing Market Volume Million Forecast, by Country 2019 & 2032
- Table 27: Germany Lupus Anticoagulant Testing Market Revenue (Million) Forecast, by Application 2019 & 2032
- Table 28: Germany Lupus Anticoagulant Testing Market Volume (Million) Forecast, by Application 2019 & 2032
- Table 29: United Kingdom Lupus Anticoagulant Testing Market Revenue (Million) Forecast, by Application 2019 & 2032
- Table 30: United Kingdom Lupus Anticoagulant Testing Market Volume (Million) Forecast, by Application 2019 & 2032
- Table 31: France Lupus Anticoagulant Testing Market Revenue (Million) Forecast, by Application 2019 & 2032
- Table 32: France Lupus Anticoagulant Testing Market Volume (Million) Forecast, by Application 2019 & 2032
- Table 33: Italy Lupus Anticoagulant Testing Market Revenue (Million) Forecast, by Application 2019 & 2032
- Table 34: Italy Lupus Anticoagulant Testing Market Volume (Million) Forecast, by Application 2019 & 2032
- Table 35: Spain Lupus Anticoagulant Testing Market Revenue (Million) Forecast, by Application 2019 & 2032
- Table 36: Spain Lupus Anticoagulant Testing Market Volume (Million) Forecast, by Application 2019 & 2032
- Table 37: Rest of Europe Lupus Anticoagulant Testing Market Revenue (Million) Forecast, by Application 2019 & 2032
- Table 38: Rest of Europe Lupus Anticoagulant Testing Market Volume (Million) Forecast, by Application 2019 & 2032
- Table 39: Global Lupus Anticoagulant Testing Market Revenue Million Forecast, by Test Type 2019 & 2032
- Table 40: Global Lupus Anticoagulant Testing Market Volume Million Forecast, by Test Type 2019 & 2032
- Table 41: Global Lupus Anticoagulant Testing Market Revenue Million Forecast, by End Users 2019 & 2032
- Table 42: Global Lupus Anticoagulant Testing Market Volume Million Forecast, by End Users 2019 & 2032
- Table 43: Global Lupus Anticoagulant Testing Market Revenue Million Forecast, by Country 2019 & 2032
- Table 44: Global Lupus Anticoagulant Testing Market Volume Million Forecast, by Country 2019 & 2032
- Table 45: China Lupus Anticoagulant Testing Market Revenue (Million) Forecast, by Application 2019 & 2032
- Table 46: China Lupus Anticoagulant Testing Market Volume (Million) Forecast, by Application 2019 & 2032
- Table 47: Japan Lupus Anticoagulant Testing Market Revenue (Million) Forecast, by Application 2019 & 2032
- Table 48: Japan Lupus Anticoagulant Testing Market Volume (Million) Forecast, by Application 2019 & 2032
- Table 49: India Lupus Anticoagulant Testing Market Revenue (Million) Forecast, by Application 2019 & 2032
- Table 50: India Lupus Anticoagulant Testing Market Volume (Million) Forecast, by Application 2019 & 2032
- Table 51: Australia Lupus Anticoagulant Testing Market Revenue (Million) Forecast, by Application 2019 & 2032
- Table 52: Australia Lupus Anticoagulant Testing Market Volume (Million) Forecast, by Application 2019 & 2032
- Table 53: South Korea Lupus Anticoagulant Testing Market Revenue (Million) Forecast, by Application 2019 & 2032
- Table 54: South Korea Lupus Anticoagulant Testing Market Volume (Million) Forecast, by Application 2019 & 2032
- Table 55: Rest of Asia Pacific Lupus Anticoagulant Testing Market Revenue (Million) Forecast, by Application 2019 & 2032
- Table 56: Rest of Asia Pacific Lupus Anticoagulant Testing Market Volume (Million) Forecast, by Application 2019 & 2032
- Table 57: Global Lupus Anticoagulant Testing Market Revenue Million Forecast, by Test Type 2019 & 2032
- Table 58: Global Lupus Anticoagulant Testing Market Volume Million Forecast, by Test Type 2019 & 2032
- Table 59: Global Lupus Anticoagulant Testing Market Revenue Million Forecast, by End Users 2019 & 2032
- Table 60: Global Lupus Anticoagulant Testing Market Volume Million Forecast, by End Users 2019 & 2032
- Table 61: Global Lupus Anticoagulant Testing Market Revenue Million Forecast, by Country 2019 & 2032
- Table 62: Global Lupus Anticoagulant Testing Market Volume Million Forecast, by Country 2019 & 2032
- Table 63: GCC Lupus Anticoagulant Testing Market Revenue (Million) Forecast, by Application 2019 & 2032
- Table 64: GCC Lupus Anticoagulant Testing Market Volume (Million) Forecast, by Application 2019 & 2032
- Table 65: South Africa Lupus Anticoagulant Testing Market Revenue (Million) Forecast, by Application 2019 & 2032
- Table 66: South Africa Lupus Anticoagulant Testing Market Volume (Million) Forecast, by Application 2019 & 2032
- Table 67: Rest of Middle East and Africa Lupus Anticoagulant Testing Market Revenue (Million) Forecast, by Application 2019 & 2032
- Table 68: Rest of Middle East and Africa Lupus Anticoagulant Testing Market Volume (Million) Forecast, by Application 2019 & 2032
- Table 69: Global Lupus Anticoagulant Testing Market Revenue Million Forecast, by Test Type 2019 & 2032
- Table 70: Global Lupus Anticoagulant Testing Market Volume Million Forecast, by Test Type 2019 & 2032
- Table 71: Global Lupus Anticoagulant Testing Market Revenue Million Forecast, by End Users 2019 & 2032
- Table 72: Global Lupus Anticoagulant Testing Market Volume Million Forecast, by End Users 2019 & 2032
- Table 73: Global Lupus Anticoagulant Testing Market Revenue Million Forecast, by Country 2019 & 2032
- Table 74: Global Lupus Anticoagulant Testing Market Volume Million Forecast, by Country 2019 & 2032
- Table 75: Brazil Lupus Anticoagulant Testing Market Revenue (Million) Forecast, by Application 2019 & 2032
- Table 76: Brazil Lupus Anticoagulant Testing Market Volume (Million) Forecast, by Application 2019 & 2032
- Table 77: Argentina Lupus Anticoagulant Testing Market Revenue (Million) Forecast, by Application 2019 & 2032
- Table 78: Argentina Lupus Anticoagulant Testing Market Volume (Million) Forecast, by Application 2019 & 2032
- Table 79: Rest of South America Lupus Anticoagulant Testing Market Revenue (Million) Forecast, by Application 2019 & 2032
- Table 80: Rest of South America Lupus Anticoagulant Testing Market Volume (Million) Forecast, by Application 2019 & 2032
Frequently Asked Questions
1. What is the projected Compound Annual Growth Rate (CAGR) of the Lupus Anticoagulant Testing Market?
The projected CAGR is approximately 5.72%.
2. Which companies are prominent players in the Lupus Anticoagulant Testing Market?
Key companies in the market include Labcorp, ARUP Laboratories, Mayo Clinic Laboratories, Quest Diagnostic, Precision Biologics, Ulta Lab Tests LLC, Diagnostica Stago Inc, Precision BioLogic Incorporated, Contract Laboratory, F Hoffmann-La Roche Ltd*List Not Exhaustive.
3. What are the main segments of the Lupus Anticoagulant Testing Market?
The market segments include Test Type, End Users.
4. Can you provide details about the market size?
The market size is estimated to be USD 400.10 Million as of 2022.
5. What are some drivers contributing to market growth?
Increasing Prevalence of Autoimmune Diseases; Growing Awareness About Blood Coagulation Disorders.
6. What are the notable trends driving market growth?
Dilute Russell's Viper Venom Time Test is Expected to Show Significant Growth During the Forecast Period.
7. Are there any restraints impacting market growth?
Increasing Prevalence of Autoimmune Diseases; Growing Awareness About Blood Coagulation Disorders.
8. Can you provide examples of recent developments in the market?
February 2024: ARUP Laboratories, a clinical and anatomical pathology reference laboratory, launched an updated lupus anticoagulant reflexive panel that can detect and neutralize several commonly prescribed anticoagulant medications and limit their impact on test results.
9. What pricing options are available for accessing the report?
Pricing options include single-user, multi-user, and enterprise licenses priced at USD 4750, USD 5250, and USD 8750 respectively.
10. Is the market size provided in terms of value or volume?
The market size is provided in terms of value, measured in Million and volume, measured in Million.
11. Are there any specific market keywords associated with the report?
Yes, the market keyword associated with the report is "Lupus Anticoagulant Testing Market," which aids in identifying and referencing the specific market segment covered.
12. How do I determine which pricing option suits my needs best?
The pricing options vary based on user requirements and access needs. Individual users may opt for single-user licenses, while businesses requiring broader access may choose multi-user or enterprise licenses for cost-effective access to the report.
13. Are there any additional resources or data provided in the Lupus Anticoagulant Testing Market report?
While the report offers comprehensive insights, it's advisable to review the specific contents or supplementary materials provided to ascertain if additional resources or data are available.
14. How can I stay updated on further developments or reports in the Lupus Anticoagulant Testing Market?
To stay informed about further developments, trends, and reports in the Lupus Anticoagulant Testing Market, consider subscribing to industry newsletters, following relevant companies and organizations, or regularly checking reputable industry news sources and publications.
Methodology
Step 1 - Identification of Relevant Samples Size from Population Database


Step 2 - Approaches for Defining Global Market Size (Value, Volume* & Price*)

Note*: In applicable scenarios
Step 3 - Data Sources
Primary Research
- Web Analytics
- Survey Reports
- Research Institute
- Latest Research Reports
- Opinion Leaders
Secondary Research
- Annual Reports
- White Paper
- Latest Press Release
- Industry Association
- Paid Database
- Investor Presentations

Step 4 - Data Triangulation
Involves using different sources of information in order to increase the validity of a study
These sources are likely to be stakeholders in a program - participants, other researchers, program staff, other community members, and so on.
Then we put all data in single framework & apply various statistical tools to find out the dynamic on the market.
During the analysis stage, feedback from the stakeholder groups would be compared to determine areas of agreement as well as areas of divergence


