
Key Insights
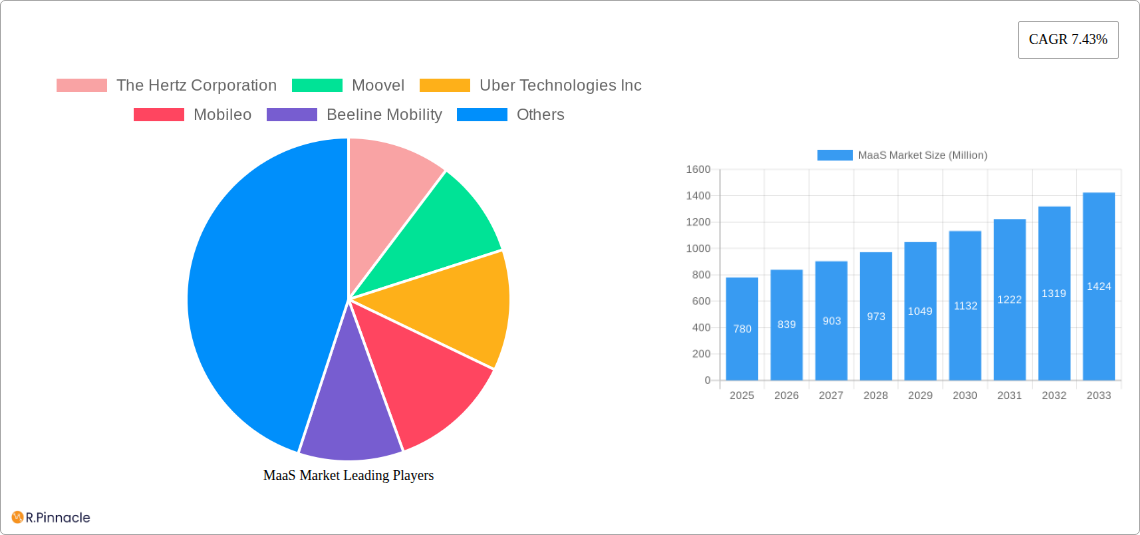
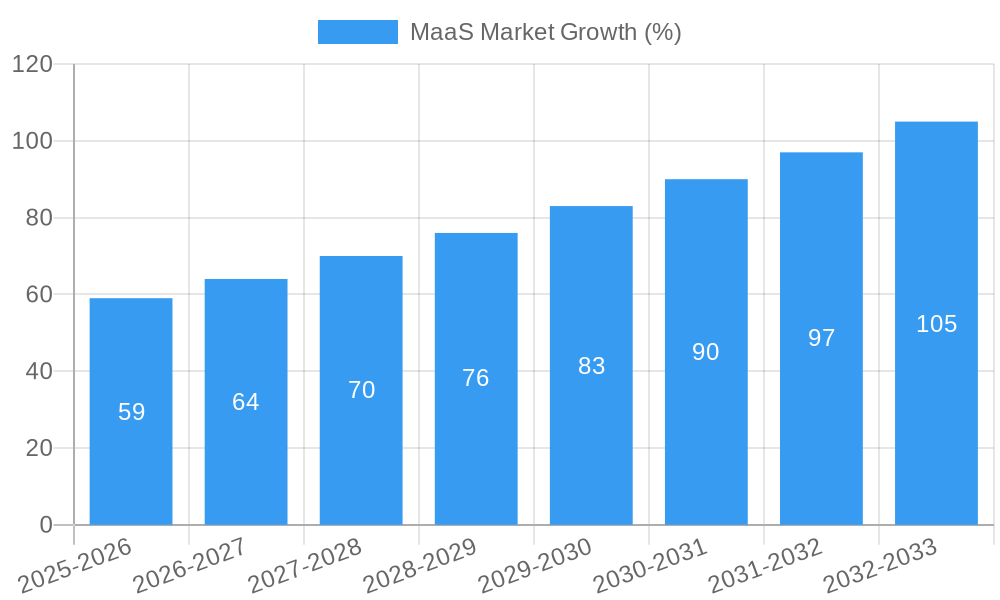
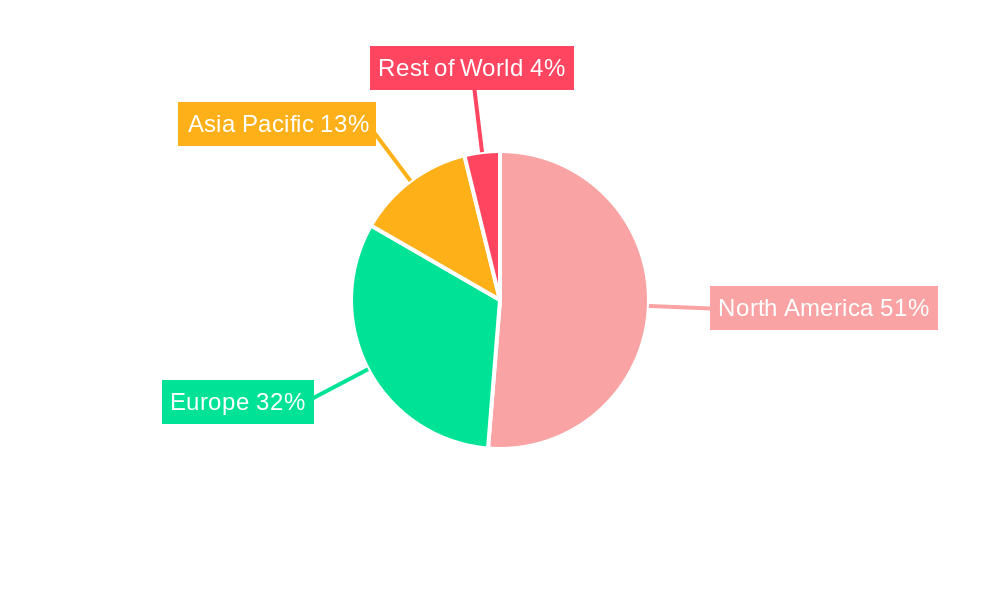
The Mobility as a Service (MaaS) market, valued at $0.78 billion in 2025, is projected to experience robust growth, driven by increasing urbanization, rising fuel costs, and growing environmental concerns. The 7.43% CAGR indicates a significant expansion over the forecast period (2025-2033). Key drivers include the rising adoption of smartphones and mobile applications facilitating seamless integration of various transport modes, the increasing popularity of subscription-based services, and the development of sophisticated data analytics enabling optimized route planning and resource allocation. The market segmentation, encompassing service types (car, bus, bike) and transportation types (public, private), reveals diverse consumer preferences and operational models, offering opportunities for both established players and innovative startups. The competitive landscape is dynamic, featuring a mix of established transportation companies like Hertz and Avis Budget Group, ride-sharing giants such as Uber and Didi Chuxing, and emerging MaaS providers focused on integrated mobility solutions. Geographic expansion is another key aspect, with North America and Europe currently dominating the market, but significant growth potential identified in the Asia-Pacific region driven by rapid urbanization and technological advancements in developing economies. Challenges include regulatory hurdles, data privacy concerns, and ensuring seamless interoperability between different transport systems. Successful MaaS platforms need to address these challenges while constantly innovating to meet evolving customer needs and maintain a competitive edge.
The projected growth is fueled by several factors. Government initiatives promoting sustainable transportation are creating a favorable regulatory environment. Technological advancements, including advancements in AI and IoT, improve the efficiency and user experience of MaaS platforms. The integration of various payment methods and loyalty programs enhances customer convenience and engagement. This overall trend points towards a future where transportation is not just about owning a vehicle, but accessing a range of efficient, affordable, and sustainable options through a single integrated platform. This integrated approach reduces reliance on personal vehicle ownership, thereby minimizing congestion and environmental impact within urban areas. The long-term outlook for the MaaS market remains optimistic, with continued growth anticipated across all segments and regions.
MaaS Market Report: 2019-2033
This comprehensive report provides an in-depth analysis of the Mobility as a Service (MaaS) market, offering invaluable insights for industry professionals, investors, and strategists. Covering the period 2019-2033, with a focus on 2025, this report meticulously examines market dynamics, key players, and future growth potential. The report leverages extensive data analysis and expert insights to deliver actionable intelligence, facilitating informed decision-making in this rapidly evolving sector.
MaaS Market Structure & Innovation Trends
The MaaS market is characterized by a dynamic interplay of established players and emerging disruptors. Market concentration is moderate, with a few dominant players holding significant market share, while numerous smaller companies compete for niche segments. The global MaaS market size in 2024 is estimated at $xx Million, and is projected to reach $xx Million by 2033. The market exhibits a CAGR of xx% during the forecast period (2025-2033).
Key Market Structure Elements:
- Market Concentration: The top 5 players account for approximately xx% of the global market share in 2024.
- Innovation Drivers: Technological advancements in areas such as AI, IoT, and big data analytics are fueling innovation, creating opportunities for seamless integration of transportation services.
- Regulatory Frameworks: Government regulations regarding data privacy, transportation safety, and accessibility significantly influence market development. Varying regulations across geographies create complex market landscapes.
- Product Substitutes: Traditional individual forms of transportation, such as personal vehicle ownership, present a key competitive challenge to MaaS solutions.
- End-User Demographics: The core demographic includes urban dwellers, commuters, and tech-savvy individuals valuing convenience, cost-effectiveness, and sustainability.
- M&A Activities: The MaaS landscape has witnessed several significant mergers and acquisitions (M&As) in recent years, with deal values totaling $xx Million in 2024, primarily driven by efforts to expand market reach and service offerings.
MaaS Market Dynamics & Trends
The MaaS market is experiencing significant growth, driven by several key factors. Urbanization, increasing traffic congestion, rising fuel costs, and growing environmental concerns are all pushing consumers towards more efficient and sustainable transportation alternatives. The increasing adoption of smartphones and the widespread availability of high-speed internet are also critical enablers.
Key Market Dynamics:
- Market Growth Drivers: The global MaaS market is projected to grow at a substantial CAGR of xx% from 2025 to 2033, driven by factors like rising urban populations, increased environmental awareness, and technological advancements.
- Technological Disruptions: The integration of AI, machine learning, and IoT is transforming the MaaS industry, optimizing route planning, predicting demand, and enhancing user experiences.
- Consumer Preferences: Consumers are increasingly seeking convenient, affordable, and environmentally friendly transportation options, aligning perfectly with the core tenets of MaaS. The growing preference for shared mobility services is further accelerating market adoption.
- Competitive Dynamics: The MaaS market is fiercely competitive, with established transportation companies and tech giants vying for market share. Strategic partnerships and collaborations are becoming increasingly prevalent.
- Market Penetration: Market penetration rates vary across regions, with urban areas exhibiting higher adoption rates than rural regions.
Dominant Regions & Segments in MaaS Market
North America currently holds the largest market share within the MaaS sector, driven by robust technological infrastructure, high levels of smartphone penetration, and a receptive consumer base. However, Asia-Pacific is expected to show the highest growth rates during the forecast period.
By Service Type:
- Car: The car segment dominates, benefiting from established infrastructure and widespread consumer familiarity.
- Bus: The bus segment shows steady growth, driven by government initiatives promoting public transit.
- Bike: The bike-sharing segment is experiencing rapid expansion, particularly in urban centers with dedicated cycling infrastructure.
By Transportation Type:
- Public: The public transportation segment is experiencing strong growth fueled by government policies supporting integrated public transit systems.
- Private: The private transportation segment, including ride-hailing and car-sharing services, remains a significant component, offering flexibility and convenience.
Key Drivers for Regional Dominance:
- North America: Strong technological infrastructure, high consumer adoption rates, and supportive government policies.
- Europe: Well-established public transportation systems and increasing environmental regulations.
- Asia-Pacific: Rapid urbanization, rising disposable incomes, and increasing smartphone penetration.
MaaS Market Product Innovations
Recent product developments in the MaaS market focus on enhanced user experiences, including multimodal trip planning, seamless integration with various transportation modes, and personalized travel recommendations. Innovations incorporating AI-powered route optimization, dynamic pricing, and real-time information sharing are becoming increasingly common, improving efficiency and convenience for users. The competitive advantage lies in offering a comprehensive and user-friendly platform, incorporating flexible payment options and personalized services.
Report Scope & Segmentation Analysis
This report segments the MaaS market by service type (car, bus, bike) and transportation type (public, private). Each segment is analyzed based on market size, growth rate, and competitive dynamics. Detailed growth projections are provided for each segment across the forecast period (2025-2033), offering insights into future market trends and opportunities.
Key Drivers of MaaS Market Growth
The MaaS market is propelled by several key growth drivers. Technological advancements in areas such as AI, IoT, and big data are pivotal, enabling efficient trip planning, real-time information, and personalized services. Government initiatives promoting sustainable transportation and smart cities are also contributing significantly. Furthermore, the increasing preference for convenient and cost-effective transportation options fuels strong consumer adoption.
Challenges in the MaaS Market Sector
Significant challenges hinder the growth of the MaaS market. Data privacy concerns and regulatory uncertainty surrounding data usage present hurdles. Integration challenges involving various transportation modes and legacy systems pose operational complexities. Furthermore, intense competition from established transportation providers and tech giants create pressure on margins and profitability.
Emerging Opportunities in MaaS Market
Emerging opportunities include expansion into new markets with less developed public transportation systems. The integration of autonomous vehicles promises to transform the industry, offering greater efficiency and cost-effectiveness. Personalized travel planning and subscription-based models offer lucrative revenue opportunities.
Leading Players in the MaaS Market Market
- The Hertz Corporation (The Hertz Corporation)
- Moovel
- Uber Technologies Inc (Uber Technologies Inc)
- Mobileo
- Beeline Mobility
- Enterprise Holdings Inc (Enterprise Holdings Inc)
- Avis Budget Group (Avis Budget Group)
- Moovit Inc (Moovit Inc)
- Whim (Maas Global)
- Didi Chuxing
- Bridj Technology Pty Ltd
- Ubigo (via-id)
- Citymapper (Citymapper)
Key Developments in MaaS Market Industry
- February 2023: Uber partnered with HSBC to launch a digital payment solution for unbanked drivers in Egypt.
- January 2023: DiDi partnered with Jordan Transfer Guidance for taxi dispatch services.
- December 2022: Moovit launched a MaaS pilot program in Tampa, Florida, integrating multimodal trip planning.
Future Outlook for MaaS Market Market
The future of the MaaS market is bright, with significant growth potential driven by technological innovation, evolving consumer preferences, and supportive government policies. Strategic partnerships, expansion into new markets, and the integration of autonomous vehicles will shape the industry's future trajectory. The market is poised for continued expansion, with significant opportunities for innovation and growth across various segments and regions.
MaaS Market Segmentation
-
1. Service Type
- 1.1. Car
- 1.2. Bus
- 1.3. Bike
-
2. Transportation Type
- 2.1. Public
- 2.2. Private
MaaS Market Segmentation By Geography
-
1. North America
- 1.1. United States
- 1.2. Canada
- 1.3. Rest of North America
-
2. Europe
- 2.1. Germany
- 2.2. United Kingdom
- 2.3. France
- 2.4. Rest of Europe
-
3. Asia Pacific
- 3.1. India
- 3.2. China
- 3.3. Japan
- 3.4. South Korea
- 3.5. Rest of Asia Pacific
-
4. Rest of the World
- 4.1. South America
- 4.2. Middle East and Africa
MaaS Market REPORT HIGHLIGHTS
| Aspects | Details |
|---|---|
| Study Period | 2019-2033 |
| Base Year | 2024 |
| Estimated Year | 2025 |
| Forecast Period | 2025-2033 |
| Historical Period | 2019-2024 |
| Growth Rate | CAGR of 7.43% from 2019-2033 |
| Segmentation |
|
Table of Contents
- 1. Introduction
- 1.1. Research Scope
- 1.2. Market Segmentation
- 1.3. Research Methodology
- 1.4. Definitions and Assumptions
- 2. Executive Summary
- 2.1. Introduction
- 3. Market Dynamics
- 3.1. Introduction
- 3.2. Market Drivers
- 3.2.1. Increasing Vehicle Production; Emphasis on Vehicle Comfort and NVH Reduction
- 3.3. Market Restrains
- 3.3.1. Economic Fluctuations And Uncertainties
- 3.4. Market Trends
- 3.4.1. Increasing Traffic Congestion Drive the Demand in the Market
- 4. Market Factor Analysis
- 4.1. Porters Five Forces
- 4.2. Supply/Value Chain
- 4.3. PESTEL analysis
- 4.4. Market Entropy
- 4.5. Patent/Trademark Analysis
- 5. Global MaaS Market Analysis, Insights and Forecast, 2019-2031
- 5.1. Market Analysis, Insights and Forecast - by Service Type
- 5.1.1. Car
- 5.1.2. Bus
- 5.1.3. Bike
- 5.2. Market Analysis, Insights and Forecast - by Transportation Type
- 5.2.1. Public
- 5.2.2. Private
- 5.3. Market Analysis, Insights and Forecast - by Region
- 5.3.1. North America
- 5.3.2. Europe
- 5.3.3. Asia Pacific
- 5.3.4. Rest of the World
- 5.1. Market Analysis, Insights and Forecast - by Service Type
- 6. North America MaaS Market Analysis, Insights and Forecast, 2019-2031
- 6.1. Market Analysis, Insights and Forecast - by Service Type
- 6.1.1. Car
- 6.1.2. Bus
- 6.1.3. Bike
- 6.2. Market Analysis, Insights and Forecast - by Transportation Type
- 6.2.1. Public
- 6.2.2. Private
- 6.1. Market Analysis, Insights and Forecast - by Service Type
- 7. Europe MaaS Market Analysis, Insights and Forecast, 2019-2031
- 7.1. Market Analysis, Insights and Forecast - by Service Type
- 7.1.1. Car
- 7.1.2. Bus
- 7.1.3. Bike
- 7.2. Market Analysis, Insights and Forecast - by Transportation Type
- 7.2.1. Public
- 7.2.2. Private
- 7.1. Market Analysis, Insights and Forecast - by Service Type
- 8. Asia Pacific MaaS Market Analysis, Insights and Forecast, 2019-2031
- 8.1. Market Analysis, Insights and Forecast - by Service Type
- 8.1.1. Car
- 8.1.2. Bus
- 8.1.3. Bike
- 8.2. Market Analysis, Insights and Forecast - by Transportation Type
- 8.2.1. Public
- 8.2.2. Private
- 8.1. Market Analysis, Insights and Forecast - by Service Type
- 9. Rest of the World MaaS Market Analysis, Insights and Forecast, 2019-2031
- 9.1. Market Analysis, Insights and Forecast - by Service Type
- 9.1.1. Car
- 9.1.2. Bus
- 9.1.3. Bike
- 9.2. Market Analysis, Insights and Forecast - by Transportation Type
- 9.2.1. Public
- 9.2.2. Private
- 9.1. Market Analysis, Insights and Forecast - by Service Type
- 10. North America MaaS Market Analysis, Insights and Forecast, 2019-2031
- 10.1. Market Analysis, Insights and Forecast - By Country/Sub-region
- 10.1.1 United States
- 10.1.2 Canada
- 10.1.3 Rest of North America
- 11. Europe MaaS Market Analysis, Insights and Forecast, 2019-2031
- 11.1. Market Analysis, Insights and Forecast - By Country/Sub-region
- 11.1.1 Germany
- 11.1.2 United Kingdom
- 11.1.3 France
- 11.1.4 Rest of Europe
- 12. Asia Pacific MaaS Market Analysis, Insights and Forecast, 2019-2031
- 12.1. Market Analysis, Insights and Forecast - By Country/Sub-region
- 12.1.1 India
- 12.1.2 China
- 12.1.3 Japan
- 12.1.4 South Korea
- 12.1.5 Rest of Asia Pacific
- 13. Rest of the World MaaS Market Analysis, Insights and Forecast, 2019-2031
- 13.1. Market Analysis, Insights and Forecast - By Country/Sub-region
- 13.1.1 South America
- 13.1.2 Middle East and Africa
- 14. Competitive Analysis
- 14.1. Global Market Share Analysis 2024
- 14.2. Company Profiles
- 14.2.1 The Hertz Corporation
- 14.2.1.1. Overview
- 14.2.1.2. Products
- 14.2.1.3. SWOT Analysis
- 14.2.1.4. Recent Developments
- 14.2.1.5. Financials (Based on Availability)
- 14.2.2 Moovel
- 14.2.2.1. Overview
- 14.2.2.2. Products
- 14.2.2.3. SWOT Analysis
- 14.2.2.4. Recent Developments
- 14.2.2.5. Financials (Based on Availability)
- 14.2.3 Uber Technologies Inc
- 14.2.3.1. Overview
- 14.2.3.2. Products
- 14.2.3.3. SWOT Analysis
- 14.2.3.4. Recent Developments
- 14.2.3.5. Financials (Based on Availability)
- 14.2.4 Mobileo
- 14.2.4.1. Overview
- 14.2.4.2. Products
- 14.2.4.3. SWOT Analysis
- 14.2.4.4. Recent Developments
- 14.2.4.5. Financials (Based on Availability)
- 14.2.5 Beeline Mobility
- 14.2.5.1. Overview
- 14.2.5.2. Products
- 14.2.5.3. SWOT Analysis
- 14.2.5.4. Recent Developments
- 14.2.5.5. Financials (Based on Availability)
- 14.2.6 Enterprise Holdings Inc
- 14.2.6.1. Overview
- 14.2.6.2. Products
- 14.2.6.3. SWOT Analysis
- 14.2.6.4. Recent Developments
- 14.2.6.5. Financials (Based on Availability)
- 14.2.7 Avis Budget Group
- 14.2.7.1. Overview
- 14.2.7.2. Products
- 14.2.7.3. SWOT Analysis
- 14.2.7.4. Recent Developments
- 14.2.7.5. Financials (Based on Availability)
- 14.2.8 Moovit Inc
- 14.2.8.1. Overview
- 14.2.8.2. Products
- 14.2.8.3. SWOT Analysis
- 14.2.8.4. Recent Developments
- 14.2.8.5. Financials (Based on Availability)
- 14.2.9 Whim (Maas Global)
- 14.2.9.1. Overview
- 14.2.9.2. Products
- 14.2.9.3. SWOT Analysis
- 14.2.9.4. Recent Developments
- 14.2.9.5. Financials (Based on Availability)
- 14.2.10 Didi Chuxing
- 14.2.10.1. Overview
- 14.2.10.2. Products
- 14.2.10.3. SWOT Analysis
- 14.2.10.4. Recent Developments
- 14.2.10.5. Financials (Based on Availability)
- 14.2.11 Bridj Technology Pty Ltd
- 14.2.11.1. Overview
- 14.2.11.2. Products
- 14.2.11.3. SWOT Analysis
- 14.2.11.4. Recent Developments
- 14.2.11.5. Financials (Based on Availability)
- 14.2.12 Ubigo (via-id)
- 14.2.12.1. Overview
- 14.2.12.2. Products
- 14.2.12.3. SWOT Analysis
- 14.2.12.4. Recent Developments
- 14.2.12.5. Financials (Based on Availability)
- 14.2.13 Citymapper
- 14.2.13.1. Overview
- 14.2.13.2. Products
- 14.2.13.3. SWOT Analysis
- 14.2.13.4. Recent Developments
- 14.2.13.5. Financials (Based on Availability)
- 14.2.1 The Hertz Corporation
List of Figures
- Figure 1: Global MaaS Market Revenue Breakdown (Million, %) by Region 2024 & 2032
- Figure 2: North America MaaS Market Revenue (Million), by Country 2024 & 2032
- Figure 3: North America MaaS Market Revenue Share (%), by Country 2024 & 2032
- Figure 4: Europe MaaS Market Revenue (Million), by Country 2024 & 2032
- Figure 5: Europe MaaS Market Revenue Share (%), by Country 2024 & 2032
- Figure 6: Asia Pacific MaaS Market Revenue (Million), by Country 2024 & 2032
- Figure 7: Asia Pacific MaaS Market Revenue Share (%), by Country 2024 & 2032
- Figure 8: Rest of the World MaaS Market Revenue (Million), by Country 2024 & 2032
- Figure 9: Rest of the World MaaS Market Revenue Share (%), by Country 2024 & 2032
- Figure 10: North America MaaS Market Revenue (Million), by Service Type 2024 & 2032
- Figure 11: North America MaaS Market Revenue Share (%), by Service Type 2024 & 2032
- Figure 12: North America MaaS Market Revenue (Million), by Transportation Type 2024 & 2032
- Figure 13: North America MaaS Market Revenue Share (%), by Transportation Type 2024 & 2032
- Figure 14: North America MaaS Market Revenue (Million), by Country 2024 & 2032
- Figure 15: North America MaaS Market Revenue Share (%), by Country 2024 & 2032
- Figure 16: Europe MaaS Market Revenue (Million), by Service Type 2024 & 2032
- Figure 17: Europe MaaS Market Revenue Share (%), by Service Type 2024 & 2032
- Figure 18: Europe MaaS Market Revenue (Million), by Transportation Type 2024 & 2032
- Figure 19: Europe MaaS Market Revenue Share (%), by Transportation Type 2024 & 2032
- Figure 20: Europe MaaS Market Revenue (Million), by Country 2024 & 2032
- Figure 21: Europe MaaS Market Revenue Share (%), by Country 2024 & 2032
- Figure 22: Asia Pacific MaaS Market Revenue (Million), by Service Type 2024 & 2032
- Figure 23: Asia Pacific MaaS Market Revenue Share (%), by Service Type 2024 & 2032
- Figure 24: Asia Pacific MaaS Market Revenue (Million), by Transportation Type 2024 & 2032
- Figure 25: Asia Pacific MaaS Market Revenue Share (%), by Transportation Type 2024 & 2032
- Figure 26: Asia Pacific MaaS Market Revenue (Million), by Country 2024 & 2032
- Figure 27: Asia Pacific MaaS Market Revenue Share (%), by Country 2024 & 2032
- Figure 28: Rest of the World MaaS Market Revenue (Million), by Service Type 2024 & 2032
- Figure 29: Rest of the World MaaS Market Revenue Share (%), by Service Type 2024 & 2032
- Figure 30: Rest of the World MaaS Market Revenue (Million), by Transportation Type 2024 & 2032
- Figure 31: Rest of the World MaaS Market Revenue Share (%), by Transportation Type 2024 & 2032
- Figure 32: Rest of the World MaaS Market Revenue (Million), by Country 2024 & 2032
- Figure 33: Rest of the World MaaS Market Revenue Share (%), by Country 2024 & 2032
List of Tables
- Table 1: Global MaaS Market Revenue Million Forecast, by Region 2019 & 2032
- Table 2: Global MaaS Market Revenue Million Forecast, by Service Type 2019 & 2032
- Table 3: Global MaaS Market Revenue Million Forecast, by Transportation Type 2019 & 2032
- Table 4: Global MaaS Market Revenue Million Forecast, by Region 2019 & 2032
- Table 5: Global MaaS Market Revenue Million Forecast, by Country 2019 & 2032
- Table 6: United States MaaS Market Revenue (Million) Forecast, by Application 2019 & 2032
- Table 7: Canada MaaS Market Revenue (Million) Forecast, by Application 2019 & 2032
- Table 8: Rest of North America MaaS Market Revenue (Million) Forecast, by Application 2019 & 2032
- Table 9: Global MaaS Market Revenue Million Forecast, by Country 2019 & 2032
- Table 10: Germany MaaS Market Revenue (Million) Forecast, by Application 2019 & 2032
- Table 11: United Kingdom MaaS Market Revenue (Million) Forecast, by Application 2019 & 2032
- Table 12: France MaaS Market Revenue (Million) Forecast, by Application 2019 & 2032
- Table 13: Rest of Europe MaaS Market Revenue (Million) Forecast, by Application 2019 & 2032
- Table 14: Global MaaS Market Revenue Million Forecast, by Country 2019 & 2032
- Table 15: India MaaS Market Revenue (Million) Forecast, by Application 2019 & 2032
- Table 16: China MaaS Market Revenue (Million) Forecast, by Application 2019 & 2032
- Table 17: Japan MaaS Market Revenue (Million) Forecast, by Application 2019 & 2032
- Table 18: South Korea MaaS Market Revenue (Million) Forecast, by Application 2019 & 2032
- Table 19: Rest of Asia Pacific MaaS Market Revenue (Million) Forecast, by Application 2019 & 2032
- Table 20: Global MaaS Market Revenue Million Forecast, by Country 2019 & 2032
- Table 21: South America MaaS Market Revenue (Million) Forecast, by Application 2019 & 2032
- Table 22: Middle East and Africa MaaS Market Revenue (Million) Forecast, by Application 2019 & 2032
- Table 23: Global MaaS Market Revenue Million Forecast, by Service Type 2019 & 2032
- Table 24: Global MaaS Market Revenue Million Forecast, by Transportation Type 2019 & 2032
- Table 25: Global MaaS Market Revenue Million Forecast, by Country 2019 & 2032
- Table 26: United States MaaS Market Revenue (Million) Forecast, by Application 2019 & 2032
- Table 27: Canada MaaS Market Revenue (Million) Forecast, by Application 2019 & 2032
- Table 28: Rest of North America MaaS Market Revenue (Million) Forecast, by Application 2019 & 2032
- Table 29: Global MaaS Market Revenue Million Forecast, by Service Type 2019 & 2032
- Table 30: Global MaaS Market Revenue Million Forecast, by Transportation Type 2019 & 2032
- Table 31: Global MaaS Market Revenue Million Forecast, by Country 2019 & 2032
- Table 32: Germany MaaS Market Revenue (Million) Forecast, by Application 2019 & 2032
- Table 33: United Kingdom MaaS Market Revenue (Million) Forecast, by Application 2019 & 2032
- Table 34: France MaaS Market Revenue (Million) Forecast, by Application 2019 & 2032
- Table 35: Rest of Europe MaaS Market Revenue (Million) Forecast, by Application 2019 & 2032
- Table 36: Global MaaS Market Revenue Million Forecast, by Service Type 2019 & 2032
- Table 37: Global MaaS Market Revenue Million Forecast, by Transportation Type 2019 & 2032
- Table 38: Global MaaS Market Revenue Million Forecast, by Country 2019 & 2032
- Table 39: India MaaS Market Revenue (Million) Forecast, by Application 2019 & 2032
- Table 40: China MaaS Market Revenue (Million) Forecast, by Application 2019 & 2032
- Table 41: Japan MaaS Market Revenue (Million) Forecast, by Application 2019 & 2032
- Table 42: South Korea MaaS Market Revenue (Million) Forecast, by Application 2019 & 2032
- Table 43: Rest of Asia Pacific MaaS Market Revenue (Million) Forecast, by Application 2019 & 2032
- Table 44: Global MaaS Market Revenue Million Forecast, by Service Type 2019 & 2032
- Table 45: Global MaaS Market Revenue Million Forecast, by Transportation Type 2019 & 2032
- Table 46: Global MaaS Market Revenue Million Forecast, by Country 2019 & 2032
- Table 47: South America MaaS Market Revenue (Million) Forecast, by Application 2019 & 2032
- Table 48: Middle East and Africa MaaS Market Revenue (Million) Forecast, by Application 2019 & 2032
Frequently Asked Questions
1. What is the projected Compound Annual Growth Rate (CAGR) of the MaaS Market?
The projected CAGR is approximately 7.43%.
2. Which companies are prominent players in the MaaS Market?
Key companies in the market include The Hertz Corporation, Moovel, Uber Technologies Inc, Mobileo, Beeline Mobility, Enterprise Holdings Inc, Avis Budget Group, Moovit Inc, Whim (Maas Global), Didi Chuxing, Bridj Technology Pty Ltd, Ubigo (via-id), Citymapper.
3. What are the main segments of the MaaS Market?
The market segments include Service Type, Transportation Type.
4. Can you provide details about the market size?
The market size is estimated to be USD 0.78 Million as of 2022.
5. What are some drivers contributing to market growth?
Increasing Vehicle Production; Emphasis on Vehicle Comfort and NVH Reduction.
6. What are the notable trends driving market growth?
Increasing Traffic Congestion Drive the Demand in the Market.
7. Are there any restraints impacting market growth?
Economic Fluctuations And Uncertainties.
8. Can you provide examples of recent developments in the market?
In February 2023, Uber partnered with financial services firm HSBC to launch a digital payments solution that allows unbanked drivers in Egypt to receive on-demand cash outs into mobile wallets. Through this collaboration, the companies hope to provide Uber platform drivers with access to 100% of their earnings in a timely and convenient manner via HSBC Net's payment solution.
9. What pricing options are available for accessing the report?
Pricing options include single-user, multi-user, and enterprise licenses priced at USD 4750, USD 5250, and USD 8750 respectively.
10. Is the market size provided in terms of value or volume?
The market size is provided in terms of value, measured in Million.
11. Are there any specific market keywords associated with the report?
Yes, the market keyword associated with the report is "MaaS Market," which aids in identifying and referencing the specific market segment covered.
12. How do I determine which pricing option suits my needs best?
The pricing options vary based on user requirements and access needs. Individual users may opt for single-user licenses, while businesses requiring broader access may choose multi-user or enterprise licenses for cost-effective access to the report.
13. Are there any additional resources or data provided in the MaaS Market report?
While the report offers comprehensive insights, it's advisable to review the specific contents or supplementary materials provided to ascertain if additional resources or data are available.
14. How can I stay updated on further developments or reports in the MaaS Market?
To stay informed about further developments, trends, and reports in the MaaS Market, consider subscribing to industry newsletters, following relevant companies and organizations, or regularly checking reputable industry news sources and publications.
Methodology
Step 1 - Identification of Relevant Samples Size from Population Database


Step 2 - Approaches for Defining Global Market Size (Value, Volume* & Price*)

Note*: In applicable scenarios
Step 3 - Data Sources
Primary Research
- Web Analytics
- Survey Reports
- Research Institute
- Latest Research Reports
- Opinion Leaders
Secondary Research
- Annual Reports
- White Paper
- Latest Press Release
- Industry Association
- Paid Database
- Investor Presentations

Step 4 - Data Triangulation
Involves using different sources of information in order to increase the validity of a study
These sources are likely to be stakeholders in a program - participants, other researchers, program staff, other community members, and so on.
Then we put all data in single framework & apply various statistical tools to find out the dynamic on the market.
During the analysis stage, feedback from the stakeholder groups would be compared to determine areas of agreement as well as areas of divergence


