

Key Insights
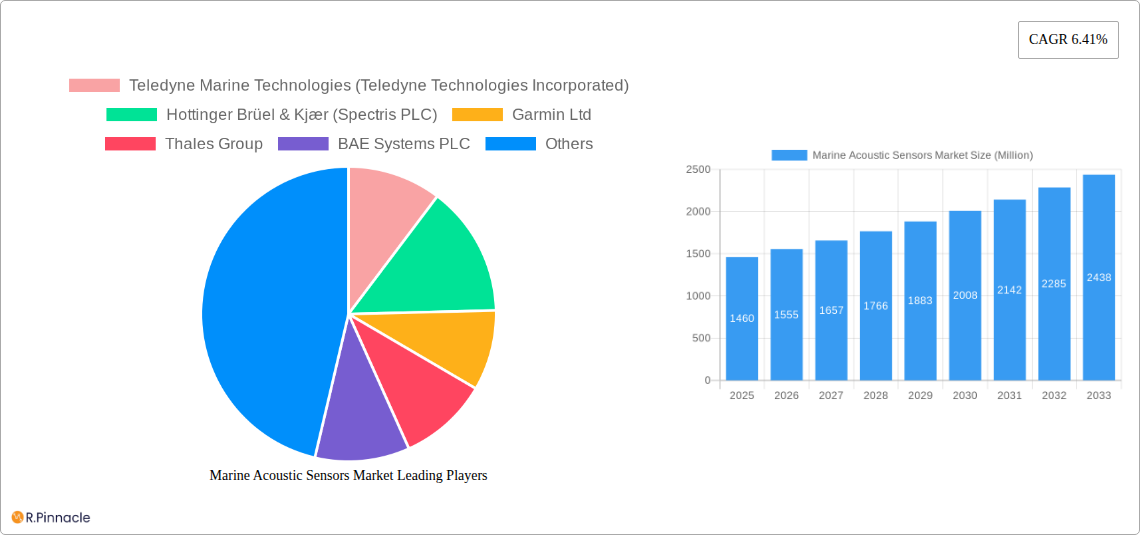
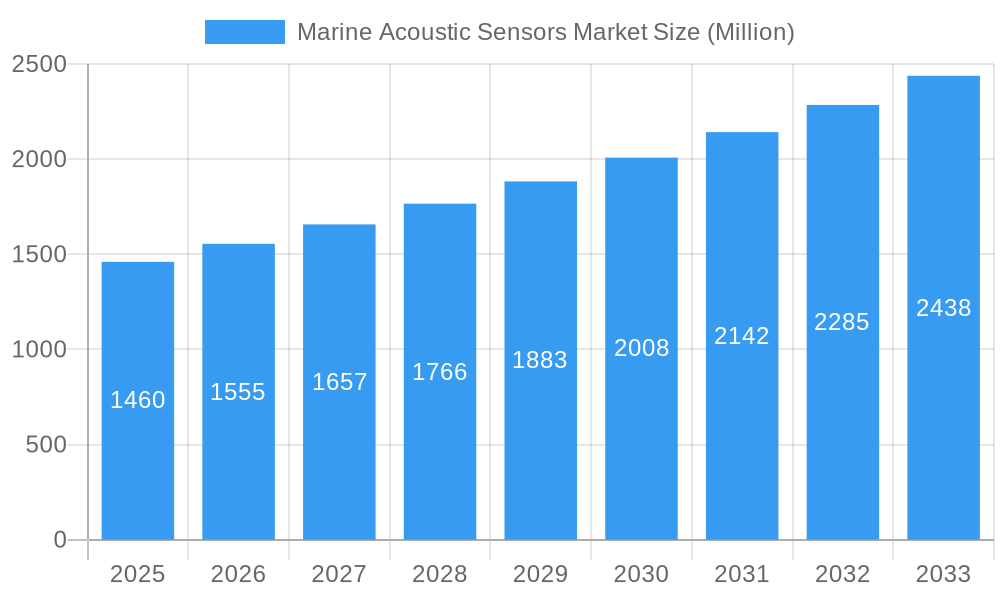
The global marine acoustic sensor market, valued at $1.46 billion in 2025, is projected to experience robust growth, driven by increasing demand for advanced underwater surveillance and exploration technologies. The market's Compound Annual Growth Rate (CAGR) of 6.41% from 2025 to 2033 indicates a significant expansion opportunity. This growth is fueled by several key factors, including the rising adoption of autonomous underwater vehicles (AUVs) and remotely operated vehicles (ROVs) in various applications like oceanographic research, offshore oil and gas exploration, and defense. Furthermore, advancements in sensor technology, leading to improved accuracy, sensitivity, and range, are significantly boosting market demand. The growing focus on underwater infrastructure monitoring and the increasing need for effective underwater communication systems are also contributing to market expansion. Major segments within the market include hydrophones, underwater transducers, acoustic towed arrays, and side-scan sonars, each catering to specific applications and offering unique functionalities. Competition is intense, with key players such as Teledyne Marine Technologies, Hottinger Brüel & Kjær, and Garmin leading the innovation and market share. Geographical expansion is anticipated across North America, Europe, Asia-Pacific, and other regions, driven by government investments in marine research and infrastructure development.
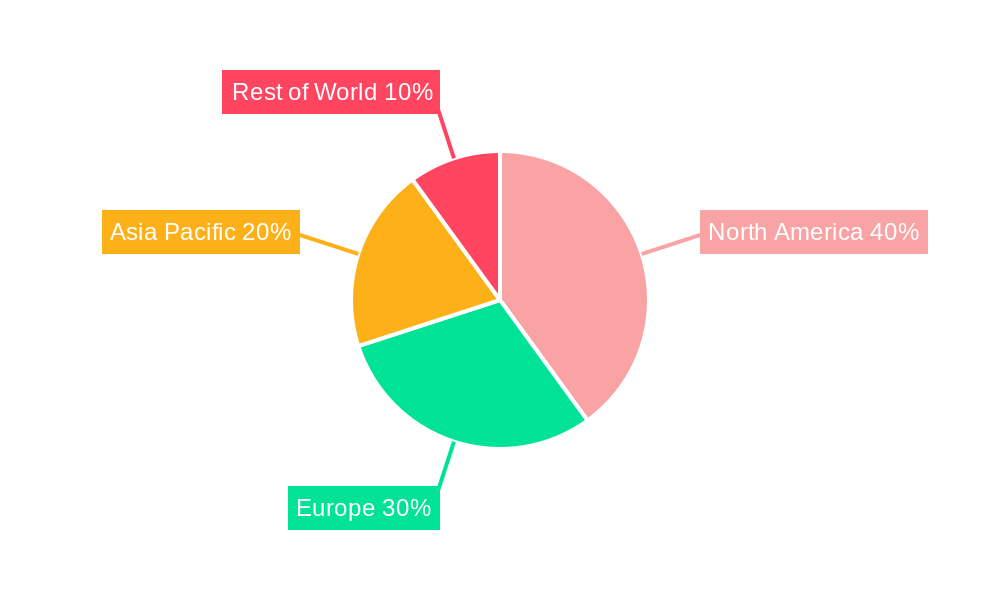
Marine Acoustic Sensors Market Market Size (In Billion)
The geographical distribution of the market reflects regional variations in technological adoption and economic activity. North America currently holds a significant market share, attributed to the substantial presence of established players and robust R&D activities. However, the Asia-Pacific region is projected to witness the fastest growth rate in the forecast period, driven by increasing infrastructure development, particularly in offshore wind energy and coastal surveillance. Europe and other regions are also expected to contribute significantly to overall market growth, propelled by the rising adoption of marine acoustic sensors in various sectors. Despite the promising outlook, market growth might face some challenges, such as the high initial investment cost associated with advanced sensor systems and the need for specialized expertise in their operation and maintenance. Nevertheless, the overall market outlook remains positive, anticipating considerable expansion throughout the forecast period.
Marine Acoustic Sensors Market Company Market Share
Marine Acoustic Sensors Market Report: 2019-2033
This comprehensive report provides a detailed analysis of the Marine Acoustic Sensors Market, offering invaluable insights for industry professionals, investors, and strategic decision-makers. Covering the period from 2019 to 2033, with a focus on 2025, this report unveils market dynamics, technological advancements, and key players shaping this evolving landscape. The market is projected to reach xx Million by 2033, exhibiting a robust CAGR of xx% during the forecast period (2025-2033).
Marine Acoustic Sensors Market Structure & Innovation Trends
The Marine Acoustic Sensors market is characterized by a moderately concentrated landscape, with key players holding significant market share. Teledyne Marine Technologies, Hottinger Brüel & Kjær, and Garmin Ltd. are among the leading companies, collectively accounting for an estimated xx% of the market in 2025. Innovation is driven by the increasing demand for advanced underwater surveillance, oceanographic research, and offshore exploration activities.
- Market Concentration: Moderate, with a few dominant players.
- Innovation Drivers: Advances in sensor technology, miniaturization, improved signal processing, and the need for real-time data acquisition.
- Regulatory Frameworks: International maritime regulations and environmental protection guidelines significantly influence market growth. Compliance necessitates robust and reliable sensor technology.
- Product Substitutes: Limited substitutes exist; the unique capabilities of acoustic sensors make them indispensable for various applications.
- End-User Demographics: The market is diverse, encompassing government agencies, research institutions, defense organizations, and commercial entities involved in oil and gas exploration, fisheries management, and underwater infrastructure monitoring.
- M&A Activities: Consolidation is likely, with larger players acquiring smaller companies to expand their product portfolios and technological capabilities. The total value of M&A deals in the sector during 2019-2024 is estimated at xx Million.
Marine Acoustic Sensors Market Dynamics & Trends
The Marine Acoustic Sensors market is experiencing significant growth, fueled by several factors. Increasing investments in underwater infrastructure development, rising demand for advanced surveillance systems, and the growing focus on marine environmental monitoring are key drivers. Technological advancements, such as the development of more sensitive and energy-efficient sensors, are further accelerating market growth. The market penetration rate for advanced acoustic sensors in offshore oil and gas exploration is estimated at xx% in 2025, with a projected increase to xx% by 2033. Competitive dynamics are intensifying, with companies focusing on product differentiation, innovation, and strategic partnerships.
Dominant Regions & Segments in Marine Acoustic Sensors Market
North America currently holds the largest market share, driven by robust defense spending and a well-established offshore oil and gas industry. Within product segments, Hydrophones represent the largest market share, followed by Underwater Transducers.
- North America Dominance: Strong defense spending, advanced technological infrastructure, and a substantial presence of key players contribute to its leading position.
- Key Drivers in North America:
- High government investment in defense and marine research.
- Well-developed oil & gas industry.
- Presence of major manufacturers and research institutions.
- Hydrophones Market Segment Leadership: Wide application in various fields, including oceanographic research, underwater communication, and defense.
- Underwater Transducer Market Growth: Driven by its role in sonar systems, underwater communication, and remote sensing.
- Acoustic Towed Array & Side-scan Sonar Market Potential: Growth potential lies in military applications and detailed seabed mapping.
Marine Acoustic Sensors Market Product Innovations
Recent innovations focus on enhancing sensor sensitivity, reducing power consumption, and improving data processing capabilities. Miniaturization and the integration of advanced signal processing algorithms are key trends, leading to more compact, efficient, and reliable sensors. These advancements are improving the market fit by providing improved accuracy, reduced costs, and enhanced capabilities for a wider range of applications.
Report Scope & Segmentation Analysis
This report segments the Marine Acoustic Sensors market by product type: Hydrophones, Underwater Transducer, Acoustic Towed Array, and Side-scan Sonar. Each segment is analyzed based on market size, growth projections, and competitive dynamics. The Hydrophone segment is expected to witness the highest growth rate over the forecast period, driven by its diverse applications. The Underwater Transducer market is expected to expand steadily, driven by increasing demand for sonar systems and underwater communication technologies. The Acoustic Towed Array and Side-scan Sonar segments are expected to experience moderate growth, driven primarily by military and research applications.
Key Drivers of Marine Acoustic Sensors Market Growth
The Marine Acoustic Sensors market is driven by several factors:
- Technological Advancements: Improved sensor sensitivity, miniaturization, and enhanced data processing capabilities.
- Increased Demand for Underwater Surveillance: Growing need for security in maritime operations and coastal defense.
- Growth of Offshore Industries: Expansion of oil and gas exploration, renewable energy projects, and underwater infrastructure development.
- Rising Focus on Oceanographic Research: Increased investments in marine science and environmental monitoring.
Challenges in the Marine Acoustic Sensors Market Sector
Several challenges hinder market growth:
- High Initial Investment Costs: The cost of procuring and deploying advanced acoustic sensors can be substantial, limiting adoption by smaller companies.
- Technological Complexity: Advanced sensor technology requires specialized expertise for installation, operation, and maintenance, potentially restricting access for some users.
- Environmental Regulations: Strict environmental guidelines governing underwater noise pollution can impact sensor design and deployment.
Emerging Opportunities in Marine Acoustic Sensors Market
- Autonomous Underwater Vehicles (AUVs): Integration of acoustic sensors into AUVs for improved underwater exploration and data acquisition.
- Artificial Intelligence (AI) and Machine Learning (ML): The application of AI and ML algorithms for enhanced data analysis and pattern recognition in underwater acoustic data.
- Expansion into New Markets: Growing demand for acoustic sensors in fisheries management, marine mammal research, and underwater archaeology.
Leading Players in the Marine Acoustic Sensors Market Market
- Teledyne Marine Technologies (Teledyne Technologies Incorporated)
- Hottinger Brüel & Kjær (Spectris PLC)
- Garmin Ltd
- Thales Group
- BAE Systems PLC
- L3harris Technologies Inc
- Cobham Ultra Seniorco S à R l
- CTS Corporation
- Ocean Sonics Ltd
- Geospectrum Technologies Inc
Key Developments in Marine Acoustic Sensors Market Industry
- June 2023: RPS presented Neptune, a predictive algorithm for accurately detecting marine mammal vocalizations, addressing concerns about the impact of sub-sea sound on marine life during offshore wind and oil and gas exploration.
- January 2023: Launch of the 'Jaywun' marine research vessel by the Environment Agency – Abu Dhabi (EAD), representing a significant advancement in marine research capabilities in the UAE and globally.
Future Outlook for Marine Acoustic Sensors Market Market
The Marine Acoustic Sensors market is poised for continued expansion, driven by technological advancements, increasing investments in offshore infrastructure, and a growing focus on marine environmental monitoring. Strategic partnerships, product innovation, and expansion into new applications will be key factors shaping future growth. The market is projected to experience substantial growth, offering significant opportunities for companies that can effectively address the evolving needs of this dynamic sector.
Marine Acoustic Sensors Market Segmentation
-
1. Product
- 1.1. Hydrophones
- 1.2. Underwater Transducer
- 1.3. Acoustic Towed Array
- 1.4. Side-scan Sonar
-
2. Application
- 2.1. Offshore Oil & Gas
- 2.2. Defense
- 2.3. Oceanography
- 2.4. Fisheries
-
3. Geography
- 3.1. North America
- 3.2. Europe
- 3.3. Asia-Pacific
- 3.4. Rest of the World
Marine Acoustic Sensors Market Segmentation By Geography
- 1. North America
- 2. Europe
- 3. Asia
- 4. Australia and New Zealand
- 5. Latin America
Marine Acoustic Sensors Market Regional Market Share
Geographic Coverage of Marine Acoustic Sensors Market
Marine Acoustic Sensors Market REPORT HIGHLIGHTS
| Aspects | Details |
|---|---|
| Study Period | 2020-2034 |
| Base Year | 2025 |
| Estimated Year | 2026 |
| Forecast Period | 2026-2034 |
| Historical Period | 2020-2025 |
| Growth Rate | CAGR of 6.41% from 2020-2034 |
| Segmentation |
|
Table of Contents
- 1. Introduction
- 1.1. Research Scope
- 1.2. Market Segmentation
- 1.3. Research Objective
- 1.4. Definitions and Assumptions
- 2. Executive Summary
- 2.1. Market Snapshot
- 3. Market Dynamics
- 3.1. Market Drivers
- 3.2. Market Restrains
- 3.3. Market Trends
- 3.4. Market Opportunities
- 4. Market Factor Analysis
- 4.1. Porters Five Forces
- 4.1.1. Bargaining Power of Suppliers
- 4.1.2. Bargaining Power of Buyers
- 4.1.3. Threat of New Entrants
- 4.1.4. Threat of Substitutes
- 4.1.5. Competitive Rivalry
- 4.2. PESTEL analysis
- 4.3. BCG Analysis
- 4.3.1. Stars (High Growth, High Market Share)
- 4.3.2. Cash Cows (Low Growth, High Market Share)
- 4.3.3. Question Mark (High Growth, Low Market Share)
- 4.3.4. Dogs (Low Growth, Low Market Share)
- 4.4. Ansoff Matrix Analysis
- 4.5. Supply Chain Analysis
- 4.6. Regulatory Landscape
- 4.7. Current Market Potential and Opportunity Assessment (TAM–SAM–SOM Framework)
- 4.8. PRI Analyst Note
- 4.1. Porters Five Forces
- 5. Market Analysis, Insights and Forecast 2021-2033
- 5.1. Market Analysis, Insights and Forecast - by Product
- 5.1.1. Hydrophones
- 5.1.2. Underwater Transducer
- 5.1.3. Acoustic Towed Array
- 5.1.4. Side-scan Sonar
- 5.2. Market Analysis, Insights and Forecast - by Application
- 5.2.1. Offshore Oil & Gas
- 5.2.2. Defense
- 5.2.3. Oceanography
- 5.2.4. Fisheries
- 5.3. Market Analysis, Insights and Forecast - by Geography
- 5.3.1. North America
- 5.3.2. Europe
- 5.3.3. Asia-Pacific
- 5.3.4. Rest of the World
- 5.4. Market Analysis, Insights and Forecast - by Region
- 5.4.1. North America
- 5.4.2. Europe
- 5.4.3. Asia
- 5.4.4. Australia and New Zealand
- 5.4.5. Latin America
- 5.1. Market Analysis, Insights and Forecast - by Product
- 6. Global Marine Acoustic Sensors Market Analysis, Insights and Forecast, 2021-2033
- 6.1. Market Analysis, Insights and Forecast - by Product
- 6.1.1. Hydrophones
- 6.1.2. Underwater Transducer
- 6.1.3. Acoustic Towed Array
- 6.1.4. Side-scan Sonar
- 6.2. Market Analysis, Insights and Forecast - by Application
- 6.2.1. Offshore Oil & Gas
- 6.2.2. Defense
- 6.2.3. Oceanography
- 6.2.4. Fisheries
- 6.3. Market Analysis, Insights and Forecast - by Geography
- 6.3.1. North America
- 6.3.2. Europe
- 6.3.3. Asia-Pacific
- 6.3.4. Rest of the World
- 6.1. Market Analysis, Insights and Forecast - by Product
- 7. North America Marine Acoustic Sensors Market Analysis, Insights and Forecast, 2020-2032
- 7.1. Market Analysis, Insights and Forecast - by Product
- 7.1.1. Hydrophones
- 7.1.2. Underwater Transducer
- 7.1.3. Acoustic Towed Array
- 7.1.4. Side-scan Sonar
- 7.2. Market Analysis, Insights and Forecast - by Application
- 7.2.1. Offshore Oil & Gas
- 7.2.2. Defense
- 7.2.3. Oceanography
- 7.2.4. Fisheries
- 7.3. Market Analysis, Insights and Forecast - by Geography
- 7.3.1. North America
- 7.3.2. Europe
- 7.3.3. Asia-Pacific
- 7.3.4. Rest of the World
- 7.1. Market Analysis, Insights and Forecast - by Product
- 8. Europe Marine Acoustic Sensors Market Analysis, Insights and Forecast, 2020-2032
- 8.1. Market Analysis, Insights and Forecast - by Product
- 8.1.1. Hydrophones
- 8.1.2. Underwater Transducer
- 8.1.3. Acoustic Towed Array
- 8.1.4. Side-scan Sonar
- 8.2. Market Analysis, Insights and Forecast - by Application
- 8.2.1. Offshore Oil & Gas
- 8.2.2. Defense
- 8.2.3. Oceanography
- 8.2.4. Fisheries
- 8.3. Market Analysis, Insights and Forecast - by Geography
- 8.3.1. North America
- 8.3.2. Europe
- 8.3.3. Asia-Pacific
- 8.3.4. Rest of the World
- 8.1. Market Analysis, Insights and Forecast - by Product
- 9. Asia Marine Acoustic Sensors Market Analysis, Insights and Forecast, 2020-2032
- 9.1. Market Analysis, Insights and Forecast - by Product
- 9.1.1. Hydrophones
- 9.1.2. Underwater Transducer
- 9.1.3. Acoustic Towed Array
- 9.1.4. Side-scan Sonar
- 9.2. Market Analysis, Insights and Forecast - by Application
- 9.2.1. Offshore Oil & Gas
- 9.2.2. Defense
- 9.2.3. Oceanography
- 9.2.4. Fisheries
- 9.3. Market Analysis, Insights and Forecast - by Geography
- 9.3.1. North America
- 9.3.2. Europe
- 9.3.3. Asia-Pacific
- 9.3.4. Rest of the World
- 9.1. Market Analysis, Insights and Forecast - by Product
- 10. Australia and New Zealand Marine Acoustic Sensors Market Analysis, Insights and Forecast, 2020-2032
- 10.1. Market Analysis, Insights and Forecast - by Product
- 10.1.1. Hydrophones
- 10.1.2. Underwater Transducer
- 10.1.3. Acoustic Towed Array
- 10.1.4. Side-scan Sonar
- 10.2. Market Analysis, Insights and Forecast - by Application
- 10.2.1. Offshore Oil & Gas
- 10.2.2. Defense
- 10.2.3. Oceanography
- 10.2.4. Fisheries
- 10.3. Market Analysis, Insights and Forecast - by Geography
- 10.3.1. North America
- 10.3.2. Europe
- 10.3.3. Asia-Pacific
- 10.3.4. Rest of the World
- 10.1. Market Analysis, Insights and Forecast - by Product
- 11. Latin America Marine Acoustic Sensors Market Analysis, Insights and Forecast, 2020-2032
- 11.1. Market Analysis, Insights and Forecast - by Product
- 11.1.1. Hydrophones
- 11.1.2. Underwater Transducer
- 11.1.3. Acoustic Towed Array
- 11.1.4. Side-scan Sonar
- 11.2. Market Analysis, Insights and Forecast - by Application
- 11.2.1. Offshore Oil & Gas
- 11.2.2. Defense
- 11.2.3. Oceanography
- 11.2.4. Fisheries
- 11.3. Market Analysis, Insights and Forecast - by Geography
- 11.3.1. North America
- 11.3.2. Europe
- 11.3.3. Asia-Pacific
- 11.3.4. Rest of the World
- 11.1. Market Analysis, Insights and Forecast - by Product
- 12. Competitive Analysis
- 12.1. Company Profiles
- 12.1.1 Teledyne Marine Technologies (Teledyne Technologies Incorporated)
- 12.1.1.1. Company Overview
- 12.1.1.2. Products
- 12.1.1.3. Company Financials
- 12.1.1.4. SWOT Analysis
- 12.1.2 Hottinger Brüel & Kjær (Spectris PLC)
- 12.1.2.1. Company Overview
- 12.1.2.2. Products
- 12.1.2.3. Company Financials
- 12.1.2.4. SWOT Analysis
- 12.1.3 Garmin Ltd
- 12.1.3.1. Company Overview
- 12.1.3.2. Products
- 12.1.3.3. Company Financials
- 12.1.3.4. SWOT Analysis
- 12.1.4 Thales Group
- 12.1.4.1. Company Overview
- 12.1.4.2. Products
- 12.1.4.3. Company Financials
- 12.1.4.4. SWOT Analysis
- 12.1.5 BAE Systems PLC
- 12.1.5.1. Company Overview
- 12.1.5.2. Products
- 12.1.5.3. Company Financials
- 12.1.5.4. SWOT Analysis
- 12.1.6 L3harris Technologies Inc
- 12.1.6.1. Company Overview
- 12.1.6.2. Products
- 12.1.6.3. Company Financials
- 12.1.6.4. SWOT Analysis
- 12.1.7 Cobham Ultra Seniorco S à R l
- 12.1.7.1. Company Overview
- 12.1.7.2. Products
- 12.1.7.3. Company Financials
- 12.1.7.4. SWOT Analysis
- 12.1.8 CTS Corporatio
- 12.1.8.1. Company Overview
- 12.1.8.2. Products
- 12.1.8.3. Company Financials
- 12.1.8.4. SWOT Analysis
- 12.1.9 Ocean Sonics Ltd
- 12.1.9.1. Company Overview
- 12.1.9.2. Products
- 12.1.9.3. Company Financials
- 12.1.9.4. SWOT Analysis
- 12.1.10 Geospectrum Technologies Inc
- 12.1.10.1. Company Overview
- 12.1.10.2. Products
- 12.1.10.3. Company Financials
- 12.1.10.4. SWOT Analysis
- 12.1.1 Teledyne Marine Technologies (Teledyne Technologies Incorporated)
- 12.2. Market Entropy
- 12.2.1 Company's Key Areas Served
- 12.2.2 Recent Developments
- 12.3. Company Market Share Analysis 2025
- 12.3.1 Top 5 Companies Market Share Analysis
- 12.3.2 Top 3 Companies Market Share Analysis
- 12.4. List of Potential Customers
- 13. Research Methodology
List of Figures
- Figure 1: Global Marine Acoustic Sensors Market Revenue Breakdown (Million, %) by Region 2025 & 2033
- Figure 2: Global Marine Acoustic Sensors Market Volume Breakdown (K Unit, %) by Region 2025 & 2033
- Figure 3: North America Marine Acoustic Sensors Market Revenue (Million), by Product 2025 & 2033
- Figure 4: North America Marine Acoustic Sensors Market Volume (K Unit), by Product 2025 & 2033
- Figure 5: North America Marine Acoustic Sensors Market Revenue Share (%), by Product 2025 & 2033
- Figure 6: North America Marine Acoustic Sensors Market Volume Share (%), by Product 2025 & 2033
- Figure 7: North America Marine Acoustic Sensors Market Revenue (Million), by Application 2025 & 2033
- Figure 8: North America Marine Acoustic Sensors Market Volume (K Unit), by Application 2025 & 2033
- Figure 9: North America Marine Acoustic Sensors Market Revenue Share (%), by Application 2025 & 2033
- Figure 10: North America Marine Acoustic Sensors Market Volume Share (%), by Application 2025 & 2033
- Figure 11: North America Marine Acoustic Sensors Market Revenue (Million), by Geography 2025 & 2033
- Figure 12: North America Marine Acoustic Sensors Market Volume (K Unit), by Geography 2025 & 2033
- Figure 13: North America Marine Acoustic Sensors Market Revenue Share (%), by Geography 2025 & 2033
- Figure 14: North America Marine Acoustic Sensors Market Volume Share (%), by Geography 2025 & 2033
- Figure 15: North America Marine Acoustic Sensors Market Revenue (Million), by Country 2025 & 2033
- Figure 16: North America Marine Acoustic Sensors Market Volume (K Unit), by Country 2025 & 2033
- Figure 17: North America Marine Acoustic Sensors Market Revenue Share (%), by Country 2025 & 2033
- Figure 18: North America Marine Acoustic Sensors Market Volume Share (%), by Country 2025 & 2033
- Figure 19: Europe Marine Acoustic Sensors Market Revenue (Million), by Product 2025 & 2033
- Figure 20: Europe Marine Acoustic Sensors Market Volume (K Unit), by Product 2025 & 2033
- Figure 21: Europe Marine Acoustic Sensors Market Revenue Share (%), by Product 2025 & 2033
- Figure 22: Europe Marine Acoustic Sensors Market Volume Share (%), by Product 2025 & 2033
- Figure 23: Europe Marine Acoustic Sensors Market Revenue (Million), by Application 2025 & 2033
- Figure 24: Europe Marine Acoustic Sensors Market Volume (K Unit), by Application 2025 & 2033
- Figure 25: Europe Marine Acoustic Sensors Market Revenue Share (%), by Application 2025 & 2033
- Figure 26: Europe Marine Acoustic Sensors Market Volume Share (%), by Application 2025 & 2033
- Figure 27: Europe Marine Acoustic Sensors Market Revenue (Million), by Geography 2025 & 2033
- Figure 28: Europe Marine Acoustic Sensors Market Volume (K Unit), by Geography 2025 & 2033
- Figure 29: Europe Marine Acoustic Sensors Market Revenue Share (%), by Geography 2025 & 2033
- Figure 30: Europe Marine Acoustic Sensors Market Volume Share (%), by Geography 2025 & 2033
- Figure 31: Europe Marine Acoustic Sensors Market Revenue (Million), by Country 2025 & 2033
- Figure 32: Europe Marine Acoustic Sensors Market Volume (K Unit), by Country 2025 & 2033
- Figure 33: Europe Marine Acoustic Sensors Market Revenue Share (%), by Country 2025 & 2033
- Figure 34: Europe Marine Acoustic Sensors Market Volume Share (%), by Country 2025 & 2033
- Figure 35: Asia Marine Acoustic Sensors Market Revenue (Million), by Product 2025 & 2033
- Figure 36: Asia Marine Acoustic Sensors Market Volume (K Unit), by Product 2025 & 2033
- Figure 37: Asia Marine Acoustic Sensors Market Revenue Share (%), by Product 2025 & 2033
- Figure 38: Asia Marine Acoustic Sensors Market Volume Share (%), by Product 2025 & 2033
- Figure 39: Asia Marine Acoustic Sensors Market Revenue (Million), by Application 2025 & 2033
- Figure 40: Asia Marine Acoustic Sensors Market Volume (K Unit), by Application 2025 & 2033
- Figure 41: Asia Marine Acoustic Sensors Market Revenue Share (%), by Application 2025 & 2033
- Figure 42: Asia Marine Acoustic Sensors Market Volume Share (%), by Application 2025 & 2033
- Figure 43: Asia Marine Acoustic Sensors Market Revenue (Million), by Geography 2025 & 2033
- Figure 44: Asia Marine Acoustic Sensors Market Volume (K Unit), by Geography 2025 & 2033
- Figure 45: Asia Marine Acoustic Sensors Market Revenue Share (%), by Geography 2025 & 2033
- Figure 46: Asia Marine Acoustic Sensors Market Volume Share (%), by Geography 2025 & 2033
- Figure 47: Asia Marine Acoustic Sensors Market Revenue (Million), by Country 2025 & 2033
- Figure 48: Asia Marine Acoustic Sensors Market Volume (K Unit), by Country 2025 & 2033
- Figure 49: Asia Marine Acoustic Sensors Market Revenue Share (%), by Country 2025 & 2033
- Figure 50: Asia Marine Acoustic Sensors Market Volume Share (%), by Country 2025 & 2033
- Figure 51: Australia and New Zealand Marine Acoustic Sensors Market Revenue (Million), by Product 2025 & 2033
- Figure 52: Australia and New Zealand Marine Acoustic Sensors Market Volume (K Unit), by Product 2025 & 2033
- Figure 53: Australia and New Zealand Marine Acoustic Sensors Market Revenue Share (%), by Product 2025 & 2033
- Figure 54: Australia and New Zealand Marine Acoustic Sensors Market Volume Share (%), by Product 2025 & 2033
- Figure 55: Australia and New Zealand Marine Acoustic Sensors Market Revenue (Million), by Application 2025 & 2033
- Figure 56: Australia and New Zealand Marine Acoustic Sensors Market Volume (K Unit), by Application 2025 & 2033
- Figure 57: Australia and New Zealand Marine Acoustic Sensors Market Revenue Share (%), by Application 2025 & 2033
- Figure 58: Australia and New Zealand Marine Acoustic Sensors Market Volume Share (%), by Application 2025 & 2033
- Figure 59: Australia and New Zealand Marine Acoustic Sensors Market Revenue (Million), by Geography 2025 & 2033
- Figure 60: Australia and New Zealand Marine Acoustic Sensors Market Volume (K Unit), by Geography 2025 & 2033
- Figure 61: Australia and New Zealand Marine Acoustic Sensors Market Revenue Share (%), by Geography 2025 & 2033
- Figure 62: Australia and New Zealand Marine Acoustic Sensors Market Volume Share (%), by Geography 2025 & 2033
- Figure 63: Australia and New Zealand Marine Acoustic Sensors Market Revenue (Million), by Country 2025 & 2033
- Figure 64: Australia and New Zealand Marine Acoustic Sensors Market Volume (K Unit), by Country 2025 & 2033
- Figure 65: Australia and New Zealand Marine Acoustic Sensors Market Revenue Share (%), by Country 2025 & 2033
- Figure 66: Australia and New Zealand Marine Acoustic Sensors Market Volume Share (%), by Country 2025 & 2033
- Figure 67: Latin America Marine Acoustic Sensors Market Revenue (Million), by Product 2025 & 2033
- Figure 68: Latin America Marine Acoustic Sensors Market Volume (K Unit), by Product 2025 & 2033
- Figure 69: Latin America Marine Acoustic Sensors Market Revenue Share (%), by Product 2025 & 2033
- Figure 70: Latin America Marine Acoustic Sensors Market Volume Share (%), by Product 2025 & 2033
- Figure 71: Latin America Marine Acoustic Sensors Market Revenue (Million), by Application 2025 & 2033
- Figure 72: Latin America Marine Acoustic Sensors Market Volume (K Unit), by Application 2025 & 2033
- Figure 73: Latin America Marine Acoustic Sensors Market Revenue Share (%), by Application 2025 & 2033
- Figure 74: Latin America Marine Acoustic Sensors Market Volume Share (%), by Application 2025 & 2033
- Figure 75: Latin America Marine Acoustic Sensors Market Revenue (Million), by Geography 2025 & 2033
- Figure 76: Latin America Marine Acoustic Sensors Market Volume (K Unit), by Geography 2025 & 2033
- Figure 77: Latin America Marine Acoustic Sensors Market Revenue Share (%), by Geography 2025 & 2033
- Figure 78: Latin America Marine Acoustic Sensors Market Volume Share (%), by Geography 2025 & 2033
- Figure 79: Latin America Marine Acoustic Sensors Market Revenue (Million), by Country 2025 & 2033
- Figure 80: Latin America Marine Acoustic Sensors Market Volume (K Unit), by Country 2025 & 2033
- Figure 81: Latin America Marine Acoustic Sensors Market Revenue Share (%), by Country 2025 & 2033
- Figure 82: Latin America Marine Acoustic Sensors Market Volume Share (%), by Country 2025 & 2033
List of Tables
- Table 1: Global Marine Acoustic Sensors Market Revenue Million Forecast, by Product 2020 & 2033
- Table 2: Global Marine Acoustic Sensors Market Volume K Unit Forecast, by Product 2020 & 2033
- Table 3: Global Marine Acoustic Sensors Market Revenue Million Forecast, by Application 2020 & 2033
- Table 4: Global Marine Acoustic Sensors Market Volume K Unit Forecast, by Application 2020 & 2033
- Table 5: Global Marine Acoustic Sensors Market Revenue Million Forecast, by Geography 2020 & 2033
- Table 6: Global Marine Acoustic Sensors Market Volume K Unit Forecast, by Geography 2020 & 2033
- Table 7: Global Marine Acoustic Sensors Market Revenue Million Forecast, by Region 2020 & 2033
- Table 8: Global Marine Acoustic Sensors Market Volume K Unit Forecast, by Region 2020 & 2033
- Table 9: Global Marine Acoustic Sensors Market Revenue Million Forecast, by Product 2020 & 2033
- Table 10: Global Marine Acoustic Sensors Market Volume K Unit Forecast, by Product 2020 & 2033
- Table 11: Global Marine Acoustic Sensors Market Revenue Million Forecast, by Application 2020 & 2033
- Table 12: Global Marine Acoustic Sensors Market Volume K Unit Forecast, by Application 2020 & 2033
- Table 13: Global Marine Acoustic Sensors Market Revenue Million Forecast, by Geography 2020 & 2033
- Table 14: Global Marine Acoustic Sensors Market Volume K Unit Forecast, by Geography 2020 & 2033
- Table 15: Global Marine Acoustic Sensors Market Revenue Million Forecast, by Country 2020 & 2033
- Table 16: Global Marine Acoustic Sensors Market Volume K Unit Forecast, by Country 2020 & 2033
- Table 17: Global Marine Acoustic Sensors Market Revenue Million Forecast, by Product 2020 & 2033
- Table 18: Global Marine Acoustic Sensors Market Volume K Unit Forecast, by Product 2020 & 2033
- Table 19: Global Marine Acoustic Sensors Market Revenue Million Forecast, by Application 2020 & 2033
- Table 20: Global Marine Acoustic Sensors Market Volume K Unit Forecast, by Application 2020 & 2033
- Table 21: Global Marine Acoustic Sensors Market Revenue Million Forecast, by Geography 2020 & 2033
- Table 22: Global Marine Acoustic Sensors Market Volume K Unit Forecast, by Geography 2020 & 2033
- Table 23: Global Marine Acoustic Sensors Market Revenue Million Forecast, by Country 2020 & 2033
- Table 24: Global Marine Acoustic Sensors Market Volume K Unit Forecast, by Country 2020 & 2033
- Table 25: Global Marine Acoustic Sensors Market Revenue Million Forecast, by Product 2020 & 2033
- Table 26: Global Marine Acoustic Sensors Market Volume K Unit Forecast, by Product 2020 & 2033
- Table 27: Global Marine Acoustic Sensors Market Revenue Million Forecast, by Application 2020 & 2033
- Table 28: Global Marine Acoustic Sensors Market Volume K Unit Forecast, by Application 2020 & 2033
- Table 29: Global Marine Acoustic Sensors Market Revenue Million Forecast, by Geography 2020 & 2033
- Table 30: Global Marine Acoustic Sensors Market Volume K Unit Forecast, by Geography 2020 & 2033
- Table 31: Global Marine Acoustic Sensors Market Revenue Million Forecast, by Country 2020 & 2033
- Table 32: Global Marine Acoustic Sensors Market Volume K Unit Forecast, by Country 2020 & 2033
- Table 33: Global Marine Acoustic Sensors Market Revenue Million Forecast, by Product 2020 & 2033
- Table 34: Global Marine Acoustic Sensors Market Volume K Unit Forecast, by Product 2020 & 2033
- Table 35: Global Marine Acoustic Sensors Market Revenue Million Forecast, by Application 2020 & 2033
- Table 36: Global Marine Acoustic Sensors Market Volume K Unit Forecast, by Application 2020 & 2033
- Table 37: Global Marine Acoustic Sensors Market Revenue Million Forecast, by Geography 2020 & 2033
- Table 38: Global Marine Acoustic Sensors Market Volume K Unit Forecast, by Geography 2020 & 2033
- Table 39: Global Marine Acoustic Sensors Market Revenue Million Forecast, by Country 2020 & 2033
- Table 40: Global Marine Acoustic Sensors Market Volume K Unit Forecast, by Country 2020 & 2033
- Table 41: Global Marine Acoustic Sensors Market Revenue Million Forecast, by Product 2020 & 2033
- Table 42: Global Marine Acoustic Sensors Market Volume K Unit Forecast, by Product 2020 & 2033
- Table 43: Global Marine Acoustic Sensors Market Revenue Million Forecast, by Application 2020 & 2033
- Table 44: Global Marine Acoustic Sensors Market Volume K Unit Forecast, by Application 2020 & 2033
- Table 45: Global Marine Acoustic Sensors Market Revenue Million Forecast, by Geography 2020 & 2033
- Table 46: Global Marine Acoustic Sensors Market Volume K Unit Forecast, by Geography 2020 & 2033
- Table 47: Global Marine Acoustic Sensors Market Revenue Million Forecast, by Country 2020 & 2033
- Table 48: Global Marine Acoustic Sensors Market Volume K Unit Forecast, by Country 2020 & 2033
Frequently Asked Questions
1. What is the projected Compound Annual Growth Rate (CAGR) of the Marine Acoustic Sensors Market?
The projected CAGR is approximately 6.41%.
2. Which companies are prominent players in the Marine Acoustic Sensors Market?
Key companies in the market include Teledyne Marine Technologies (Teledyne Technologies Incorporated), Hottinger Brüel & Kjær (Spectris PLC), Garmin Ltd, Thales Group, BAE Systems PLC, L3harris Technologies Inc, Cobham Ultra Seniorco S à R l, CTS Corporatio, Ocean Sonics Ltd, Geospectrum Technologies Inc.
3. What are the main segments of the Marine Acoustic Sensors Market?
The market segments include Product, Application, Geography.
4. Can you provide details about the market size?
The market size is estimated to be USD 1.46 Million as of 2022.
5. What are some drivers contributing to market growth?
Growing Deployment of Acoustic Navigation for Underwater Positioning; Rising Defense Spending in Several Countries.
6. What are the notable trends driving market growth?
Underwater Transducer to Hold Major Share in the Product Segment.
7. Are there any restraints impacting market growth?
High Initial Setup and Installation Cost; Limited Product variety and Capacity.
8. Can you provide examples of recent developments in the market?
June 2023 - RPS presented Neptune, the predictive algorithm for accurately and reliably detecting marine mammal vocalizations. The sub-sea sound emitted during the in-field development of offshore wind and oil and gas exploration efforts can potentially negatively impact marine mammals, causing temporary and permanent hearing loss, disrupted feeding and breeding cycles, and even physical injury.
9. What pricing options are available for accessing the report?
Pricing options include single-user, multi-user, and enterprise licenses priced at USD 4750, USD 5250, and USD 8750 respectively.
10. Is the market size provided in terms of value or volume?
The market size is provided in terms of value, measured in Million and volume, measured in K Unit.
11. Are there any specific market keywords associated with the report?
Yes, the market keyword associated with the report is "Marine Acoustic Sensors Market," which aids in identifying and referencing the specific market segment covered.
12. How do I determine which pricing option suits my needs best?
The pricing options vary based on user requirements and access needs. Individual users may opt for single-user licenses, while businesses requiring broader access may choose multi-user or enterprise licenses for cost-effective access to the report.
13. Are there any additional resources or data provided in the Marine Acoustic Sensors Market report?
While the report offers comprehensive insights, it's advisable to review the specific contents or supplementary materials provided to ascertain if additional resources or data are available.
14. How can I stay updated on further developments or reports in the Marine Acoustic Sensors Market?
To stay informed about further developments, trends, and reports in the Marine Acoustic Sensors Market, consider subscribing to industry newsletters, following relevant companies and organizations, or regularly checking reputable industry news sources and publications.
Methodology
Step 1 - Identification of Relevant Samples Size from Population Database


Step 2 - Approaches for Defining Global Market Size (Value, Volume* & Price*)

Note*: In applicable scenarios
Step 3 - Data Sources
Primary Research
- Web Analytics
- Survey Reports
- Research Institute
- Latest Research Reports
- Opinion Leaders
Secondary Research
- Annual Reports
- White Paper
- Latest Press Release
- Industry Association
- Paid Database
- Investor Presentations

Step 4 - Data Triangulation
Involves using different sources of information in order to increase the validity of a study
These sources are likely to be stakeholders in a program - participants, other researchers, program staff, other community members, and so on.
Then we put all data in single framework & apply various statistical tools to find out the dynamic on the market.
During the analysis stage, feedback from the stakeholder groups would be compared to determine areas of agreement as well as areas of divergence