
Key Insights
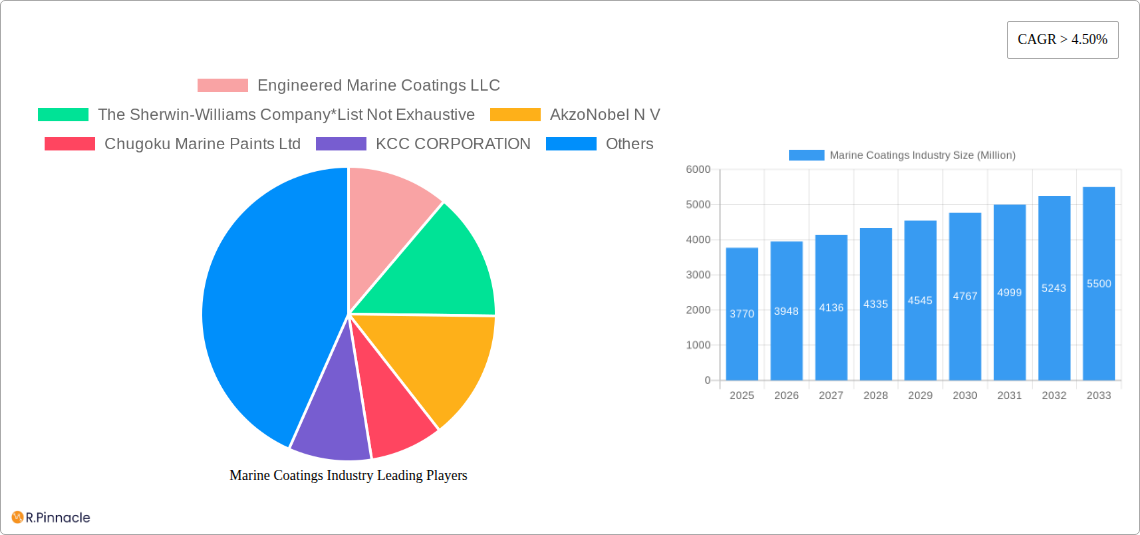
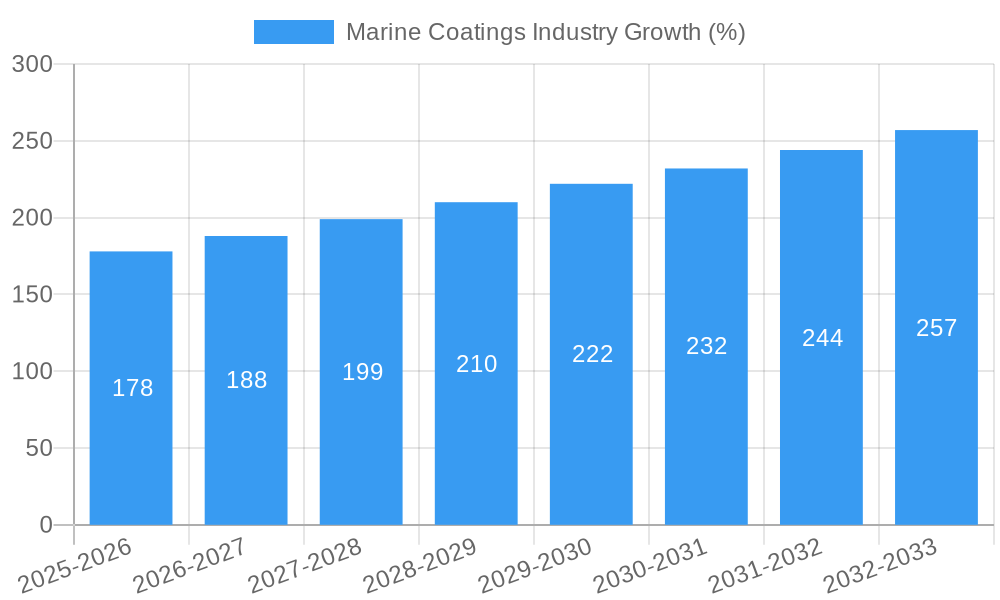
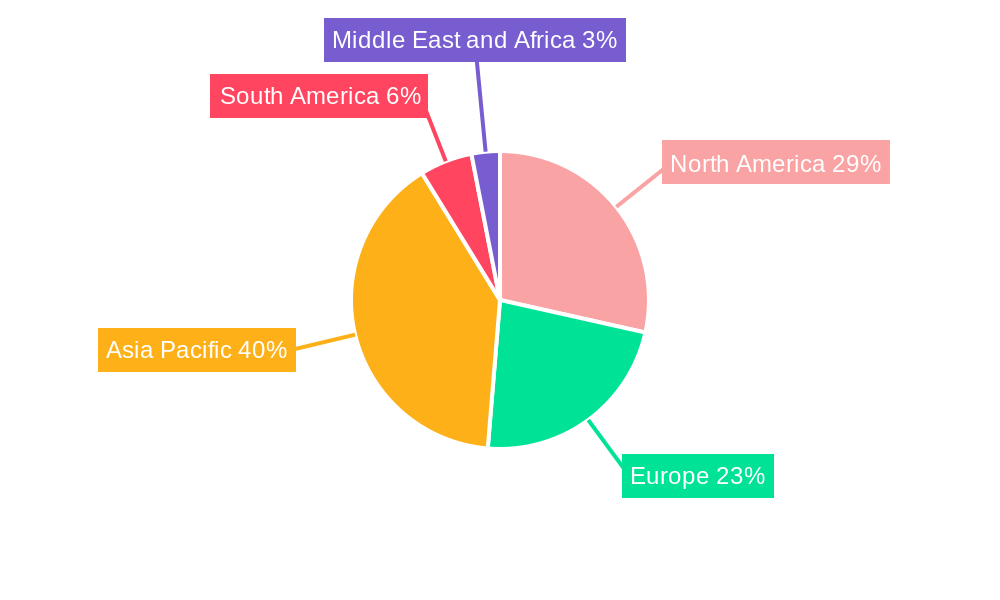
The global marine coatings market, valued at $3.77 billion in 2025, is projected to experience robust growth, exhibiting a Compound Annual Growth Rate (CAGR) exceeding 4.50% from 2025 to 2033. This expansion is driven by several key factors. The increasing demand for new vessels, particularly in the burgeoning maritime transport sector, fuels significant demand for initial coatings. Furthermore, stringent environmental regulations regarding marine biofouling and stricter emission standards are pushing the adoption of eco-friendly, high-performance marine coatings, like water-borne and UV-cured options. Growth in offshore oil and gas exploration and the renewable energy sector (offshore wind farms) also contributes to market expansion, demanding durable and corrosion-resistant coatings for these specialized applications. The market is segmented by application (Marine OEM, Marine Aftermarket), type (anti-corrosion, anti-fouling, foul release, moisture cure), resin (epoxy, polyurethane, acrylic, alkyd, polyester, fluoropolymer), and technology (water-borne, solvent-borne, UV-cured, powder coatings). Major players like AkzoNobel, Jotun, Sherwin-Williams, and Nippon Paint dominate the market, leveraging their extensive product portfolios and global distribution networks. Regional variations exist, with Asia Pacific expected to lead due to significant shipbuilding activities and growing maritime trade within the region.
The market's growth trajectory is influenced by several trends. Technological advancements leading to the development of innovative coating formulations with enhanced durability, performance, and environmental friendliness are shaping market dynamics. The rising adoption of digital technologies in the marine coatings industry for improved efficiency and quality control also contributes to market growth. However, fluctuating raw material prices and economic uncertainties in key shipbuilding regions present potential restraints. The increasing focus on sustainable practices and circular economy principles is expected to drive innovation in biodegradable and recyclable marine coatings, further shaping the future of the industry. The competitive landscape is characterized by intense competition, with companies focusing on product innovation, mergers and acquisitions, and strategic partnerships to maintain a strong market position. This dynamic environment ensures continuous market evolution and the delivery of increasingly sophisticated and environmentally sound marine coating solutions.
Marine Coatings Industry Market Report: 2019-2033
This comprehensive report provides an in-depth analysis of the global marine coatings industry, projecting a market value of $XX Billion by 2033. Leveraging data from the historical period (2019-2024), base year (2025), and forecast period (2025-2033), this report offers actionable insights for industry professionals, investors, and stakeholders. Key players like The Sherwin-Williams Company, AkzoNobel N V, and Jotun are profiled, alongside an analysis of market segments, technological advancements, and emerging trends.
Marine Coatings Industry Market Structure & Innovation Trends
The marine coatings market is moderately concentrated, with several major players holding significant market share. The top 5 companies account for approximately xx% of the global market in 2025. Innovation is driven by stringent environmental regulations, demand for enhanced performance (corrosion resistance, antifouling properties), and the need for fuel efficiency.
- Market Share (2025 Estimate): Jotun (xx%), AkzoNobel (xx%), Sherwin-Williams (xx%), PPG Industries (xx%), Nippon Paint (xx%). (Remaining xx% distributed across other players).
- M&A Activity: The industry has witnessed significant consolidation in recent years, with deal values exceeding $XX Billion during the historical period. Strategic acquisitions are focused on expanding product portfolios, geographical reach, and technological capabilities. Examples include (specific examples with deal values if available, otherwise indicate "Deal values unavailable for specific examples").
- Regulatory Frameworks: IMO regulations regarding ballast water management and greenhouse gas emissions significantly influence the demand for eco-friendly coatings.
- Product Substitutes: Alternative materials and technologies (e.g., self-cleaning hull surfaces) pose a potential threat, although the existing dominance of coatings remains strong.
- End-User Demographics: The primary end-users are shipbuilders (OEM), shipping companies, and marine repair yards (Aftermarket).
Marine Coatings Industry Market Dynamics & Trends
The global marine coatings market is projected to register a CAGR of xx% during the forecast period (2025-2033). Growth is fueled by increasing global shipping activity, growing awareness of the importance of hull maintenance, and stricter environmental regulations that incentivize the adoption of low-VOC, high-performance coatings.
Technological disruptions, primarily in the form of innovative resin systems (e.g., self-polishing copolymers) and application technologies (e.g., robotic painting), are driving efficiency improvements and reducing environmental impact. Consumer preferences are increasingly shifting towards eco-friendly, durable, and high-performance coatings. Competitive dynamics are characterized by intense competition among major players, with a focus on R&D, product differentiation, and strategic partnerships. Market penetration of water-borne coatings continues to rise driven by environmental concerns and regulatory pressures.
Dominant Regions & Segments in Marine Coatings Industry
- Leading Region: Asia-Pacific dominates the global marine coatings market due to its robust shipbuilding and shipping industries, and rapid economic growth. Growth is particularly strong in China and other Southeast Asian nations.
- Dominant Application Segment: The Marine OEM segment holds a larger market share compared to the Aftermarket segment.
- Leading Type Segment: Anti-corrosive coatings are the dominant type, reflecting their crucial role in protecting marine assets from corrosion. However, antifouling coatings are experiencing rapid growth due to increasing environmental concerns and fuel-efficiency requirements.
- Key Drivers (Asia-Pacific):
- Rapid growth in shipbuilding and shipping activities.
- Increasing investment in port infrastructure.
- Favorable government policies and incentives supporting maritime industries.
- Detailed Dominance Analysis: (Paragraph explaining the reasons for dominance in each segment - economic drivers, technological advancements, infrastructure growth, etc.).
Marine Coatings Industry Product Innovations
Recent innovations focus on developing eco-friendly, high-performance coatings that minimize environmental impact while enhancing vessel performance. This includes advancements in foul-release coatings, water-borne technologies, and the integration of nanomaterials for improved durability and corrosion resistance. The market sees a significant push towards coatings that reduce fuel consumption and improve overall efficiency, aligning with global efforts to reduce carbon emissions within the shipping industry.
Report Scope & Segmentation Analysis
This report segments the market by Application (Marine OEM, Marine Aftermarket), Type (Anti-corrosion, Antifouling, Other Types), Resin (Epoxy, Polyurethane, Acrylic, Alkyd, Other Resins), and Technology (Water-borne, Solvent-borne, UV-cured, Powder Coatings). Each segment's growth projections, market size, and competitive dynamics are analyzed, providing a comprehensive overview of the industry landscape. (Include specific growth projections and market sizes for each segment if available, otherwise indicate "Market size unavailable/predicted to be $XX Billion").
Key Drivers of Marine Coatings Industry Growth
Growth in the marine coatings industry is primarily driven by the increasing global demand for shipping and shipbuilding, stringent environmental regulations promoting sustainable coatings, and the need for enhanced vessel protection and efficiency. Technological advancements, particularly in resin chemistry and application methods, further fuel market growth. The rising adoption of water-borne coatings is also a significant growth driver.
Challenges in the Marine Coatings Industry Sector
The marine coatings industry faces challenges including fluctuating raw material prices, stringent environmental regulations, and intense competition. Supply chain disruptions can impact production and costs. Meeting the evolving requirements of various regulatory bodies (e.g., IMO) presents additional hurdles. The development of long-lasting, highly durable, and eco-friendly coatings represents a crucial ongoing challenge for industry leaders.
Emerging Opportunities in Marine Coatings Industry
Emerging opportunities include the growing demand for sustainable and eco-friendly coatings, the development of innovative technologies such as self-cleaning and foul-release coatings, and expansion into new geographic markets, especially in developing economies. The growing focus on fuel efficiency is creating substantial opportunities for coatings that reduce power consumption and drag.
Leading Players in the Marine Coatings Industry Market
- Engineered Marine Coatings LLC
- The Sherwin-Williams Company
- AkzoNobel N V
- Chugoku Marine Paints Ltd
- KCC CORPORATION
- Jotun
- RPM International Inc
- Kansai Paint Marine Co Ltd
- Pettit Marine Paints
- PPG Industries Inc
- BOERO BARTOLOMEO S p A
- Nippon Paint Marine Coatings Co Ltd
- BASF SE
- Axalta Coating Systems
- Hempel A/S
- MCU COATING INTERNATIONAL
Key Developments in Marine Coatings Industry
- March 2023: PPG launched the PPG SIGMAGLIDE 2390 marine coating, designed to reduce power consumption and carbon emissions while meeting demands for higher performance. This launch demonstrates a significant shift toward eco-friendly, high-performance coatings.
- March 2023: Hempel joined the IMO's Global Industry Alliance for Marine Biosafety, highlighting the industry's growing commitment to environmental sustainability and collaboration on emission reduction strategies.
Future Outlook for Marine Coatings Industry Market
The marine coatings market is poised for continued growth driven by the long-term trends in global shipping, stricter environmental regulations, and technological innovations. Strategic partnerships, R&D investments in sustainable solutions, and expansion into new markets will be crucial for companies seeking to capitalize on future opportunities. The market's future growth trajectory is positive, with opportunities for innovation and expansion remaining strong throughout the forecast period.
Marine Coatings Industry Segmentation
-
1. Type
- 1.1. Anti-corrosion
- 1.2. Antifouling
- 1.3. Other Types (Foul Release, Moisture Cure, etc.)
-
2. Resin
- 2.1. Epoxy
- 2.2. Polyurethane
- 2.3. Acrylic
- 2.4. Alkyd
- 2.5. Other Resins (Polyester, Fluoropolymer, etc.)
-
3. Technology
- 3.1. Water-borne
- 3.2. Solvent-borne
- 3.3. UV-cured
- 3.4. Powder Coatings
-
4. Application
- 4.1. Marine OEM
- 4.2. Marine Aftermarket
Marine Coatings Industry Segmentation By Geography
-
1. Asia Pacific
- 1.1. China
- 1.2. India
- 1.3. Japan
- 1.4. South Korea
- 1.5. Malaysia
- 1.6. Vietnam
- 1.7. Rest of Asia Pacific
-
2. North America
- 2.1. United States
- 2.2. Canada
- 2.3. Mexico
-
3. Europe
- 3.1. Germany
- 3.2. United Kingdom
- 3.3. Italy
- 3.4. France
- 3.5. Rest of Europe
-
4. South America
- 4.1. Brazil
- 4.2. Argentina
- 4.3. Rest of South America
-
5. Middle East and Africa
- 5.1. Saudi Arabia
- 5.2. South Africa
- 5.3. Rest of Middle East and Africa
Marine Coatings Industry REPORT HIGHLIGHTS
| Aspects | Details |
|---|---|
| Study Period | 2019-2033 |
| Base Year | 2024 |
| Estimated Year | 2025 |
| Forecast Period | 2025-2033 |
| Historical Period | 2019-2024 |
| Growth Rate | CAGR of > 4.50% from 2019-2033 |
| Segmentation |
|
Table of Contents
- 1. Introduction
- 1.1. Research Scope
- 1.2. Market Segmentation
- 1.3. Research Methodology
- 1.4. Definitions and Assumptions
- 2. Executive Summary
- 2.1. Introduction
- 3. Market Dynamics
- 3.1. Introduction
- 3.2. Market Drivers
- 3.2.1. Increase in Production of Leisure Boats and Cruise Ships; Growing Ship Repairs and Maintenance Activities
- 3.3. Market Restrains
- 3.3.1. Stringent Government Regulations; Sluggish Growth in Shipbuilding Activities in Few Countries
- 3.4. Market Trends
- 3.4.1. Marine OEM Application Segment to Dominate The Market
- 4. Market Factor Analysis
- 4.1. Porters Five Forces
- 4.2. Supply/Value Chain
- 4.3. PESTEL analysis
- 4.4. Market Entropy
- 4.5. Patent/Trademark Analysis
- 5. Global Marine Coatings Industry Analysis, Insights and Forecast, 2019-2031
- 5.1. Market Analysis, Insights and Forecast - by Type
- 5.1.1. Anti-corrosion
- 5.1.2. Antifouling
- 5.1.3. Other Types (Foul Release, Moisture Cure, etc.)
- 5.2. Market Analysis, Insights and Forecast - by Resin
- 5.2.1. Epoxy
- 5.2.2. Polyurethane
- 5.2.3. Acrylic
- 5.2.4. Alkyd
- 5.2.5. Other Resins (Polyester, Fluoropolymer, etc.)
- 5.3. Market Analysis, Insights and Forecast - by Technology
- 5.3.1. Water-borne
- 5.3.2. Solvent-borne
- 5.3.3. UV-cured
- 5.3.4. Powder Coatings
- 5.4. Market Analysis, Insights and Forecast - by Application
- 5.4.1. Marine OEM
- 5.4.2. Marine Aftermarket
- 5.5. Market Analysis, Insights and Forecast - by Region
- 5.5.1. Asia Pacific
- 5.5.2. North America
- 5.5.3. Europe
- 5.5.4. South America
- 5.5.5. Middle East and Africa
- 5.1. Market Analysis, Insights and Forecast - by Type
- 6. Asia Pacific Marine Coatings Industry Analysis, Insights and Forecast, 2019-2031
- 6.1. Market Analysis, Insights and Forecast - by Type
- 6.1.1. Anti-corrosion
- 6.1.2. Antifouling
- 6.1.3. Other Types (Foul Release, Moisture Cure, etc.)
- 6.2. Market Analysis, Insights and Forecast - by Resin
- 6.2.1. Epoxy
- 6.2.2. Polyurethane
- 6.2.3. Acrylic
- 6.2.4. Alkyd
- 6.2.5. Other Resins (Polyester, Fluoropolymer, etc.)
- 6.3. Market Analysis, Insights and Forecast - by Technology
- 6.3.1. Water-borne
- 6.3.2. Solvent-borne
- 6.3.3. UV-cured
- 6.3.4. Powder Coatings
- 6.4. Market Analysis, Insights and Forecast - by Application
- 6.4.1. Marine OEM
- 6.4.2. Marine Aftermarket
- 6.1. Market Analysis, Insights and Forecast - by Type
- 7. North America Marine Coatings Industry Analysis, Insights and Forecast, 2019-2031
- 7.1. Market Analysis, Insights and Forecast - by Type
- 7.1.1. Anti-corrosion
- 7.1.2. Antifouling
- 7.1.3. Other Types (Foul Release, Moisture Cure, etc.)
- 7.2. Market Analysis, Insights and Forecast - by Resin
- 7.2.1. Epoxy
- 7.2.2. Polyurethane
- 7.2.3. Acrylic
- 7.2.4. Alkyd
- 7.2.5. Other Resins (Polyester, Fluoropolymer, etc.)
- 7.3. Market Analysis, Insights and Forecast - by Technology
- 7.3.1. Water-borne
- 7.3.2. Solvent-borne
- 7.3.3. UV-cured
- 7.3.4. Powder Coatings
- 7.4. Market Analysis, Insights and Forecast - by Application
- 7.4.1. Marine OEM
- 7.4.2. Marine Aftermarket
- 7.1. Market Analysis, Insights and Forecast - by Type
- 8. Europe Marine Coatings Industry Analysis, Insights and Forecast, 2019-2031
- 8.1. Market Analysis, Insights and Forecast - by Type
- 8.1.1. Anti-corrosion
- 8.1.2. Antifouling
- 8.1.3. Other Types (Foul Release, Moisture Cure, etc.)
- 8.2. Market Analysis, Insights and Forecast - by Resin
- 8.2.1. Epoxy
- 8.2.2. Polyurethane
- 8.2.3. Acrylic
- 8.2.4. Alkyd
- 8.2.5. Other Resins (Polyester, Fluoropolymer, etc.)
- 8.3. Market Analysis, Insights and Forecast - by Technology
- 8.3.1. Water-borne
- 8.3.2. Solvent-borne
- 8.3.3. UV-cured
- 8.3.4. Powder Coatings
- 8.4. Market Analysis, Insights and Forecast - by Application
- 8.4.1. Marine OEM
- 8.4.2. Marine Aftermarket
- 8.1. Market Analysis, Insights and Forecast - by Type
- 9. South America Marine Coatings Industry Analysis, Insights and Forecast, 2019-2031
- 9.1. Market Analysis, Insights and Forecast - by Type
- 9.1.1. Anti-corrosion
- 9.1.2. Antifouling
- 9.1.3. Other Types (Foul Release, Moisture Cure, etc.)
- 9.2. Market Analysis, Insights and Forecast - by Resin
- 9.2.1. Epoxy
- 9.2.2. Polyurethane
- 9.2.3. Acrylic
- 9.2.4. Alkyd
- 9.2.5. Other Resins (Polyester, Fluoropolymer, etc.)
- 9.3. Market Analysis, Insights and Forecast - by Technology
- 9.3.1. Water-borne
- 9.3.2. Solvent-borne
- 9.3.3. UV-cured
- 9.3.4. Powder Coatings
- 9.4. Market Analysis, Insights and Forecast - by Application
- 9.4.1. Marine OEM
- 9.4.2. Marine Aftermarket
- 9.1. Market Analysis, Insights and Forecast - by Type
- 10. Middle East and Africa Marine Coatings Industry Analysis, Insights and Forecast, 2019-2031
- 10.1. Market Analysis, Insights and Forecast - by Type
- 10.1.1. Anti-corrosion
- 10.1.2. Antifouling
- 10.1.3. Other Types (Foul Release, Moisture Cure, etc.)
- 10.2. Market Analysis, Insights and Forecast - by Resin
- 10.2.1. Epoxy
- 10.2.2. Polyurethane
- 10.2.3. Acrylic
- 10.2.4. Alkyd
- 10.2.5. Other Resins (Polyester, Fluoropolymer, etc.)
- 10.3. Market Analysis, Insights and Forecast - by Technology
- 10.3.1. Water-borne
- 10.3.2. Solvent-borne
- 10.3.3. UV-cured
- 10.3.4. Powder Coatings
- 10.4. Market Analysis, Insights and Forecast - by Application
- 10.4.1. Marine OEM
- 10.4.2. Marine Aftermarket
- 10.1. Market Analysis, Insights and Forecast - by Type
- 11. Asia Pacific Marine Coatings Industry Analysis, Insights and Forecast, 2019-2031
- 11.1. Market Analysis, Insights and Forecast - By Country/Sub-region
- 11.1.1 China
- 11.1.2 India
- 11.1.3 Japan
- 11.1.4 South Korea
- 11.1.5 Malaysia
- 11.1.6 Vietnam
- 11.1.7 Rest of Asia Pacific
- 12. North America Marine Coatings Industry Analysis, Insights and Forecast, 2019-2031
- 12.1. Market Analysis, Insights and Forecast - By Country/Sub-region
- 12.1.1 United States
- 12.1.2 Canada
- 12.1.3 Mexico
- 13. Europe Marine Coatings Industry Analysis, Insights and Forecast, 2019-2031
- 13.1. Market Analysis, Insights and Forecast - By Country/Sub-region
- 13.1.1 Germany
- 13.1.2 United Kingdom
- 13.1.3 Italy
- 13.1.4 France
- 13.1.5 Rest of Europe
- 14. South America Marine Coatings Industry Analysis, Insights and Forecast, 2019-2031
- 14.1. Market Analysis, Insights and Forecast - By Country/Sub-region
- 14.1.1 Brazil
- 14.1.2 Argentina
- 14.1.3 Rest of South America
- 15. Middle East and Africa Marine Coatings Industry Analysis, Insights and Forecast, 2019-2031
- 15.1. Market Analysis, Insights and Forecast - By Country/Sub-region
- 15.1.1 Saudi Arabia
- 15.1.2 South Africa
- 15.1.3 Rest of Middle East and Africa
- 16. Competitive Analysis
- 16.1. Global Market Share Analysis 2024
- 16.2. Company Profiles
- 16.2.1 Engineered Marine Coatings LLC
- 16.2.1.1. Overview
- 16.2.1.2. Products
- 16.2.1.3. SWOT Analysis
- 16.2.1.4. Recent Developments
- 16.2.1.5. Financials (Based on Availability)
- 16.2.2 The Sherwin-Williams Company*List Not Exhaustive
- 16.2.2.1. Overview
- 16.2.2.2. Products
- 16.2.2.3. SWOT Analysis
- 16.2.2.4. Recent Developments
- 16.2.2.5. Financials (Based on Availability)
- 16.2.3 AkzoNobel N V
- 16.2.3.1. Overview
- 16.2.3.2. Products
- 16.2.3.3. SWOT Analysis
- 16.2.3.4. Recent Developments
- 16.2.3.5. Financials (Based on Availability)
- 16.2.4 Chugoku Marine Paints Ltd
- 16.2.4.1. Overview
- 16.2.4.2. Products
- 16.2.4.3. SWOT Analysis
- 16.2.4.4. Recent Developments
- 16.2.4.5. Financials (Based on Availability)
- 16.2.5 KCC CORPORATION
- 16.2.5.1. Overview
- 16.2.5.2. Products
- 16.2.5.3. SWOT Analysis
- 16.2.5.4. Recent Developments
- 16.2.5.5. Financials (Based on Availability)
- 16.2.6 Jotun
- 16.2.6.1. Overview
- 16.2.6.2. Products
- 16.2.6.3. SWOT Analysis
- 16.2.6.4. Recent Developments
- 16.2.6.5. Financials (Based on Availability)
- 16.2.7 RPM International Inc
- 16.2.7.1. Overview
- 16.2.7.2. Products
- 16.2.7.3. SWOT Analysis
- 16.2.7.4. Recent Developments
- 16.2.7.5. Financials (Based on Availability)
- 16.2.8 Kansai Paint Marine Co Ltd
- 16.2.8.1. Overview
- 16.2.8.2. Products
- 16.2.8.3. SWOT Analysis
- 16.2.8.4. Recent Developments
- 16.2.8.5. Financials (Based on Availability)
- 16.2.9 Pettit Marine Paints
- 16.2.9.1. Overview
- 16.2.9.2. Products
- 16.2.9.3. SWOT Analysis
- 16.2.9.4. Recent Developments
- 16.2.9.5. Financials (Based on Availability)
- 16.2.10 PPG Industries Inc
- 16.2.10.1. Overview
- 16.2.10.2. Products
- 16.2.10.3. SWOT Analysis
- 16.2.10.4. Recent Developments
- 16.2.10.5. Financials (Based on Availability)
- 16.2.11 BOERO BARTOLOMEO S p A
- 16.2.11.1. Overview
- 16.2.11.2. Products
- 16.2.11.3. SWOT Analysis
- 16.2.11.4. Recent Developments
- 16.2.11.5. Financials (Based on Availability)
- 16.2.12 Nippon Paint Marine Coatings Co Ltd
- 16.2.12.1. Overview
- 16.2.12.2. Products
- 16.2.12.3. SWOT Analysis
- 16.2.12.4. Recent Developments
- 16.2.12.5. Financials (Based on Availability)
- 16.2.13 BASF SE
- 16.2.13.1. Overview
- 16.2.13.2. Products
- 16.2.13.3. SWOT Analysis
- 16.2.13.4. Recent Developments
- 16.2.13.5. Financials (Based on Availability)
- 16.2.14 Axalta Coating Systems
- 16.2.14.1. Overview
- 16.2.14.2. Products
- 16.2.14.3. SWOT Analysis
- 16.2.14.4. Recent Developments
- 16.2.14.5. Financials (Based on Availability)
- 16.2.15 Hempel A/S
- 16.2.15.1. Overview
- 16.2.15.2. Products
- 16.2.15.3. SWOT Analysis
- 16.2.15.4. Recent Developments
- 16.2.15.5. Financials (Based on Availability)
- 16.2.16 MCU COATING INTERNATIONAL
- 16.2.16.1. Overview
- 16.2.16.2. Products
- 16.2.16.3. SWOT Analysis
- 16.2.16.4. Recent Developments
- 16.2.16.5. Financials (Based on Availability)
- 16.2.1 Engineered Marine Coatings LLC
List of Figures
- Figure 1: Global Marine Coatings Industry Revenue Breakdown (Million, %) by Region 2024 & 2032
- Figure 2: Global Marine Coatings Industry Volume Breakdown (liter , %) by Region 2024 & 2032
- Figure 3: Asia Pacific Marine Coatings Industry Revenue (Million), by Country 2024 & 2032
- Figure 4: Asia Pacific Marine Coatings Industry Volume (liter ), by Country 2024 & 2032
- Figure 5: Asia Pacific Marine Coatings Industry Revenue Share (%), by Country 2024 & 2032
- Figure 6: Asia Pacific Marine Coatings Industry Volume Share (%), by Country 2024 & 2032
- Figure 7: North America Marine Coatings Industry Revenue (Million), by Country 2024 & 2032
- Figure 8: North America Marine Coatings Industry Volume (liter ), by Country 2024 & 2032
- Figure 9: North America Marine Coatings Industry Revenue Share (%), by Country 2024 & 2032
- Figure 10: North America Marine Coatings Industry Volume Share (%), by Country 2024 & 2032
- Figure 11: Europe Marine Coatings Industry Revenue (Million), by Country 2024 & 2032
- Figure 12: Europe Marine Coatings Industry Volume (liter ), by Country 2024 & 2032
- Figure 13: Europe Marine Coatings Industry Revenue Share (%), by Country 2024 & 2032
- Figure 14: Europe Marine Coatings Industry Volume Share (%), by Country 2024 & 2032
- Figure 15: South America Marine Coatings Industry Revenue (Million), by Country 2024 & 2032
- Figure 16: South America Marine Coatings Industry Volume (liter ), by Country 2024 & 2032
- Figure 17: South America Marine Coatings Industry Revenue Share (%), by Country 2024 & 2032
- Figure 18: South America Marine Coatings Industry Volume Share (%), by Country 2024 & 2032
- Figure 19: Middle East and Africa Marine Coatings Industry Revenue (Million), by Country 2024 & 2032
- Figure 20: Middle East and Africa Marine Coatings Industry Volume (liter ), by Country 2024 & 2032
- Figure 21: Middle East and Africa Marine Coatings Industry Revenue Share (%), by Country 2024 & 2032
- Figure 22: Middle East and Africa Marine Coatings Industry Volume Share (%), by Country 2024 & 2032
- Figure 23: Asia Pacific Marine Coatings Industry Revenue (Million), by Type 2024 & 2032
- Figure 24: Asia Pacific Marine Coatings Industry Volume (liter ), by Type 2024 & 2032
- Figure 25: Asia Pacific Marine Coatings Industry Revenue Share (%), by Type 2024 & 2032
- Figure 26: Asia Pacific Marine Coatings Industry Volume Share (%), by Type 2024 & 2032
- Figure 27: Asia Pacific Marine Coatings Industry Revenue (Million), by Resin 2024 & 2032
- Figure 28: Asia Pacific Marine Coatings Industry Volume (liter ), by Resin 2024 & 2032
- Figure 29: Asia Pacific Marine Coatings Industry Revenue Share (%), by Resin 2024 & 2032
- Figure 30: Asia Pacific Marine Coatings Industry Volume Share (%), by Resin 2024 & 2032
- Figure 31: Asia Pacific Marine Coatings Industry Revenue (Million), by Technology 2024 & 2032
- Figure 32: Asia Pacific Marine Coatings Industry Volume (liter ), by Technology 2024 & 2032
- Figure 33: Asia Pacific Marine Coatings Industry Revenue Share (%), by Technology 2024 & 2032
- Figure 34: Asia Pacific Marine Coatings Industry Volume Share (%), by Technology 2024 & 2032
- Figure 35: Asia Pacific Marine Coatings Industry Revenue (Million), by Application 2024 & 2032
- Figure 36: Asia Pacific Marine Coatings Industry Volume (liter ), by Application 2024 & 2032
- Figure 37: Asia Pacific Marine Coatings Industry Revenue Share (%), by Application 2024 & 2032
- Figure 38: Asia Pacific Marine Coatings Industry Volume Share (%), by Application 2024 & 2032
- Figure 39: Asia Pacific Marine Coatings Industry Revenue (Million), by Country 2024 & 2032
- Figure 40: Asia Pacific Marine Coatings Industry Volume (liter ), by Country 2024 & 2032
- Figure 41: Asia Pacific Marine Coatings Industry Revenue Share (%), by Country 2024 & 2032
- Figure 42: Asia Pacific Marine Coatings Industry Volume Share (%), by Country 2024 & 2032
- Figure 43: North America Marine Coatings Industry Revenue (Million), by Type 2024 & 2032
- Figure 44: North America Marine Coatings Industry Volume (liter ), by Type 2024 & 2032
- Figure 45: North America Marine Coatings Industry Revenue Share (%), by Type 2024 & 2032
- Figure 46: North America Marine Coatings Industry Volume Share (%), by Type 2024 & 2032
- Figure 47: North America Marine Coatings Industry Revenue (Million), by Resin 2024 & 2032
- Figure 48: North America Marine Coatings Industry Volume (liter ), by Resin 2024 & 2032
- Figure 49: North America Marine Coatings Industry Revenue Share (%), by Resin 2024 & 2032
- Figure 50: North America Marine Coatings Industry Volume Share (%), by Resin 2024 & 2032
- Figure 51: North America Marine Coatings Industry Revenue (Million), by Technology 2024 & 2032
- Figure 52: North America Marine Coatings Industry Volume (liter ), by Technology 2024 & 2032
- Figure 53: North America Marine Coatings Industry Revenue Share (%), by Technology 2024 & 2032
- Figure 54: North America Marine Coatings Industry Volume Share (%), by Technology 2024 & 2032
- Figure 55: North America Marine Coatings Industry Revenue (Million), by Application 2024 & 2032
- Figure 56: North America Marine Coatings Industry Volume (liter ), by Application 2024 & 2032
- Figure 57: North America Marine Coatings Industry Revenue Share (%), by Application 2024 & 2032
- Figure 58: North America Marine Coatings Industry Volume Share (%), by Application 2024 & 2032
- Figure 59: North America Marine Coatings Industry Revenue (Million), by Country 2024 & 2032
- Figure 60: North America Marine Coatings Industry Volume (liter ), by Country 2024 & 2032
- Figure 61: North America Marine Coatings Industry Revenue Share (%), by Country 2024 & 2032
- Figure 62: North America Marine Coatings Industry Volume Share (%), by Country 2024 & 2032
- Figure 63: Europe Marine Coatings Industry Revenue (Million), by Type 2024 & 2032
- Figure 64: Europe Marine Coatings Industry Volume (liter ), by Type 2024 & 2032
- Figure 65: Europe Marine Coatings Industry Revenue Share (%), by Type 2024 & 2032
- Figure 66: Europe Marine Coatings Industry Volume Share (%), by Type 2024 & 2032
- Figure 67: Europe Marine Coatings Industry Revenue (Million), by Resin 2024 & 2032
- Figure 68: Europe Marine Coatings Industry Volume (liter ), by Resin 2024 & 2032
- Figure 69: Europe Marine Coatings Industry Revenue Share (%), by Resin 2024 & 2032
- Figure 70: Europe Marine Coatings Industry Volume Share (%), by Resin 2024 & 2032
- Figure 71: Europe Marine Coatings Industry Revenue (Million), by Technology 2024 & 2032
- Figure 72: Europe Marine Coatings Industry Volume (liter ), by Technology 2024 & 2032
- Figure 73: Europe Marine Coatings Industry Revenue Share (%), by Technology 2024 & 2032
- Figure 74: Europe Marine Coatings Industry Volume Share (%), by Technology 2024 & 2032
- Figure 75: Europe Marine Coatings Industry Revenue (Million), by Application 2024 & 2032
- Figure 76: Europe Marine Coatings Industry Volume (liter ), by Application 2024 & 2032
- Figure 77: Europe Marine Coatings Industry Revenue Share (%), by Application 2024 & 2032
- Figure 78: Europe Marine Coatings Industry Volume Share (%), by Application 2024 & 2032
- Figure 79: Europe Marine Coatings Industry Revenue (Million), by Country 2024 & 2032
- Figure 80: Europe Marine Coatings Industry Volume (liter ), by Country 2024 & 2032
- Figure 81: Europe Marine Coatings Industry Revenue Share (%), by Country 2024 & 2032
- Figure 82: Europe Marine Coatings Industry Volume Share (%), by Country 2024 & 2032
- Figure 83: South America Marine Coatings Industry Revenue (Million), by Type 2024 & 2032
- Figure 84: South America Marine Coatings Industry Volume (liter ), by Type 2024 & 2032
- Figure 85: South America Marine Coatings Industry Revenue Share (%), by Type 2024 & 2032
- Figure 86: South America Marine Coatings Industry Volume Share (%), by Type 2024 & 2032
- Figure 87: South America Marine Coatings Industry Revenue (Million), by Resin 2024 & 2032
- Figure 88: South America Marine Coatings Industry Volume (liter ), by Resin 2024 & 2032
- Figure 89: South America Marine Coatings Industry Revenue Share (%), by Resin 2024 & 2032
- Figure 90: South America Marine Coatings Industry Volume Share (%), by Resin 2024 & 2032
- Figure 91: South America Marine Coatings Industry Revenue (Million), by Technology 2024 & 2032
- Figure 92: South America Marine Coatings Industry Volume (liter ), by Technology 2024 & 2032
- Figure 93: South America Marine Coatings Industry Revenue Share (%), by Technology 2024 & 2032
- Figure 94: South America Marine Coatings Industry Volume Share (%), by Technology 2024 & 2032
- Figure 95: South America Marine Coatings Industry Revenue (Million), by Application 2024 & 2032
- Figure 96: South America Marine Coatings Industry Volume (liter ), by Application 2024 & 2032
- Figure 97: South America Marine Coatings Industry Revenue Share (%), by Application 2024 & 2032
- Figure 98: South America Marine Coatings Industry Volume Share (%), by Application 2024 & 2032
- Figure 99: South America Marine Coatings Industry Revenue (Million), by Country 2024 & 2032
- Figure 100: South America Marine Coatings Industry Volume (liter ), by Country 2024 & 2032
- Figure 101: South America Marine Coatings Industry Revenue Share (%), by Country 2024 & 2032
- Figure 102: South America Marine Coatings Industry Volume Share (%), by Country 2024 & 2032
- Figure 103: Middle East and Africa Marine Coatings Industry Revenue (Million), by Type 2024 & 2032
- Figure 104: Middle East and Africa Marine Coatings Industry Volume (liter ), by Type 2024 & 2032
- Figure 105: Middle East and Africa Marine Coatings Industry Revenue Share (%), by Type 2024 & 2032
- Figure 106: Middle East and Africa Marine Coatings Industry Volume Share (%), by Type 2024 & 2032
- Figure 107: Middle East and Africa Marine Coatings Industry Revenue (Million), by Resin 2024 & 2032
- Figure 108: Middle East and Africa Marine Coatings Industry Volume (liter ), by Resin 2024 & 2032
- Figure 109: Middle East and Africa Marine Coatings Industry Revenue Share (%), by Resin 2024 & 2032
- Figure 110: Middle East and Africa Marine Coatings Industry Volume Share (%), by Resin 2024 & 2032
- Figure 111: Middle East and Africa Marine Coatings Industry Revenue (Million), by Technology 2024 & 2032
- Figure 112: Middle East and Africa Marine Coatings Industry Volume (liter ), by Technology 2024 & 2032
- Figure 113: Middle East and Africa Marine Coatings Industry Revenue Share (%), by Technology 2024 & 2032
- Figure 114: Middle East and Africa Marine Coatings Industry Volume Share (%), by Technology 2024 & 2032
- Figure 115: Middle East and Africa Marine Coatings Industry Revenue (Million), by Application 2024 & 2032
- Figure 116: Middle East and Africa Marine Coatings Industry Volume (liter ), by Application 2024 & 2032
- Figure 117: Middle East and Africa Marine Coatings Industry Revenue Share (%), by Application 2024 & 2032
- Figure 118: Middle East and Africa Marine Coatings Industry Volume Share (%), by Application 2024 & 2032
- Figure 119: Middle East and Africa Marine Coatings Industry Revenue (Million), by Country 2024 & 2032
- Figure 120: Middle East and Africa Marine Coatings Industry Volume (liter ), by Country 2024 & 2032
- Figure 121: Middle East and Africa Marine Coatings Industry Revenue Share (%), by Country 2024 & 2032
- Figure 122: Middle East and Africa Marine Coatings Industry Volume Share (%), by Country 2024 & 2032
List of Tables
- Table 1: Global Marine Coatings Industry Revenue Million Forecast, by Region 2019 & 2032
- Table 2: Global Marine Coatings Industry Volume liter Forecast, by Region 2019 & 2032
- Table 3: Global Marine Coatings Industry Revenue Million Forecast, by Type 2019 & 2032
- Table 4: Global Marine Coatings Industry Volume liter Forecast, by Type 2019 & 2032
- Table 5: Global Marine Coatings Industry Revenue Million Forecast, by Resin 2019 & 2032
- Table 6: Global Marine Coatings Industry Volume liter Forecast, by Resin 2019 & 2032
- Table 7: Global Marine Coatings Industry Revenue Million Forecast, by Technology 2019 & 2032
- Table 8: Global Marine Coatings Industry Volume liter Forecast, by Technology 2019 & 2032
- Table 9: Global Marine Coatings Industry Revenue Million Forecast, by Application 2019 & 2032
- Table 10: Global Marine Coatings Industry Volume liter Forecast, by Application 2019 & 2032
- Table 11: Global Marine Coatings Industry Revenue Million Forecast, by Region 2019 & 2032
- Table 12: Global Marine Coatings Industry Volume liter Forecast, by Region 2019 & 2032
- Table 13: Global Marine Coatings Industry Revenue Million Forecast, by Country 2019 & 2032
- Table 14: Global Marine Coatings Industry Volume liter Forecast, by Country 2019 & 2032
- Table 15: China Marine Coatings Industry Revenue (Million) Forecast, by Application 2019 & 2032
- Table 16: China Marine Coatings Industry Volume (liter ) Forecast, by Application 2019 & 2032
- Table 17: India Marine Coatings Industry Revenue (Million) Forecast, by Application 2019 & 2032
- Table 18: India Marine Coatings Industry Volume (liter ) Forecast, by Application 2019 & 2032
- Table 19: Japan Marine Coatings Industry Revenue (Million) Forecast, by Application 2019 & 2032
- Table 20: Japan Marine Coatings Industry Volume (liter ) Forecast, by Application 2019 & 2032
- Table 21: South Korea Marine Coatings Industry Revenue (Million) Forecast, by Application 2019 & 2032
- Table 22: South Korea Marine Coatings Industry Volume (liter ) Forecast, by Application 2019 & 2032
- Table 23: Malaysia Marine Coatings Industry Revenue (Million) Forecast, by Application 2019 & 2032
- Table 24: Malaysia Marine Coatings Industry Volume (liter ) Forecast, by Application 2019 & 2032
- Table 25: Vietnam Marine Coatings Industry Revenue (Million) Forecast, by Application 2019 & 2032
- Table 26: Vietnam Marine Coatings Industry Volume (liter ) Forecast, by Application 2019 & 2032
- Table 27: Rest of Asia Pacific Marine Coatings Industry Revenue (Million) Forecast, by Application 2019 & 2032
- Table 28: Rest of Asia Pacific Marine Coatings Industry Volume (liter ) Forecast, by Application 2019 & 2032
- Table 29: Global Marine Coatings Industry Revenue Million Forecast, by Country 2019 & 2032
- Table 30: Global Marine Coatings Industry Volume liter Forecast, by Country 2019 & 2032
- Table 31: United States Marine Coatings Industry Revenue (Million) Forecast, by Application 2019 & 2032
- Table 32: United States Marine Coatings Industry Volume (liter ) Forecast, by Application 2019 & 2032
- Table 33: Canada Marine Coatings Industry Revenue (Million) Forecast, by Application 2019 & 2032
- Table 34: Canada Marine Coatings Industry Volume (liter ) Forecast, by Application 2019 & 2032
- Table 35: Mexico Marine Coatings Industry Revenue (Million) Forecast, by Application 2019 & 2032
- Table 36: Mexico Marine Coatings Industry Volume (liter ) Forecast, by Application 2019 & 2032
- Table 37: Global Marine Coatings Industry Revenue Million Forecast, by Country 2019 & 2032
- Table 38: Global Marine Coatings Industry Volume liter Forecast, by Country 2019 & 2032
- Table 39: Germany Marine Coatings Industry Revenue (Million) Forecast, by Application 2019 & 2032
- Table 40: Germany Marine Coatings Industry Volume (liter ) Forecast, by Application 2019 & 2032
- Table 41: United Kingdom Marine Coatings Industry Revenue (Million) Forecast, by Application 2019 & 2032
- Table 42: United Kingdom Marine Coatings Industry Volume (liter ) Forecast, by Application 2019 & 2032
- Table 43: Italy Marine Coatings Industry Revenue (Million) Forecast, by Application 2019 & 2032
- Table 44: Italy Marine Coatings Industry Volume (liter ) Forecast, by Application 2019 & 2032
- Table 45: France Marine Coatings Industry Revenue (Million) Forecast, by Application 2019 & 2032
- Table 46: France Marine Coatings Industry Volume (liter ) Forecast, by Application 2019 & 2032
- Table 47: Rest of Europe Marine Coatings Industry Revenue (Million) Forecast, by Application 2019 & 2032
- Table 48: Rest of Europe Marine Coatings Industry Volume (liter ) Forecast, by Application 2019 & 2032
- Table 49: Global Marine Coatings Industry Revenue Million Forecast, by Country 2019 & 2032
- Table 50: Global Marine Coatings Industry Volume liter Forecast, by Country 2019 & 2032
- Table 51: Brazil Marine Coatings Industry Revenue (Million) Forecast, by Application 2019 & 2032
- Table 52: Brazil Marine Coatings Industry Volume (liter ) Forecast, by Application 2019 & 2032
- Table 53: Argentina Marine Coatings Industry Revenue (Million) Forecast, by Application 2019 & 2032
- Table 54: Argentina Marine Coatings Industry Volume (liter ) Forecast, by Application 2019 & 2032
- Table 55: Rest of South America Marine Coatings Industry Revenue (Million) Forecast, by Application 2019 & 2032
- Table 56: Rest of South America Marine Coatings Industry Volume (liter ) Forecast, by Application 2019 & 2032
- Table 57: Global Marine Coatings Industry Revenue Million Forecast, by Country 2019 & 2032
- Table 58: Global Marine Coatings Industry Volume liter Forecast, by Country 2019 & 2032
- Table 59: Saudi Arabia Marine Coatings Industry Revenue (Million) Forecast, by Application 2019 & 2032
- Table 60: Saudi Arabia Marine Coatings Industry Volume (liter ) Forecast, by Application 2019 & 2032
- Table 61: South Africa Marine Coatings Industry Revenue (Million) Forecast, by Application 2019 & 2032
- Table 62: South Africa Marine Coatings Industry Volume (liter ) Forecast, by Application 2019 & 2032
- Table 63: Rest of Middle East and Africa Marine Coatings Industry Revenue (Million) Forecast, by Application 2019 & 2032
- Table 64: Rest of Middle East and Africa Marine Coatings Industry Volume (liter ) Forecast, by Application 2019 & 2032
- Table 65: Global Marine Coatings Industry Revenue Million Forecast, by Type 2019 & 2032
- Table 66: Global Marine Coatings Industry Volume liter Forecast, by Type 2019 & 2032
- Table 67: Global Marine Coatings Industry Revenue Million Forecast, by Resin 2019 & 2032
- Table 68: Global Marine Coatings Industry Volume liter Forecast, by Resin 2019 & 2032
- Table 69: Global Marine Coatings Industry Revenue Million Forecast, by Technology 2019 & 2032
- Table 70: Global Marine Coatings Industry Volume liter Forecast, by Technology 2019 & 2032
- Table 71: Global Marine Coatings Industry Revenue Million Forecast, by Application 2019 & 2032
- Table 72: Global Marine Coatings Industry Volume liter Forecast, by Application 2019 & 2032
- Table 73: Global Marine Coatings Industry Revenue Million Forecast, by Country 2019 & 2032
- Table 74: Global Marine Coatings Industry Volume liter Forecast, by Country 2019 & 2032
- Table 75: China Marine Coatings Industry Revenue (Million) Forecast, by Application 2019 & 2032
- Table 76: China Marine Coatings Industry Volume (liter ) Forecast, by Application 2019 & 2032
- Table 77: India Marine Coatings Industry Revenue (Million) Forecast, by Application 2019 & 2032
- Table 78: India Marine Coatings Industry Volume (liter ) Forecast, by Application 2019 & 2032
- Table 79: Japan Marine Coatings Industry Revenue (Million) Forecast, by Application 2019 & 2032
- Table 80: Japan Marine Coatings Industry Volume (liter ) Forecast, by Application 2019 & 2032
- Table 81: South Korea Marine Coatings Industry Revenue (Million) Forecast, by Application 2019 & 2032
- Table 82: South Korea Marine Coatings Industry Volume (liter ) Forecast, by Application 2019 & 2032
- Table 83: Malaysia Marine Coatings Industry Revenue (Million) Forecast, by Application 2019 & 2032
- Table 84: Malaysia Marine Coatings Industry Volume (liter ) Forecast, by Application 2019 & 2032
- Table 85: Vietnam Marine Coatings Industry Revenue (Million) Forecast, by Application 2019 & 2032
- Table 86: Vietnam Marine Coatings Industry Volume (liter ) Forecast, by Application 2019 & 2032
- Table 87: Rest of Asia Pacific Marine Coatings Industry Revenue (Million) Forecast, by Application 2019 & 2032
- Table 88: Rest of Asia Pacific Marine Coatings Industry Volume (liter ) Forecast, by Application 2019 & 2032
- Table 89: Global Marine Coatings Industry Revenue Million Forecast, by Type 2019 & 2032
- Table 90: Global Marine Coatings Industry Volume liter Forecast, by Type 2019 & 2032
- Table 91: Global Marine Coatings Industry Revenue Million Forecast, by Resin 2019 & 2032
- Table 92: Global Marine Coatings Industry Volume liter Forecast, by Resin 2019 & 2032
- Table 93: Global Marine Coatings Industry Revenue Million Forecast, by Technology 2019 & 2032
- Table 94: Global Marine Coatings Industry Volume liter Forecast, by Technology 2019 & 2032
- Table 95: Global Marine Coatings Industry Revenue Million Forecast, by Application 2019 & 2032
- Table 96: Global Marine Coatings Industry Volume liter Forecast, by Application 2019 & 2032
- Table 97: Global Marine Coatings Industry Revenue Million Forecast, by Country 2019 & 2032
- Table 98: Global Marine Coatings Industry Volume liter Forecast, by Country 2019 & 2032
- Table 99: United States Marine Coatings Industry Revenue (Million) Forecast, by Application 2019 & 2032
- Table 100: United States Marine Coatings Industry Volume (liter ) Forecast, by Application 2019 & 2032
- Table 101: Canada Marine Coatings Industry Revenue (Million) Forecast, by Application 2019 & 2032
- Table 102: Canada Marine Coatings Industry Volume (liter ) Forecast, by Application 2019 & 2032
- Table 103: Mexico Marine Coatings Industry Revenue (Million) Forecast, by Application 2019 & 2032
- Table 104: Mexico Marine Coatings Industry Volume (liter ) Forecast, by Application 2019 & 2032
- Table 105: Global Marine Coatings Industry Revenue Million Forecast, by Type 2019 & 2032
- Table 106: Global Marine Coatings Industry Volume liter Forecast, by Type 2019 & 2032
- Table 107: Global Marine Coatings Industry Revenue Million Forecast, by Resin 2019 & 2032
- Table 108: Global Marine Coatings Industry Volume liter Forecast, by Resin 2019 & 2032
- Table 109: Global Marine Coatings Industry Revenue Million Forecast, by Technology 2019 & 2032
- Table 110: Global Marine Coatings Industry Volume liter Forecast, by Technology 2019 & 2032
- Table 111: Global Marine Coatings Industry Revenue Million Forecast, by Application 2019 & 2032
- Table 112: Global Marine Coatings Industry Volume liter Forecast, by Application 2019 & 2032
- Table 113: Global Marine Coatings Industry Revenue Million Forecast, by Country 2019 & 2032
- Table 114: Global Marine Coatings Industry Volume liter Forecast, by Country 2019 & 2032
- Table 115: Germany Marine Coatings Industry Revenue (Million) Forecast, by Application 2019 & 2032
- Table 116: Germany Marine Coatings Industry Volume (liter ) Forecast, by Application 2019 & 2032
- Table 117: United Kingdom Marine Coatings Industry Revenue (Million) Forecast, by Application 2019 & 2032
- Table 118: United Kingdom Marine Coatings Industry Volume (liter ) Forecast, by Application 2019 & 2032
- Table 119: Italy Marine Coatings Industry Revenue (Million) Forecast, by Application 2019 & 2032
- Table 120: Italy Marine Coatings Industry Volume (liter ) Forecast, by Application 2019 & 2032
- Table 121: France Marine Coatings Industry Revenue (Million) Forecast, by Application 2019 & 2032
- Table 122: France Marine Coatings Industry Volume (liter ) Forecast, by Application 2019 & 2032
- Table 123: Rest of Europe Marine Coatings Industry Revenue (Million) Forecast, by Application 2019 & 2032
- Table 124: Rest of Europe Marine Coatings Industry Volume (liter ) Forecast, by Application 2019 & 2032
- Table 125: Global Marine Coatings Industry Revenue Million Forecast, by Type 2019 & 2032
- Table 126: Global Marine Coatings Industry Volume liter Forecast, by Type 2019 & 2032
- Table 127: Global Marine Coatings Industry Revenue Million Forecast, by Resin 2019 & 2032
- Table 128: Global Marine Coatings Industry Volume liter Forecast, by Resin 2019 & 2032
- Table 129: Global Marine Coatings Industry Revenue Million Forecast, by Technology 2019 & 2032
- Table 130: Global Marine Coatings Industry Volume liter Forecast, by Technology 2019 & 2032
- Table 131: Global Marine Coatings Industry Revenue Million Forecast, by Application 2019 & 2032
- Table 132: Global Marine Coatings Industry Volume liter Forecast, by Application 2019 & 2032
- Table 133: Global Marine Coatings Industry Revenue Million Forecast, by Country 2019 & 2032
- Table 134: Global Marine Coatings Industry Volume liter Forecast, by Country 2019 & 2032
- Table 135: Brazil Marine Coatings Industry Revenue (Million) Forecast, by Application 2019 & 2032
- Table 136: Brazil Marine Coatings Industry Volume (liter ) Forecast, by Application 2019 & 2032
- Table 137: Argentina Marine Coatings Industry Revenue (Million) Forecast, by Application 2019 & 2032
- Table 138: Argentina Marine Coatings Industry Volume (liter ) Forecast, by Application 2019 & 2032
- Table 139: Rest of South America Marine Coatings Industry Revenue (Million) Forecast, by Application 2019 & 2032
- Table 140: Rest of South America Marine Coatings Industry Volume (liter ) Forecast, by Application 2019 & 2032
- Table 141: Global Marine Coatings Industry Revenue Million Forecast, by Type 2019 & 2032
- Table 142: Global Marine Coatings Industry Volume liter Forecast, by Type 2019 & 2032
- Table 143: Global Marine Coatings Industry Revenue Million Forecast, by Resin 2019 & 2032
- Table 144: Global Marine Coatings Industry Volume liter Forecast, by Resin 2019 & 2032
- Table 145: Global Marine Coatings Industry Revenue Million Forecast, by Technology 2019 & 2032
- Table 146: Global Marine Coatings Industry Volume liter Forecast, by Technology 2019 & 2032
- Table 147: Global Marine Coatings Industry Revenue Million Forecast, by Application 2019 & 2032
- Table 148: Global Marine Coatings Industry Volume liter Forecast, by Application 2019 & 2032
- Table 149: Global Marine Coatings Industry Revenue Million Forecast, by Country 2019 & 2032
- Table 150: Global Marine Coatings Industry Volume liter Forecast, by Country 2019 & 2032
- Table 151: Saudi Arabia Marine Coatings Industry Revenue (Million) Forecast, by Application 2019 & 2032
- Table 152: Saudi Arabia Marine Coatings Industry Volume (liter ) Forecast, by Application 2019 & 2032
- Table 153: South Africa Marine Coatings Industry Revenue (Million) Forecast, by Application 2019 & 2032
- Table 154: South Africa Marine Coatings Industry Volume (liter ) Forecast, by Application 2019 & 2032
- Table 155: Rest of Middle East and Africa Marine Coatings Industry Revenue (Million) Forecast, by Application 2019 & 2032
- Table 156: Rest of Middle East and Africa Marine Coatings Industry Volume (liter ) Forecast, by Application 2019 & 2032
Frequently Asked Questions
1. What is the projected Compound Annual Growth Rate (CAGR) of the Marine Coatings Industry?
The projected CAGR is approximately > 4.50%.
2. Which companies are prominent players in the Marine Coatings Industry?
Key companies in the market include Engineered Marine Coatings LLC, The Sherwin-Williams Company*List Not Exhaustive, AkzoNobel N V, Chugoku Marine Paints Ltd, KCC CORPORATION, Jotun, RPM International Inc, Kansai Paint Marine Co Ltd, Pettit Marine Paints, PPG Industries Inc, BOERO BARTOLOMEO S p A, Nippon Paint Marine Coatings Co Ltd, BASF SE, Axalta Coating Systems, Hempel A/S, MCU COATING INTERNATIONAL.
3. What are the main segments of the Marine Coatings Industry?
The market segments include Type, Resin, Technology, Application.
4. Can you provide details about the market size?
The market size is estimated to be USD 3.77 Million as of 2022.
5. What are some drivers contributing to market growth?
Increase in Production of Leisure Boats and Cruise Ships; Growing Ship Repairs and Maintenance Activities.
6. What are the notable trends driving market growth?
Marine OEM Application Segment to Dominate The Market.
7. Are there any restraints impacting market growth?
Stringent Government Regulations; Sluggish Growth in Shipbuilding Activities in Few Countries.
8. Can you provide examples of recent developments in the market?
March 2023: PPG launched the PPG SIGMAGLIDE 2390 marine coating to help shipowners lower power consumption and carbon emissions and meet demands for higher performance without adversely impacting the marine environment.
9. What pricing options are available for accessing the report?
Pricing options include single-user, multi-user, and enterprise licenses priced at USD 4750, USD 5250, and USD 8750 respectively.
10. Is the market size provided in terms of value or volume?
The market size is provided in terms of value, measured in Million and volume, measured in liter .
11. Are there any specific market keywords associated with the report?
Yes, the market keyword associated with the report is "Marine Coatings Industry," which aids in identifying and referencing the specific market segment covered.
12. How do I determine which pricing option suits my needs best?
The pricing options vary based on user requirements and access needs. Individual users may opt for single-user licenses, while businesses requiring broader access may choose multi-user or enterprise licenses for cost-effective access to the report.
13. Are there any additional resources or data provided in the Marine Coatings Industry report?
While the report offers comprehensive insights, it's advisable to review the specific contents or supplementary materials provided to ascertain if additional resources or data are available.
14. How can I stay updated on further developments or reports in the Marine Coatings Industry?
To stay informed about further developments, trends, and reports in the Marine Coatings Industry, consider subscribing to industry newsletters, following relevant companies and organizations, or regularly checking reputable industry news sources and publications.
Methodology
Step 1 - Identification of Relevant Samples Size from Population Database


Step 2 - Approaches for Defining Global Market Size (Value, Volume* & Price*)

Note*: In applicable scenarios
Step 3 - Data Sources
Primary Research
- Web Analytics
- Survey Reports
- Research Institute
- Latest Research Reports
- Opinion Leaders
Secondary Research
- Annual Reports
- White Paper
- Latest Press Release
- Industry Association
- Paid Database
- Investor Presentations

Step 4 - Data Triangulation
Involves using different sources of information in order to increase the validity of a study
These sources are likely to be stakeholders in a program - participants, other researchers, program staff, other community members, and so on.
Then we put all data in single framework & apply various statistical tools to find out the dynamic on the market.
During the analysis stage, feedback from the stakeholder groups would be compared to determine areas of agreement as well as areas of divergence


