


Key Insights
The Middle East & Africa (MEA) Functional Beverages market, while currently smaller in scale than major global regions, demonstrates significant growth potential. This expansion is propelled by heightened health awareness, increasing disposable incomes, and a youthful demographic. The market is projected to grow at a Compound Annual Growth Rate (CAGR) of 5.6%. Key growth drivers include the rising popularity of sports and energy drinks, attributed to increased fitness engagement and demand for convenient energy solutions. Additionally, a growing preference for fortified juices and dairy-based beverages, particularly those addressing specific dietary needs and health objectives, is a major contributor. However, market expansion may be moderated by consumer price sensitivity in certain MEA segments and varying levels of awareness regarding the health advantages of specific functional beverages. Distribution channels are critical, with supermarkets/hypermarkets and pharmacies maintaining dominance, while online retail shows emerging traction. The competitive landscape is robust, featuring global brands and regional participants.

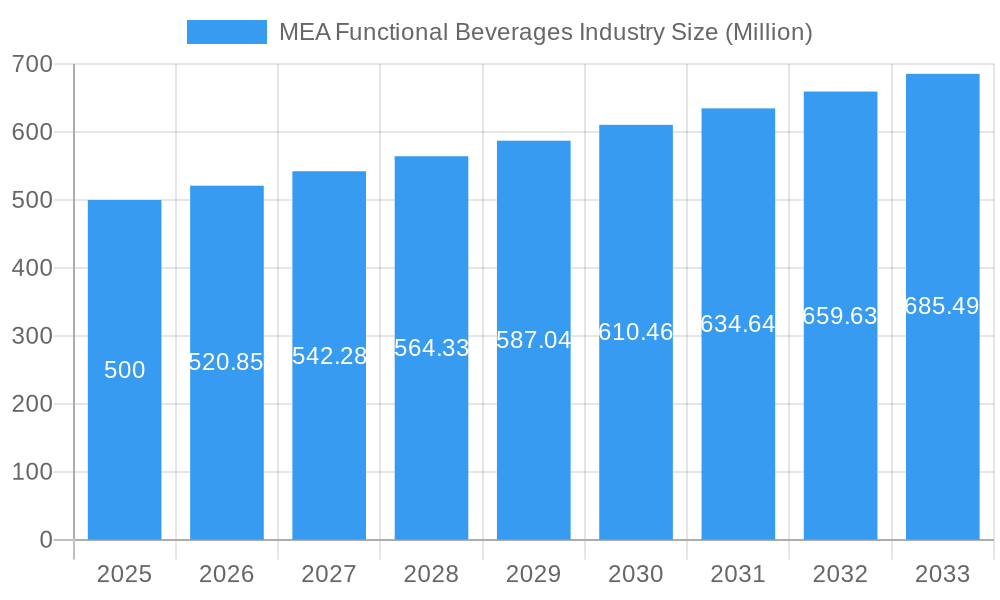
MEA Functional Beverages Industry Market Size (In Billion)

The United Arab Emirates (UAE) and Saudi Arabia are spearheading growth within the MEA region, supported by high per capita incomes and developed retail infrastructures. Expansion is anticipated to be more rapid in these mature markets, with other regions experiencing steady, albeit slower, growth driven by affordability and awareness advancements. Evolving consumer preferences and product innovation will shape the dominance of specific product categories, such as energy drinks. Strategic imperatives for market players include product diversification, distribution network enhancement, and targeted health and wellness marketing to ensure sustained success in this dynamic market. The MEA Functional Beverages market size was valued at 171.86 billion in the base year 2025.
MEA Functional Beverages Industry Company Market Share
MEA Functional Beverages Industry: A Comprehensive Market Report (2019-2033)
This in-depth report provides a comprehensive analysis of the Middle East and Africa (MEA) functional beverages industry, offering invaluable insights for industry professionals, investors, and stakeholders. Covering the period 2019-2033, with a focus on 2025, this report meticulously examines market dynamics, growth drivers, challenges, and future opportunities. The report projects a xx Million market value by 2033, showcasing significant growth potential within the region.
MEA Functional Beverages Industry Market Structure & Innovation Trends
This section analyzes the MEA functional beverage market's competitive landscape, focusing on market concentration, innovation drivers, regulatory frameworks, product substitutes, end-user demographics, and mergers & acquisitions (M&A) activity. The market exhibits a moderately concentrated structure, with key players like Nestle SA, PepsiCo Inc, and The Coca-Cola Company holding significant market share. However, smaller, specialized brands are also emerging, particularly in the niche segments like fortified juices and dairy-based functional drinks.
- Market Concentration: The top 5 players hold an estimated xx% market share in 2025, indicating moderate concentration.
- Innovation Drivers: Growing health consciousness, increasing disposable incomes, and the rise of athleisure trends are driving innovation in product formulations and packaging.
- Regulatory Framework: Varying regulatory landscapes across different MEA countries influence product development and marketing strategies. Harmonization efforts are ongoing but present ongoing challenges.
- Product Substitutes: Traditional beverages and other health supplements compete with functional beverages, influencing consumer choices.
- End-User Demographics: The primary consumers are young adults (18-35) and health-conscious individuals across various socioeconomic groups.
- M&A Activity: The MEA region witnessed xx Million in M&A deals in the functional beverage sector between 2019 and 2024, primarily driven by expansion strategies of larger players. Smaller acquisitions focus on niche brands and specialized product lines.
MEA Functional Beverages Industry Market Dynamics & Trends
The MEA functional beverages market is experiencing robust growth, driven by several factors. The CAGR during the forecast period (2025-2033) is projected at xx%, exceeding the global average. Increasing health awareness among consumers, coupled with rising disposable incomes, particularly in urban areas, is a significant driver. Furthermore, the expansion of organized retail channels and the growing penetration of e-commerce platforms are boosting market accessibility. Technological advancements in product formulation and packaging are also contributing to the market's dynamism. However, competitive intensity, fluctuating raw material prices, and evolving consumer preferences pose considerable challenges. Market penetration of functional beverages in rural areas remains low, presenting a considerable growth opportunity.
Dominant Regions & Segments in MEA Functional Beverages Industry
The GCC countries (UAE, Saudi Arabia, etc.) currently dominate the MEA functional beverages market, driven by high disposable incomes and a strong preference for health and wellness products. However, significant growth potential exists in North Africa and Sub-Saharan Africa.
Leading Regions:
- GCC Countries: High per capita income, developed retail infrastructure, and increasing health consciousness drive market dominance.
- North Africa: Growing urbanization and rising disposable incomes are fueling market growth, though infrastructure limitations pose challenges.
- Sub-Saharan Africa: Significant untapped potential exists, primarily hindered by low purchasing power and limited access to organized retail channels.
Leading Segments:
- Product Type: Energy drinks currently hold the largest market share, followed by sports drinks. Fortified juices and dairy-based functional drinks are experiencing rapid growth.
- Distribution Channel: Supermarkets/hypermarkets dominate, followed by convenience stores. Online retail channels are steadily expanding their market presence, driven by increasing internet penetration and e-commerce adoption.
Key Drivers:
- Economic growth: Rising disposable incomes across the MEA region are increasing consumer spending on functional beverages.
- Infrastructure development: The expansion of retail networks and improved logistics infrastructure is driving market accessibility.
- Government initiatives: Policies promoting health and wellness are indirectly supporting the functional beverage industry.
MEA Functional Beverages Industry Product Innovations
Recent product innovations reflect a strong focus on natural ingredients, low-sugar formulations, and enhanced functional benefits. Companies are leveraging technological advancements in packaging to enhance shelf life and improve consumer experience. For example, the launch of hemp-based energy drinks by PepsiCo and the introduction of organic, low-calorie carbonated energy beverages by Perrier exemplify the industry's shift towards healthier and more sustainable options. This alignment with evolving consumer preferences is driving market growth.
Report Scope & Segmentation Analysis
This report segments the MEA functional beverages market based on distribution channel (Supermarket/Hypermarket, Pharmacies and Health Stores, Convenience Stores, Online Retail Stores, Other Distribution Channels) and product type (Energy Drinks, Fortified Juice, Sports Drinks, Dairy-based Drinks, Other Product Types). Growth projections, market size estimations, and competitive dynamics are analyzed for each segment. The energy drink segment is projected to maintain the largest market share throughout the forecast period, driven by strong consumer demand. However, other segments, like fortified juices and sports drinks, are anticipated to experience faster growth rates. The online retail channel is expected to show the most significant expansion, driven by increasing internet penetration and e-commerce adoption.
Key Drivers of MEA Functional Beverages Industry Growth
The growth of the MEA functional beverages industry is fueled by several factors: a rising health-conscious population seeking convenient and nutritious options, increasing urbanization and disposable incomes, and the expansion of modern retail channels. Government initiatives promoting healthy lifestyles indirectly contribute to industry growth. Technological advancements in product formulation and packaging also create new opportunities for product differentiation and market expansion. The growing adoption of e-commerce platforms is facilitating market penetration and access to previously underserved segments.
Challenges in the MEA Functional Beverages Industry Sector
The MEA functional beverages industry faces various challenges. These include intense competition among established and emerging players, fluctuating raw material prices impacting profitability, and the complexities of navigating diverse regulatory environments across various MEA countries. Supply chain inefficiencies, particularly in certain regions, add to operational challenges. Consumer preference shifts and evolving health trends require continuous product innovation to maintain market relevance.
Emerging Opportunities in MEA Functional Beverages Industry
Significant growth opportunities exist in the MEA region. Untapped potential lies in the expansion into rural markets, particularly in Sub-Saharan Africa. The increasing demand for natural and organic products presents significant opportunities for companies offering such offerings. The rise of e-commerce and online retail provides a pathway to expand market reach and customer base. The introduction of innovative product formats and flavors can cater to evolving consumer preferences and increase market share.
Leading Players in the MEA Functional Beverages Industry Market
- Nestle SA
- Herbalife International of America Inc
- Sapporo Holdings
- Mutalo Group
- Monster Beverage Corporation
- PepsiCo Inc
- Dr Pepper Snapple
- Viju Industries Nigeria Ltd
- iPRO Sport Distribution Limited
- Red Bull GmbH
- The Coca-Cola Company
Key Developments in MEA Functional Beverages Industry
- October 2022: iPRO launched a range of sports drinks in Carrefour stores across the UAE, highlighting the growing demand for vitamin-enriched beverages.
- February 2022: PepsiCo launched its hemp-based "Rockstar Energy" drink, demonstrating the industry's embrace of novel ingredients and potentially healthier alternatives.
- March 2021: Perrier introduced its first carbonated energy drinks in Saudi Arabia, showcasing the expansion into new product categories and the growing popularity of organic and low-calorie options.
Future Outlook for MEA Functional Beverages Industry Market
The MEA functional beverages market is poised for significant growth in the coming years. Continued urbanization, rising disposable incomes, and increasing health awareness will fuel demand. Product innovation, particularly in natural and organic categories, will drive further expansion. The strategic expansion of e-commerce channels and the penetration into underserved markets will unlock substantial market opportunities. The industry's future success will rely on adapting to evolving consumer preferences, maintaining competitive pricing, and effectively navigating the region's diverse regulatory landscapes.
MEA Functional Beverages Industry Segmentation
-
1. Product Type
- 1.1. Energy Drinks
- 1.2. Fortified Juice
- 1.3. Sports Drinks
- 1.4. Dairy-based Drinks
- 1.5. Other Product Types
-
2. Distribution Channel
- 2.1. Supermarket/Hypermarket
- 2.2. Pharmacies and Health Stores
- 2.3. Convenience Stores
- 2.4. Online Retail Stores
- 2.5. Other Distribution Channels
-
3. Geography
- 3.1. South Africa
- 3.2. Saudi Arabia
- 3.3. Rest of Middle-East and Africa
MEA Functional Beverages Industry Segmentation By Geography
- 1. South Africa
- 2. Saudi Arabia
- 3. Rest of Middle East and Africa
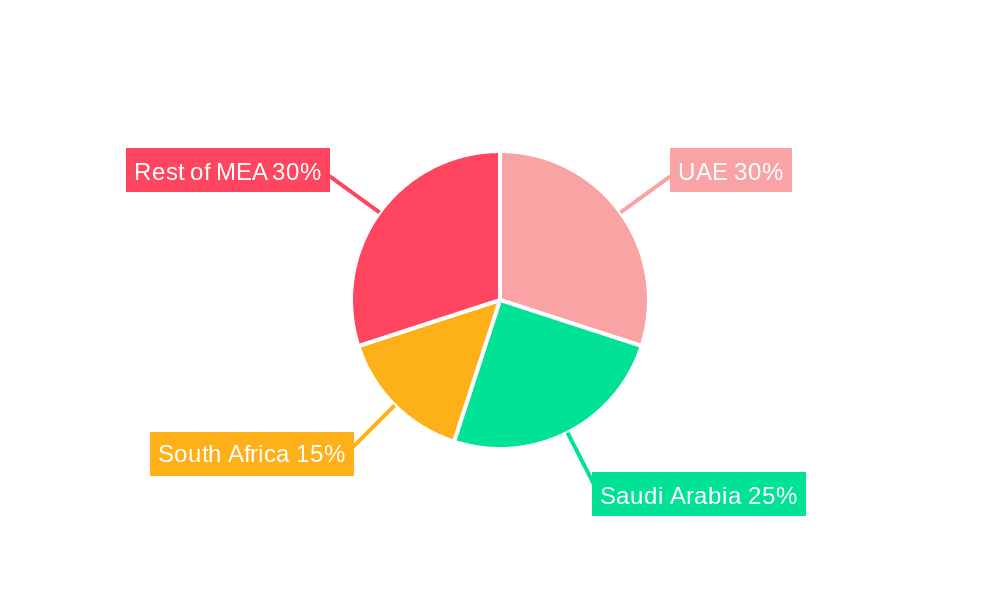
MEA Functional Beverages Industry Regional Market Share
Geographic Coverage of MEA Functional Beverages Industry
MEA Functional Beverages Industry REPORT HIGHLIGHTS
| Aspects | Details |
|---|---|
| Study Period | 2020-2034 |
| Base Year | 2025 |
| Estimated Year | 2026 |
| Forecast Period | 2026-2034 |
| Historical Period | 2020-2025 |
| Growth Rate | CAGR of 5.6% from 2020-2034 |
| Segmentation |
|
Table of Contents
- 1. Introduction
- 1.1. Research Scope
- 1.2. Market Segmentation
- 1.3. Research Methodology
- 1.4. Definitions and Assumptions
- 2. Executive Summary
- 2.1. Introduction
- 3. Market Dynamics
- 3.1. Introduction
- 3.2. Market Drivers
- 3.2.1. Preference for Plant-based and Clean-label RTD Products; Consumer Inclination Toward Sugar-Free Drinks
- 3.3. Market Restrains
- 3.3.1. Concerns Over Health Issues Associated With Beverages
- 3.4. Market Trends
- 3.4.1. Growing Demand for Plant-based and Lactose-free Products
- 4. Market Factor Analysis
- 4.1. Porters Five Forces
- 4.2. Supply/Value Chain
- 4.3. PESTEL analysis
- 4.4. Market Entropy
- 4.5. Patent/Trademark Analysis
- 5. Global MEA Functional Beverages Industry Analysis, Insights and Forecast, 2020-2032
- 5.1. Market Analysis, Insights and Forecast - by Product Type
- 5.1.1. Energy Drinks
- 5.1.2. Fortified Juice
- 5.1.3. Sports Drinks
- 5.1.4. Dairy-based Drinks
- 5.1.5. Other Product Types
- 5.2. Market Analysis, Insights and Forecast - by Distribution Channel
- 5.2.1. Supermarket/Hypermarket
- 5.2.2. Pharmacies and Health Stores
- 5.2.3. Convenience Stores
- 5.2.4. Online Retail Stores
- 5.2.5. Other Distribution Channels
- 5.3. Market Analysis, Insights and Forecast - by Geography
- 5.3.1. South Africa
- 5.3.2. Saudi Arabia
- 5.3.3. Rest of Middle-East and Africa
- 5.4. Market Analysis, Insights and Forecast - by Region
- 5.4.1. South Africa
- 5.4.2. Saudi Arabia
- 5.4.3. Rest of Middle East and Africa
- 5.1. Market Analysis, Insights and Forecast - by Product Type
- 6. South Africa MEA Functional Beverages Industry Analysis, Insights and Forecast, 2020-2032
- 6.1. Market Analysis, Insights and Forecast - by Product Type
- 6.1.1. Energy Drinks
- 6.1.2. Fortified Juice
- 6.1.3. Sports Drinks
- 6.1.4. Dairy-based Drinks
- 6.1.5. Other Product Types
- 6.2. Market Analysis, Insights and Forecast - by Distribution Channel
- 6.2.1. Supermarket/Hypermarket
- 6.2.2. Pharmacies and Health Stores
- 6.2.3. Convenience Stores
- 6.2.4. Online Retail Stores
- 6.2.5. Other Distribution Channels
- 6.3. Market Analysis, Insights and Forecast - by Geography
- 6.3.1. South Africa
- 6.3.2. Saudi Arabia
- 6.3.3. Rest of Middle-East and Africa
- 6.1. Market Analysis, Insights and Forecast - by Product Type
- 7. Saudi Arabia MEA Functional Beverages Industry Analysis, Insights and Forecast, 2020-2032
- 7.1. Market Analysis, Insights and Forecast - by Product Type
- 7.1.1. Energy Drinks
- 7.1.2. Fortified Juice
- 7.1.3. Sports Drinks
- 7.1.4. Dairy-based Drinks
- 7.1.5. Other Product Types
- 7.2. Market Analysis, Insights and Forecast - by Distribution Channel
- 7.2.1. Supermarket/Hypermarket
- 7.2.2. Pharmacies and Health Stores
- 7.2.3. Convenience Stores
- 7.2.4. Online Retail Stores
- 7.2.5. Other Distribution Channels
- 7.3. Market Analysis, Insights and Forecast - by Geography
- 7.3.1. South Africa
- 7.3.2. Saudi Arabia
- 7.3.3. Rest of Middle-East and Africa
- 7.1. Market Analysis, Insights and Forecast - by Product Type
- 8. Rest of Middle East and Africa MEA Functional Beverages Industry Analysis, Insights and Forecast, 2020-2032
- 8.1. Market Analysis, Insights and Forecast - by Product Type
- 8.1.1. Energy Drinks
- 8.1.2. Fortified Juice
- 8.1.3. Sports Drinks
- 8.1.4. Dairy-based Drinks
- 8.1.5. Other Product Types
- 8.2. Market Analysis, Insights and Forecast - by Distribution Channel
- 8.2.1. Supermarket/Hypermarket
- 8.2.2. Pharmacies and Health Stores
- 8.2.3. Convenience Stores
- 8.2.4. Online Retail Stores
- 8.2.5. Other Distribution Channels
- 8.3. Market Analysis, Insights and Forecast - by Geography
- 8.3.1. South Africa
- 8.3.2. Saudi Arabia
- 8.3.3. Rest of Middle-East and Africa
- 8.1. Market Analysis, Insights and Forecast - by Product Type
- 9. Competitive Analysis
- 9.1. Global Market Share Analysis 2025
- 9.2. Company Profiles
- 9.2.1 Nestle SA
- 9.2.1.1. Overview
- 9.2.1.2. Products
- 9.2.1.3. SWOT Analysis
- 9.2.1.4. Recent Developments
- 9.2.1.5. Financials (Based on Availability)
- 9.2.2 Herbalife International of America Inc
- 9.2.2.1. Overview
- 9.2.2.2. Products
- 9.2.2.3. SWOT Analysis
- 9.2.2.4. Recent Developments
- 9.2.2.5. Financials (Based on Availability)
- 9.2.3 Sapporo Holdings
- 9.2.3.1. Overview
- 9.2.3.2. Products
- 9.2.3.3. SWOT Analysis
- 9.2.3.4. Recent Developments
- 9.2.3.5. Financials (Based on Availability)
- 9.2.4 Mutalo Group
- 9.2.4.1. Overview
- 9.2.4.2. Products
- 9.2.4.3. SWOT Analysis
- 9.2.4.4. Recent Developments
- 9.2.4.5. Financials (Based on Availability)
- 9.2.5 Monster Beverage Corporation
- 9.2.5.1. Overview
- 9.2.5.2. Products
- 9.2.5.3. SWOT Analysis
- 9.2.5.4. Recent Developments
- 9.2.5.5. Financials (Based on Availability)
- 9.2.6 PepsiCo Inc
- 9.2.6.1. Overview
- 9.2.6.2. Products
- 9.2.6.3. SWOT Analysis
- 9.2.6.4. Recent Developments
- 9.2.6.5. Financials (Based on Availability)
- 9.2.7 Dr Pepper Snapple
- 9.2.7.1. Overview
- 9.2.7.2. Products
- 9.2.7.3. SWOT Analysis
- 9.2.7.4. Recent Developments
- 9.2.7.5. Financials (Based on Availability)
- 9.2.8 Viju Industries Nigeria Ltd
- 9.2.8.1. Overview
- 9.2.8.2. Products
- 9.2.8.3. SWOT Analysis
- 9.2.8.4. Recent Developments
- 9.2.8.5. Financials (Based on Availability)
- 9.2.9 iPRO Sport Distribution Limited*List Not Exhaustive
- 9.2.9.1. Overview
- 9.2.9.2. Products
- 9.2.9.3. SWOT Analysis
- 9.2.9.4. Recent Developments
- 9.2.9.5. Financials (Based on Availability)
- 9.2.10 Red Bull GmbH
- 9.2.10.1. Overview
- 9.2.10.2. Products
- 9.2.10.3. SWOT Analysis
- 9.2.10.4. Recent Developments
- 9.2.10.5. Financials (Based on Availability)
- 9.2.11 The Coca-Cola Company
- 9.2.11.1. Overview
- 9.2.11.2. Products
- 9.2.11.3. SWOT Analysis
- 9.2.11.4. Recent Developments
- 9.2.11.5. Financials (Based on Availability)
- 9.2.1 Nestle SA
List of Figures
- Figure 1: Global MEA Functional Beverages Industry Revenue Breakdown (billion, %) by Region 2025 & 2033
- Figure 2: South Africa MEA Functional Beverages Industry Revenue (billion), by Product Type 2025 & 2033
- Figure 3: South Africa MEA Functional Beverages Industry Revenue Share (%), by Product Type 2025 & 2033
- Figure 4: South Africa MEA Functional Beverages Industry Revenue (billion), by Distribution Channel 2025 & 2033
- Figure 5: South Africa MEA Functional Beverages Industry Revenue Share (%), by Distribution Channel 2025 & 2033
- Figure 6: South Africa MEA Functional Beverages Industry Revenue (billion), by Geography 2025 & 2033
- Figure 7: South Africa MEA Functional Beverages Industry Revenue Share (%), by Geography 2025 & 2033
- Figure 8: South Africa MEA Functional Beverages Industry Revenue (billion), by Country 2025 & 2033
- Figure 9: South Africa MEA Functional Beverages Industry Revenue Share (%), by Country 2025 & 2033
- Figure 10: Saudi Arabia MEA Functional Beverages Industry Revenue (billion), by Product Type 2025 & 2033
- Figure 11: Saudi Arabia MEA Functional Beverages Industry Revenue Share (%), by Product Type 2025 & 2033
- Figure 12: Saudi Arabia MEA Functional Beverages Industry Revenue (billion), by Distribution Channel 2025 & 2033
- Figure 13: Saudi Arabia MEA Functional Beverages Industry Revenue Share (%), by Distribution Channel 2025 & 2033
- Figure 14: Saudi Arabia MEA Functional Beverages Industry Revenue (billion), by Geography 2025 & 2033
- Figure 15: Saudi Arabia MEA Functional Beverages Industry Revenue Share (%), by Geography 2025 & 2033
- Figure 16: Saudi Arabia MEA Functional Beverages Industry Revenue (billion), by Country 2025 & 2033
- Figure 17: Saudi Arabia MEA Functional Beverages Industry Revenue Share (%), by Country 2025 & 2033
- Figure 18: Rest of Middle East and Africa MEA Functional Beverages Industry Revenue (billion), by Product Type 2025 & 2033
- Figure 19: Rest of Middle East and Africa MEA Functional Beverages Industry Revenue Share (%), by Product Type 2025 & 2033
- Figure 20: Rest of Middle East and Africa MEA Functional Beverages Industry Revenue (billion), by Distribution Channel 2025 & 2033
- Figure 21: Rest of Middle East and Africa MEA Functional Beverages Industry Revenue Share (%), by Distribution Channel 2025 & 2033
- Figure 22: Rest of Middle East and Africa MEA Functional Beverages Industry Revenue (billion), by Geography 2025 & 2033
- Figure 23: Rest of Middle East and Africa MEA Functional Beverages Industry Revenue Share (%), by Geography 2025 & 2033
- Figure 24: Rest of Middle East and Africa MEA Functional Beverages Industry Revenue (billion), by Country 2025 & 2033
- Figure 25: Rest of Middle East and Africa MEA Functional Beverages Industry Revenue Share (%), by Country 2025 & 2033
List of Tables
- Table 1: Global MEA Functional Beverages Industry Revenue billion Forecast, by Product Type 2020 & 2033
- Table 2: Global MEA Functional Beverages Industry Revenue billion Forecast, by Distribution Channel 2020 & 2033
- Table 3: Global MEA Functional Beverages Industry Revenue billion Forecast, by Geography 2020 & 2033
- Table 4: Global MEA Functional Beverages Industry Revenue billion Forecast, by Region 2020 & 2033
- Table 5: Global MEA Functional Beverages Industry Revenue billion Forecast, by Product Type 2020 & 2033
- Table 6: Global MEA Functional Beverages Industry Revenue billion Forecast, by Distribution Channel 2020 & 2033
- Table 7: Global MEA Functional Beverages Industry Revenue billion Forecast, by Geography 2020 & 2033
- Table 8: Global MEA Functional Beverages Industry Revenue billion Forecast, by Country 2020 & 2033
- Table 9: Global MEA Functional Beverages Industry Revenue billion Forecast, by Product Type 2020 & 2033
- Table 10: Global MEA Functional Beverages Industry Revenue billion Forecast, by Distribution Channel 2020 & 2033
- Table 11: Global MEA Functional Beverages Industry Revenue billion Forecast, by Geography 2020 & 2033
- Table 12: Global MEA Functional Beverages Industry Revenue billion Forecast, by Country 2020 & 2033
- Table 13: Global MEA Functional Beverages Industry Revenue billion Forecast, by Product Type 2020 & 2033
- Table 14: Global MEA Functional Beverages Industry Revenue billion Forecast, by Distribution Channel 2020 & 2033
- Table 15: Global MEA Functional Beverages Industry Revenue billion Forecast, by Geography 2020 & 2033
- Table 16: Global MEA Functional Beverages Industry Revenue billion Forecast, by Country 2020 & 2033
Frequently Asked Questions
1. What is the projected Compound Annual Growth Rate (CAGR) of the MEA Functional Beverages Industry?
The projected CAGR is approximately 5.6%.
2. Which companies are prominent players in the MEA Functional Beverages Industry?
Key companies in the market include Nestle SA, Herbalife International of America Inc, Sapporo Holdings, Mutalo Group, Monster Beverage Corporation, PepsiCo Inc, Dr Pepper Snapple, Viju Industries Nigeria Ltd, iPRO Sport Distribution Limited*List Not Exhaustive, Red Bull GmbH, The Coca-Cola Company.
3. What are the main segments of the MEA Functional Beverages Industry?
The market segments include Product Type, Distribution Channel, Geography.
4. Can you provide details about the market size?
The market size is estimated to be USD 171.86 billion as of 2022.
5. What are some drivers contributing to market growth?
Preference for Plant-based and Clean-label RTD Products; Consumer Inclination Toward Sugar-Free Drinks.
6. What are the notable trends driving market growth?
Growing Demand for Plant-based and Lactose-free Products.
7. Are there any restraints impacting market growth?
Concerns Over Health Issues Associated With Beverages.
8. Can you provide examples of recent developments in the market?
October 2022: iPRO launched a range of sports drinks in Carrefour stores across the United Arab Emirates. The company claims that it contains 100% of the daily recommended vitamin C intake, along with added B vitamins.
9. What pricing options are available for accessing the report?
Pricing options include single-user, multi-user, and enterprise licenses priced at USD 4750, USD 5250, and USD 8750 respectively.
10. Is the market size provided in terms of value or volume?
The market size is provided in terms of value, measured in billion.
11. Are there any specific market keywords associated with the report?
Yes, the market keyword associated with the report is "MEA Functional Beverages Industry," which aids in identifying and referencing the specific market segment covered.
12. How do I determine which pricing option suits my needs best?
The pricing options vary based on user requirements and access needs. Individual users may opt for single-user licenses, while businesses requiring broader access may choose multi-user or enterprise licenses for cost-effective access to the report.
13. Are there any additional resources or data provided in the MEA Functional Beverages Industry report?
While the report offers comprehensive insights, it's advisable to review the specific contents or supplementary materials provided to ascertain if additional resources or data are available.
14. How can I stay updated on further developments or reports in the MEA Functional Beverages Industry?
To stay informed about further developments, trends, and reports in the MEA Functional Beverages Industry, consider subscribing to industry newsletters, following relevant companies and organizations, or regularly checking reputable industry news sources and publications.
Methodology
Step 1 - Identification of Relevant Samples Size from Population Database


Step 2 - Approaches for Defining Global Market Size (Value, Volume* & Price*)

Note*: In applicable scenarios
Step 3 - Data Sources
Primary Research
- Web Analytics
- Survey Reports
- Research Institute
- Latest Research Reports
- Opinion Leaders
Secondary Research
- Annual Reports
- White Paper
- Latest Press Release
- Industry Association
- Paid Database
- Investor Presentations

Step 4 - Data Triangulation
Involves using different sources of information in order to increase the validity of a study
These sources are likely to be stakeholders in a program - participants, other researchers, program staff, other community members, and so on.
Then we put all data in single framework & apply various statistical tools to find out the dynamic on the market.
During the analysis stage, feedback from the stakeholder groups would be compared to determine areas of agreement as well as areas of divergence