Key Insights
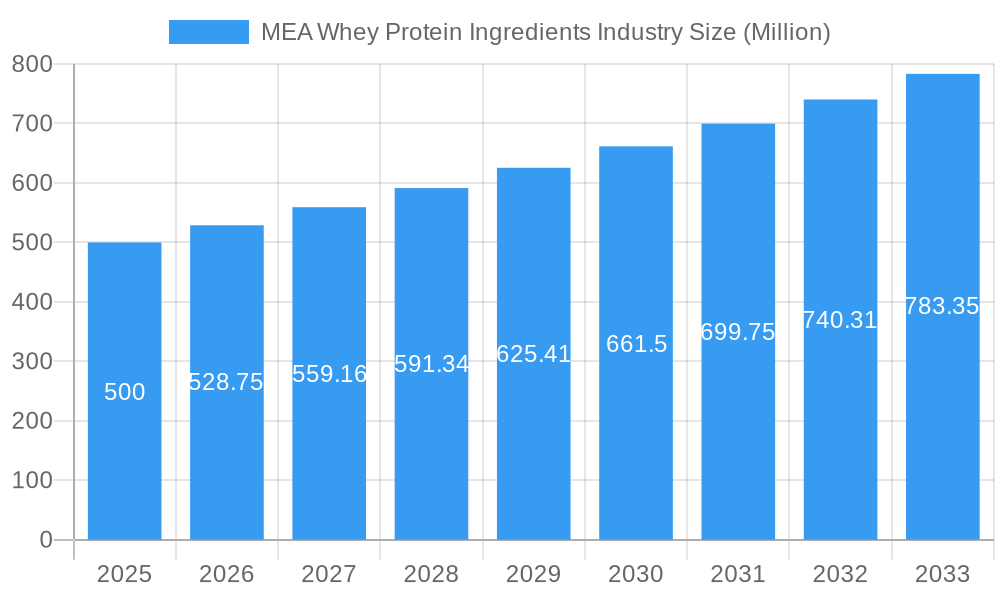
The Middle East and Africa (MEA) whey protein ingredients market, valued at $500 million in 2025, is projected to experience robust growth, driven by a Compound Annual Growth Rate (CAGR) of 5.75% from 2025 to 2033. This expansion is fueled by several key factors. The rising health consciousness across the region, coupled with increasing participation in sports and fitness activities, is boosting demand for whey protein supplements. The burgeoning sports nutrition sector, particularly in countries like South Africa, Saudi Arabia, and the UAE, is a significant driver. Furthermore, the growing adoption of whey protein in functional foods and infant formula contributes to market growth. Increased disposable incomes and a shift towards healthier lifestyles are further contributing to market expansion. While challenges such as fluctuating raw material prices and potential regulatory hurdles exist, the overall market outlook remains positive. The diverse applications of whey protein, ranging from sports nutrition to food fortification, position the MEA region for sustained growth in the coming years.
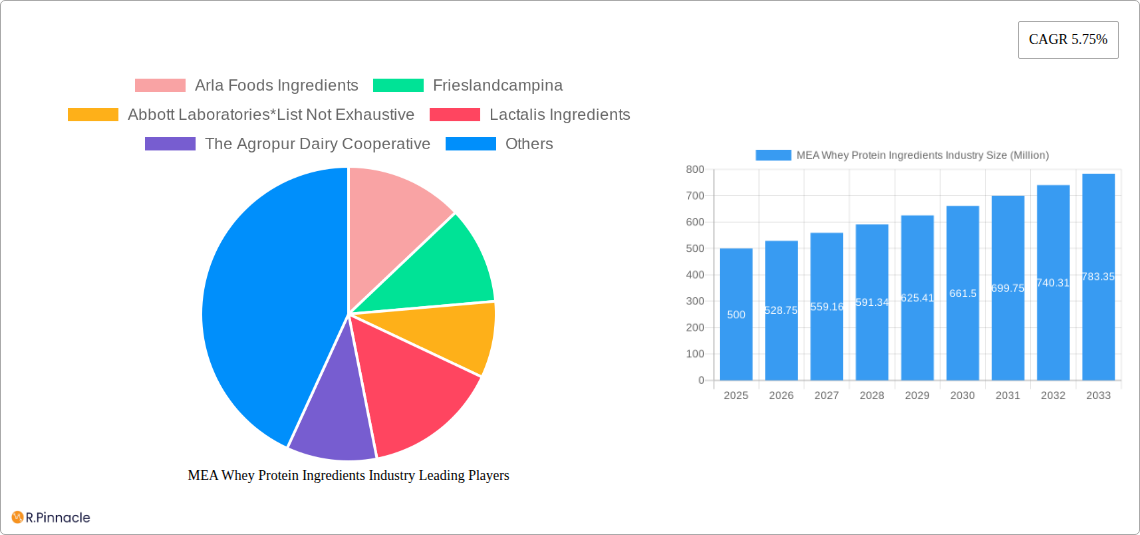
MEA Whey Protein Ingredients Industry Market Size (In Million)
The market segmentation reveals strong growth potential within specific product types and applications. Whey protein isolate, owing to its higher protein content and purity, is likely to witness significant demand, while the sports and performance nutrition segment continues to dominate applications. Geographic analysis indicates that South Africa, Saudi Arabia, and the UAE represent major market hubs, driven by high consumer spending and established distribution networks. Key players, including Arla Foods Ingredients, FrieslandCampina, and Abbott Laboratories, are actively investing in capacity expansion and product innovation to meet increasing consumer demand and capitalize on the market's growth trajectory. This competitive landscape fosters innovation and ensures the availability of high-quality whey protein ingredients throughout the MEA region. Future growth will hinge on leveraging technological advancements to enhance product quality and exploring novel applications to cater to evolving consumer preferences.
MEA Whey Protein Ingredients Industry Company Market Share
MEA Whey Protein Ingredients Industry: A Comprehensive Market Report (2019-2033)
This in-depth report provides a comprehensive analysis of the Middle East and Africa (MEA) whey protein ingredients industry, offering invaluable insights for industry professionals, investors, and strategic decision-makers. The report covers the period 2019-2033, with a focus on the 2025 market, and leverages extensive data analysis to forecast market trends and growth opportunities. The MEA whey protein ingredients market is expected to witness significant growth, driven by increasing health consciousness, rising demand for sports nutrition, and expanding food processing industries. This report meticulously analyzes market dynamics, competitive landscapes, and key growth drivers to provide actionable strategies for success in this lucrative market.
MEA Whey Protein Ingredients Industry Market Structure & Innovation Trends
The MEA whey protein ingredients market exhibits a moderately consolidated structure, with several key players holding significant market share. Leading companies include Arla Foods Ingredients, FrieslandCampina, Abbott Laboratories, Lactalis Ingredients, The Agropur Dairy Cooperative, Erie Foods International Inc, Fonterra Co-operative Group Limited, Carbery Group, Glanbia Nutritionals, and Ingredients Solutions Inc. However, the market also accommodates several smaller regional players. Market share distribution varies across product types and applications. Innovation is driven by the demand for enhanced functionality, improved taste and texture, and the development of specialized whey protein products targeting specific consumer needs. Regulatory frameworks focused on food safety and labeling compliance influence market activities. Product substitutes, such as soy protein and pea protein, exert competitive pressure, while mergers and acquisitions (M&A) activity contribute to market consolidation. The estimated total M&A deal value in the historical period (2019-2024) was approximately $xx Million, with an average deal size of $xx Million. Future M&A activity is projected to remain significant, driven by companies seeking expansion and diversification.
MEA Whey Protein Ingredients Industry Market Dynamics & Trends
The MEA whey protein ingredients market is experiencing robust growth, driven by several key factors. The rising prevalence of health and wellness trends, particularly among the growing middle class, fuels demand for protein-rich food and beverages. This is further supported by the burgeoning sports and fitness culture across the region. The CAGR for the MEA whey protein ingredients market during the forecast period (2025-2033) is estimated at xx%. Technological advancements in whey protein processing and formulation, leading to improved product quality and functionality, are also key drivers. Consumer preferences are shifting towards more convenient, natural, and functional products, creating opportunities for manufacturers to introduce innovative products tailored to specific dietary needs and lifestyle preferences. Intense competition among major players is driving product innovation and aggressive marketing strategies. Market penetration of whey protein in functional foods and beverages remains relatively low compared to developed markets, signifying ample growth potential.
Dominant Regions & Segments in MEA Whey Protein Ingredients Industry
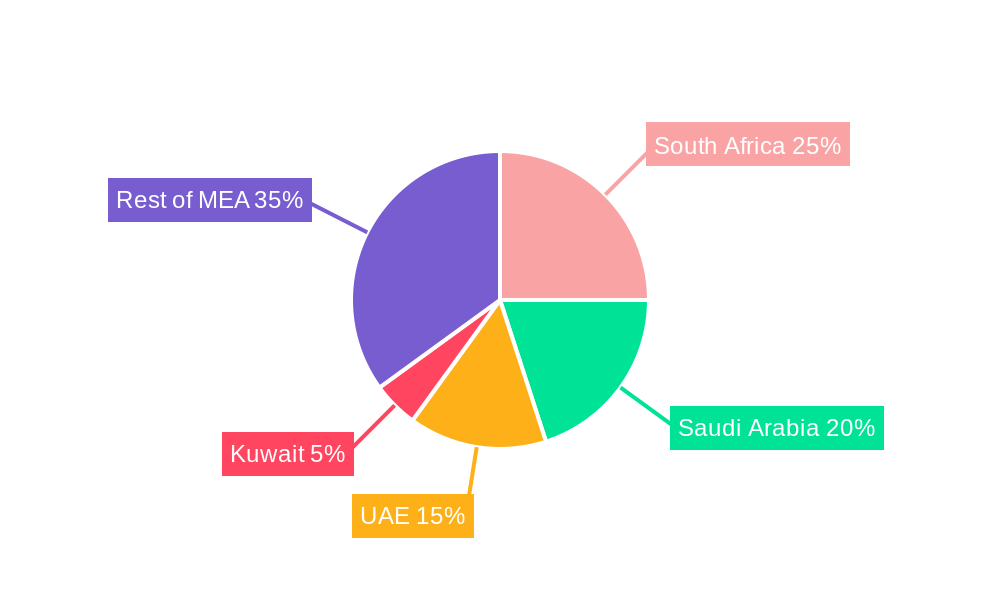
- By Country: The UAE and Saudi Arabia are the dominant markets within the MEA region, fueled by their larger populations, higher disposable incomes, and robust retail infrastructure. South Africa also holds a significant position due to its established food processing industry. Kuwait represents a smaller but rapidly growing market.
- By Product Type: Whey protein concentrate holds the largest market share due to its cost-effectiveness. However, the demand for whey protein isolate and hydrolyzed whey protein is growing rapidly due to their superior functional properties and benefits.
- By Application: The sports and performance nutrition sector is the major application segment for whey protein, driven by increasing participation in fitness activities and a heightened awareness of the importance of protein in athletic performance. The infant formula sector shows steady growth, driven by the expanding population and rising awareness of the nutritional benefits of whey protein. Functional/fortified foods are becoming increasingly popular, indicating a growing demand for whey protein as a functional ingredient. Other applications, including bakery and confectionery, also represent significant market opportunities.
Key drivers for growth in these dominant regions and segments include favorable economic policies promoting food processing and manufacturing, growing investments in health and wellness infrastructure, and increased government support for the food and beverage sector.
MEA Whey Protein Ingredients Industry Product Innovations
Recent innovations focus on enhancing product functionality and addressing specific consumer preferences. This includes the development of whey protein hydrolysates with enhanced digestibility and absorption rates, the creation of clean-label products with minimal processing, and the introduction of whey protein blends tailored to specific dietary requirements (e.g., lactose-free, organic). Technological advancements in processing techniques such as microfiltration and ultrafiltration are leading to improved product quality and yield. The successful market fit of these innovations depends on factors such as product efficacy, convenience, and affordability, alongside effective marketing and consumer education.
Report Scope & Segmentation Analysis
This report segments the MEA whey protein ingredients market by product type (whey protein concentrate, whey protein isolate, hydrolyzed whey protein), application (sports and performance nutrition, infant formula, functional/fortified food, other applications), and country (South Africa, Saudi Arabia, UAE, Kuwait, Rest of MEA). Each segment's growth projections are based on detailed market size estimations and analyses of competitive dynamics within each segment. Market sizes vary significantly across segments. For instance, the whey protein concentrate segment currently holds the largest market share by volume, while the whey protein isolate segment exhibits the highest growth rate. The infant formula and sports nutrition segments are the leading application areas. South Africa, Saudi Arabia, and the UAE represent the largest national markets, showing distinct growth trajectories based on their specific economic conditions and consumer preferences.
Key Drivers of MEA Whey Protein Ingredients Industry Growth
Several factors are driving the growth of the MEA whey protein ingredients market. Firstly, the region's burgeoning population and rising disposable incomes are significantly increasing consumer spending on health and wellness products. Secondly, government initiatives and investments in infrastructure supporting the food processing industry are fueling the market expansion. Thirdly, technological advancements in whey protein processing and formulation are enabling manufacturers to produce high-quality, functional products with improved sensory characteristics. Lastly, the increasing awareness of the nutritional benefits of whey protein among consumers is driving greater demand.
Challenges in the MEA Whey Protein Ingredients Industry Sector
Despite the significant growth potential, the MEA whey protein ingredients industry faces various challenges. Fluctuations in raw material prices, coupled with potential supply chain disruptions, create pricing volatility and impact production costs. Strict regulatory frameworks pertaining to food safety and labeling can pose compliance hurdles for manufacturers. Intense competition among both established global players and emerging regional brands puts pressure on pricing strategies and profit margins. These factors collectively impact market growth and require strategic adaptation from industry participants. For example, the impact of inconsistent raw material supply can lead to a production shortfall of approximately xx Million units annually.
Emerging Opportunities in MEA Whey Protein Ingredients Industry
Several emerging opportunities exist within the MEA whey protein ingredients market. The growing demand for specialized whey protein products catering to specific dietary needs (e.g., vegan, organic) presents a significant opportunity for innovation. The rise of e-commerce channels is creating new avenues for product distribution and market penetration. The increasing adoption of functional ingredients within food and beverage products offers significant potential for incorporating whey protein into innovative formulations. Furthermore, exploring untapped markets within the region holds significant growth prospects.
Leading Players in the MEA Whey Protein Ingredients Industry Market
- Arla Foods Ingredients (Arla Foods Ingredients)
- FrieslandCampina (FrieslandCampina)
- Abbott Laboratories (Abbott Laboratories)
- Lactalis Ingredients
- The Agropur Dairy Cooperative
- Erie Foods International Inc
- Fonterra Co-operative Group Limited
- Carbery Group
- Glanbia Nutritionals
- Ingredients Solutions Inc.
Key Developments in MEA Whey Protein Ingredients Industry
- 2021 (October): Arla Foods Ingredients expands its whey protein production capacity in Saudi Arabia. This significantly boosts their production capabilities to meet the increasing demand in the region.
- 2022 (May): FrieslandCampina acquires a minority stake in a whey protein concentrate and isolate manufacturing plant in Egypt. This strategic move strengthens their presence in a key growth market within MEA.
- 2023 (March): Lactalis Ingredients invests in a new whey protein production line in South Africa. This expansion increases the production capacity and strengthens their market position.
Future Outlook for MEA Whey Protein Ingredients Industry Market
The MEA whey protein ingredients market is poised for substantial growth, propelled by a confluence of factors including rising health consciousness, expanding food and beverage sector, and favorable demographic trends. Strategic partnerships, technological innovations, and aggressive marketing strategies are crucial for capitalizing on the considerable market potential. The focus on product differentiation, addressing specific consumer needs, and efficient supply chain management will be key determinants of success in this dynamic market. The market is projected to reach approximately $xx Million by 2033, showcasing significant growth opportunities for investors and industry participants.
MEA Whey Protein Ingredients Industry Segmentation
-
1. Product Type
- 1.1. Whey Protein Concentrate
- 1.2. Whey Protein Isolate
- 1.3. Hydrolyzed Whey Protein
-
2. Application
- 2.1. Sports and Performance Nutrition
- 2.2. Infant Formula
- 2.3. Functional/Fortified Food
- 2.4. Other Applications
MEA Whey Protein Ingredients Industry Segmentation By Geography
-
1. North America
- 1.1. United States
- 1.2. Canada
- 1.3. Mexico
-
2. South America
- 2.1. Brazil
- 2.2. Argentina
- 2.3. Rest of South America
-
3. Europe
- 3.1. United Kingdom
- 3.2. Germany
- 3.3. France
- 3.4. Italy
- 3.5. Spain
- 3.6. Russia
- 3.7. Benelux
- 3.8. Nordics
- 3.9. Rest of Europe
-
4. Middle East & Africa
- 4.1. Turkey
- 4.2. Israel
- 4.3. GCC
- 4.4. North Africa
- 4.5. South Africa
- 4.6. Rest of Middle East & Africa
-
5. Asia Pacific
- 5.1. China
- 5.2. India
- 5.3. Japan
- 5.4. South Korea
- 5.5. ASEAN
- 5.6. Oceania
- 5.7. Rest of Asia Pacific
MEA Whey Protein Ingredients Industry Regional Market Share
Geographic Coverage of MEA Whey Protein Ingredients Industry
MEA Whey Protein Ingredients Industry REPORT HIGHLIGHTS
| Aspects | Details |
|---|---|
| Study Period | 2020-2034 |
| Base Year | 2025 |
| Estimated Year | 2026 |
| Forecast Period | 2026-2034 |
| Historical Period | 2020-2025 |
| Growth Rate | CAGR of 5.75% from 2020-2034 |
| Segmentation |
|
Table of Contents
- 1. Introduction
- 1.1. Research Scope
- 1.2. Market Segmentation
- 1.3. Research Methodology
- 1.4. Definitions and Assumptions
- 2. Executive Summary
- 2.1. Introduction
- 3. Market Dynamics
- 3.1. Introduction
- 3.2. Market Drivers
- 3.2.1. Increasing demand for sports nutritional supplements
- 3.3. Market Restrains
- 3.3.1. Rising demand for plant-based protein
- 3.4. Market Trends
- 3.4.1. Increasing Health and Fitness Club Memberships In The Region
- 4. Market Factor Analysis
- 4.1. Porters Five Forces
- 4.2. Supply/Value Chain
- 4.3. PESTEL analysis
- 4.4. Market Entropy
- 4.5. Patent/Trademark Analysis
- 5. Global MEA Whey Protein Ingredients Industry Analysis, Insights and Forecast, 2020-2032
- 5.1. Market Analysis, Insights and Forecast - by Product Type
- 5.1.1. Whey Protein Concentrate
- 5.1.2. Whey Protein Isolate
- 5.1.3. Hydrolyzed Whey Protein
- 5.2. Market Analysis, Insights and Forecast - by Application
- 5.2.1. Sports and Performance Nutrition
- 5.2.2. Infant Formula
- 5.2.3. Functional/Fortified Food
- 5.2.4. Other Applications
- 5.3. Market Analysis, Insights and Forecast - by Region
- 5.3.1. North America
- 5.3.2. South America
- 5.3.3. Europe
- 5.3.4. Middle East & Africa
- 5.3.5. Asia Pacific
- 5.1. Market Analysis, Insights and Forecast - by Product Type
- 6. North America MEA Whey Protein Ingredients Industry Analysis, Insights and Forecast, 2020-2032
- 6.1. Market Analysis, Insights and Forecast - by Product Type
- 6.1.1. Whey Protein Concentrate
- 6.1.2. Whey Protein Isolate
- 6.1.3. Hydrolyzed Whey Protein
- 6.2. Market Analysis, Insights and Forecast - by Application
- 6.2.1. Sports and Performance Nutrition
- 6.2.2. Infant Formula
- 6.2.3. Functional/Fortified Food
- 6.2.4. Other Applications
- 6.1. Market Analysis, Insights and Forecast - by Product Type
- 7. South America MEA Whey Protein Ingredients Industry Analysis, Insights and Forecast, 2020-2032
- 7.1. Market Analysis, Insights and Forecast - by Product Type
- 7.1.1. Whey Protein Concentrate
- 7.1.2. Whey Protein Isolate
- 7.1.3. Hydrolyzed Whey Protein
- 7.2. Market Analysis, Insights and Forecast - by Application
- 7.2.1. Sports and Performance Nutrition
- 7.2.2. Infant Formula
- 7.2.3. Functional/Fortified Food
- 7.2.4. Other Applications
- 7.1. Market Analysis, Insights and Forecast - by Product Type
- 8. Europe MEA Whey Protein Ingredients Industry Analysis, Insights and Forecast, 2020-2032
- 8.1. Market Analysis, Insights and Forecast - by Product Type
- 8.1.1. Whey Protein Concentrate
- 8.1.2. Whey Protein Isolate
- 8.1.3. Hydrolyzed Whey Protein
- 8.2. Market Analysis, Insights and Forecast - by Application
- 8.2.1. Sports and Performance Nutrition
- 8.2.2. Infant Formula
- 8.2.3. Functional/Fortified Food
- 8.2.4. Other Applications
- 8.1. Market Analysis, Insights and Forecast - by Product Type
- 9. Middle East & Africa MEA Whey Protein Ingredients Industry Analysis, Insights and Forecast, 2020-2032
- 9.1. Market Analysis, Insights and Forecast - by Product Type
- 9.1.1. Whey Protein Concentrate
- 9.1.2. Whey Protein Isolate
- 9.1.3. Hydrolyzed Whey Protein
- 9.2. Market Analysis, Insights and Forecast - by Application
- 9.2.1. Sports and Performance Nutrition
- 9.2.2. Infant Formula
- 9.2.3. Functional/Fortified Food
- 9.2.4. Other Applications
- 9.1. Market Analysis, Insights and Forecast - by Product Type
- 10. Asia Pacific MEA Whey Protein Ingredients Industry Analysis, Insights and Forecast, 2020-2032
- 10.1. Market Analysis, Insights and Forecast - by Product Type
- 10.1.1. Whey Protein Concentrate
- 10.1.2. Whey Protein Isolate
- 10.1.3. Hydrolyzed Whey Protein
- 10.2. Market Analysis, Insights and Forecast - by Application
- 10.2.1. Sports and Performance Nutrition
- 10.2.2. Infant Formula
- 10.2.3. Functional/Fortified Food
- 10.2.4. Other Applications
- 10.1. Market Analysis, Insights and Forecast - by Product Type
- 11. Competitive Analysis
- 11.1. Global Market Share Analysis 2025
- 11.2. Company Profiles
- 11.2.1 Arla Foods Ingredients
- 11.2.1.1. Overview
- 11.2.1.2. Products
- 11.2.1.3. SWOT Analysis
- 11.2.1.4. Recent Developments
- 11.2.1.5. Financials (Based on Availability)
- 11.2.2 Frieslandcampina
- 11.2.2.1. Overview
- 11.2.2.2. Products
- 11.2.2.3. SWOT Analysis
- 11.2.2.4. Recent Developments
- 11.2.2.5. Financials (Based on Availability)
- 11.2.3 Abbott Laboratories*List Not Exhaustive
- 11.2.3.1. Overview
- 11.2.3.2. Products
- 11.2.3.3. SWOT Analysis
- 11.2.3.4. Recent Developments
- 11.2.3.5. Financials (Based on Availability)
- 11.2.4 Lactalis Ingredients
- 11.2.4.1. Overview
- 11.2.4.2. Products
- 11.2.4.3. SWOT Analysis
- 11.2.4.4. Recent Developments
- 11.2.4.5. Financials (Based on Availability)
- 11.2.5 The Agropur Dairy Cooperative
- 11.2.5.1. Overview
- 11.2.5.2. Products
- 11.2.5.3. SWOT Analysis
- 11.2.5.4. Recent Developments
- 11.2.5.5. Financials (Based on Availability)
- 11.2.6 Erie Foods International Inc
- 11.2.6.1. Overview
- 11.2.6.2. Products
- 11.2.6.3. SWOT Analysis
- 11.2.6.4. Recent Developments
- 11.2.6.5. Financials (Based on Availability)
- 11.2.7 Fonterra Co-operative Group Limited
- 11.2.7.1. Overview
- 11.2.7.2. Products
- 11.2.7.3. SWOT Analysis
- 11.2.7.4. Recent Developments
- 11.2.7.5. Financials (Based on Availability)
- 11.2.8 Carbery Group
- 11.2.8.1. Overview
- 11.2.8.2. Products
- 11.2.8.3. SWOT Analysis
- 11.2.8.4. Recent Developments
- 11.2.8.5. Financials (Based on Availability)
- 11.2.9 Glanbia Nutritionals
- 11.2.9.1. Overview
- 11.2.9.2. Products
- 11.2.9.3. SWOT Analysis
- 11.2.9.4. Recent Developments
- 11.2.9.5. Financials (Based on Availability)
- 11.2.10 Ingredients Solutions Inc.
- 11.2.10.1. Overview
- 11.2.10.2. Products
- 11.2.10.3. SWOT Analysis
- 11.2.10.4. Recent Developments
- 11.2.10.5. Financials (Based on Availability)
- 11.2.1 Arla Foods Ingredients
List of Figures
- Figure 1: Global MEA Whey Protein Ingredients Industry Revenue Breakdown (Million, %) by Region 2025 & 2033
- Figure 2: Global MEA Whey Protein Ingredients Industry Volume Breakdown (K Tons, %) by Region 2025 & 2033
- Figure 3: North America MEA Whey Protein Ingredients Industry Revenue (Million), by Product Type 2025 & 2033
- Figure 4: North America MEA Whey Protein Ingredients Industry Volume (K Tons), by Product Type 2025 & 2033
- Figure 5: North America MEA Whey Protein Ingredients Industry Revenue Share (%), by Product Type 2025 & 2033
- Figure 6: North America MEA Whey Protein Ingredients Industry Volume Share (%), by Product Type 2025 & 2033
- Figure 7: North America MEA Whey Protein Ingredients Industry Revenue (Million), by Application 2025 & 2033
- Figure 8: North America MEA Whey Protein Ingredients Industry Volume (K Tons), by Application 2025 & 2033
- Figure 9: North America MEA Whey Protein Ingredients Industry Revenue Share (%), by Application 2025 & 2033
- Figure 10: North America MEA Whey Protein Ingredients Industry Volume Share (%), by Application 2025 & 2033
- Figure 11: North America MEA Whey Protein Ingredients Industry Revenue (Million), by Country 2025 & 2033
- Figure 12: North America MEA Whey Protein Ingredients Industry Volume (K Tons), by Country 2025 & 2033
- Figure 13: North America MEA Whey Protein Ingredients Industry Revenue Share (%), by Country 2025 & 2033
- Figure 14: North America MEA Whey Protein Ingredients Industry Volume Share (%), by Country 2025 & 2033
- Figure 15: South America MEA Whey Protein Ingredients Industry Revenue (Million), by Product Type 2025 & 2033
- Figure 16: South America MEA Whey Protein Ingredients Industry Volume (K Tons), by Product Type 2025 & 2033
- Figure 17: South America MEA Whey Protein Ingredients Industry Revenue Share (%), by Product Type 2025 & 2033
- Figure 18: South America MEA Whey Protein Ingredients Industry Volume Share (%), by Product Type 2025 & 2033
- Figure 19: South America MEA Whey Protein Ingredients Industry Revenue (Million), by Application 2025 & 2033
- Figure 20: South America MEA Whey Protein Ingredients Industry Volume (K Tons), by Application 2025 & 2033
- Figure 21: South America MEA Whey Protein Ingredients Industry Revenue Share (%), by Application 2025 & 2033
- Figure 22: South America MEA Whey Protein Ingredients Industry Volume Share (%), by Application 2025 & 2033
- Figure 23: South America MEA Whey Protein Ingredients Industry Revenue (Million), by Country 2025 & 2033
- Figure 24: South America MEA Whey Protein Ingredients Industry Volume (K Tons), by Country 2025 & 2033
- Figure 25: South America MEA Whey Protein Ingredients Industry Revenue Share (%), by Country 2025 & 2033
- Figure 26: South America MEA Whey Protein Ingredients Industry Volume Share (%), by Country 2025 & 2033
- Figure 27: Europe MEA Whey Protein Ingredients Industry Revenue (Million), by Product Type 2025 & 2033
- Figure 28: Europe MEA Whey Protein Ingredients Industry Volume (K Tons), by Product Type 2025 & 2033
- Figure 29: Europe MEA Whey Protein Ingredients Industry Revenue Share (%), by Product Type 2025 & 2033
- Figure 30: Europe MEA Whey Protein Ingredients Industry Volume Share (%), by Product Type 2025 & 2033
- Figure 31: Europe MEA Whey Protein Ingredients Industry Revenue (Million), by Application 2025 & 2033
- Figure 32: Europe MEA Whey Protein Ingredients Industry Volume (K Tons), by Application 2025 & 2033
- Figure 33: Europe MEA Whey Protein Ingredients Industry Revenue Share (%), by Application 2025 & 2033
- Figure 34: Europe MEA Whey Protein Ingredients Industry Volume Share (%), by Application 2025 & 2033
- Figure 35: Europe MEA Whey Protein Ingredients Industry Revenue (Million), by Country 2025 & 2033
- Figure 36: Europe MEA Whey Protein Ingredients Industry Volume (K Tons), by Country 2025 & 2033
- Figure 37: Europe MEA Whey Protein Ingredients Industry Revenue Share (%), by Country 2025 & 2033
- Figure 38: Europe MEA Whey Protein Ingredients Industry Volume Share (%), by Country 2025 & 2033
- Figure 39: Middle East & Africa MEA Whey Protein Ingredients Industry Revenue (Million), by Product Type 2025 & 2033
- Figure 40: Middle East & Africa MEA Whey Protein Ingredients Industry Volume (K Tons), by Product Type 2025 & 2033
- Figure 41: Middle East & Africa MEA Whey Protein Ingredients Industry Revenue Share (%), by Product Type 2025 & 2033
- Figure 42: Middle East & Africa MEA Whey Protein Ingredients Industry Volume Share (%), by Product Type 2025 & 2033
- Figure 43: Middle East & Africa MEA Whey Protein Ingredients Industry Revenue (Million), by Application 2025 & 2033
- Figure 44: Middle East & Africa MEA Whey Protein Ingredients Industry Volume (K Tons), by Application 2025 & 2033
- Figure 45: Middle East & Africa MEA Whey Protein Ingredients Industry Revenue Share (%), by Application 2025 & 2033
- Figure 46: Middle East & Africa MEA Whey Protein Ingredients Industry Volume Share (%), by Application 2025 & 2033
- Figure 47: Middle East & Africa MEA Whey Protein Ingredients Industry Revenue (Million), by Country 2025 & 2033
- Figure 48: Middle East & Africa MEA Whey Protein Ingredients Industry Volume (K Tons), by Country 2025 & 2033
- Figure 49: Middle East & Africa MEA Whey Protein Ingredients Industry Revenue Share (%), by Country 2025 & 2033
- Figure 50: Middle East & Africa MEA Whey Protein Ingredients Industry Volume Share (%), by Country 2025 & 2033
- Figure 51: Asia Pacific MEA Whey Protein Ingredients Industry Revenue (Million), by Product Type 2025 & 2033
- Figure 52: Asia Pacific MEA Whey Protein Ingredients Industry Volume (K Tons), by Product Type 2025 & 2033
- Figure 53: Asia Pacific MEA Whey Protein Ingredients Industry Revenue Share (%), by Product Type 2025 & 2033
- Figure 54: Asia Pacific MEA Whey Protein Ingredients Industry Volume Share (%), by Product Type 2025 & 2033
- Figure 55: Asia Pacific MEA Whey Protein Ingredients Industry Revenue (Million), by Application 2025 & 2033
- Figure 56: Asia Pacific MEA Whey Protein Ingredients Industry Volume (K Tons), by Application 2025 & 2033
- Figure 57: Asia Pacific MEA Whey Protein Ingredients Industry Revenue Share (%), by Application 2025 & 2033
- Figure 58: Asia Pacific MEA Whey Protein Ingredients Industry Volume Share (%), by Application 2025 & 2033
- Figure 59: Asia Pacific MEA Whey Protein Ingredients Industry Revenue (Million), by Country 2025 & 2033
- Figure 60: Asia Pacific MEA Whey Protein Ingredients Industry Volume (K Tons), by Country 2025 & 2033
- Figure 61: Asia Pacific MEA Whey Protein Ingredients Industry Revenue Share (%), by Country 2025 & 2033
- Figure 62: Asia Pacific MEA Whey Protein Ingredients Industry Volume Share (%), by Country 2025 & 2033
List of Tables
- Table 1: Global MEA Whey Protein Ingredients Industry Revenue Million Forecast, by Product Type 2020 & 2033
- Table 2: Global MEA Whey Protein Ingredients Industry Volume K Tons Forecast, by Product Type 2020 & 2033
- Table 3: Global MEA Whey Protein Ingredients Industry Revenue Million Forecast, by Application 2020 & 2033
- Table 4: Global MEA Whey Protein Ingredients Industry Volume K Tons Forecast, by Application 2020 & 2033
- Table 5: Global MEA Whey Protein Ingredients Industry Revenue Million Forecast, by Region 2020 & 2033
- Table 6: Global MEA Whey Protein Ingredients Industry Volume K Tons Forecast, by Region 2020 & 2033
- Table 7: Global MEA Whey Protein Ingredients Industry Revenue Million Forecast, by Product Type 2020 & 2033
- Table 8: Global MEA Whey Protein Ingredients Industry Volume K Tons Forecast, by Product Type 2020 & 2033
- Table 9: Global MEA Whey Protein Ingredients Industry Revenue Million Forecast, by Application 2020 & 2033
- Table 10: Global MEA Whey Protein Ingredients Industry Volume K Tons Forecast, by Application 2020 & 2033
- Table 11: Global MEA Whey Protein Ingredients Industry Revenue Million Forecast, by Country 2020 & 2033
- Table 12: Global MEA Whey Protein Ingredients Industry Volume K Tons Forecast, by Country 2020 & 2033
- Table 13: United States MEA Whey Protein Ingredients Industry Revenue (Million) Forecast, by Application 2020 & 2033
- Table 14: United States MEA Whey Protein Ingredients Industry Volume (K Tons) Forecast, by Application 2020 & 2033
- Table 15: Canada MEA Whey Protein Ingredients Industry Revenue (Million) Forecast, by Application 2020 & 2033
- Table 16: Canada MEA Whey Protein Ingredients Industry Volume (K Tons) Forecast, by Application 2020 & 2033
- Table 17: Mexico MEA Whey Protein Ingredients Industry Revenue (Million) Forecast, by Application 2020 & 2033
- Table 18: Mexico MEA Whey Protein Ingredients Industry Volume (K Tons) Forecast, by Application 2020 & 2033
- Table 19: Global MEA Whey Protein Ingredients Industry Revenue Million Forecast, by Product Type 2020 & 2033
- Table 20: Global MEA Whey Protein Ingredients Industry Volume K Tons Forecast, by Product Type 2020 & 2033
- Table 21: Global MEA Whey Protein Ingredients Industry Revenue Million Forecast, by Application 2020 & 2033
- Table 22: Global MEA Whey Protein Ingredients Industry Volume K Tons Forecast, by Application 2020 & 2033
- Table 23: Global MEA Whey Protein Ingredients Industry Revenue Million Forecast, by Country 2020 & 2033
- Table 24: Global MEA Whey Protein Ingredients Industry Volume K Tons Forecast, by Country 2020 & 2033
- Table 25: Brazil MEA Whey Protein Ingredients Industry Revenue (Million) Forecast, by Application 2020 & 2033
- Table 26: Brazil MEA Whey Protein Ingredients Industry Volume (K Tons) Forecast, by Application 2020 & 2033
- Table 27: Argentina MEA Whey Protein Ingredients Industry Revenue (Million) Forecast, by Application 2020 & 2033
- Table 28: Argentina MEA Whey Protein Ingredients Industry Volume (K Tons) Forecast, by Application 2020 & 2033
- Table 29: Rest of South America MEA Whey Protein Ingredients Industry Revenue (Million) Forecast, by Application 2020 & 2033
- Table 30: Rest of South America MEA Whey Protein Ingredients Industry Volume (K Tons) Forecast, by Application 2020 & 2033
- Table 31: Global MEA Whey Protein Ingredients Industry Revenue Million Forecast, by Product Type 2020 & 2033
- Table 32: Global MEA Whey Protein Ingredients Industry Volume K Tons Forecast, by Product Type 2020 & 2033
- Table 33: Global MEA Whey Protein Ingredients Industry Revenue Million Forecast, by Application 2020 & 2033
- Table 34: Global MEA Whey Protein Ingredients Industry Volume K Tons Forecast, by Application 2020 & 2033
- Table 35: Global MEA Whey Protein Ingredients Industry Revenue Million Forecast, by Country 2020 & 2033
- Table 36: Global MEA Whey Protein Ingredients Industry Volume K Tons Forecast, by Country 2020 & 2033
- Table 37: United Kingdom MEA Whey Protein Ingredients Industry Revenue (Million) Forecast, by Application 2020 & 2033
- Table 38: United Kingdom MEA Whey Protein Ingredients Industry Volume (K Tons) Forecast, by Application 2020 & 2033
- Table 39: Germany MEA Whey Protein Ingredients Industry Revenue (Million) Forecast, by Application 2020 & 2033
- Table 40: Germany MEA Whey Protein Ingredients Industry Volume (K Tons) Forecast, by Application 2020 & 2033
- Table 41: France MEA Whey Protein Ingredients Industry Revenue (Million) Forecast, by Application 2020 & 2033
- Table 42: France MEA Whey Protein Ingredients Industry Volume (K Tons) Forecast, by Application 2020 & 2033
- Table 43: Italy MEA Whey Protein Ingredients Industry Revenue (Million) Forecast, by Application 2020 & 2033
- Table 44: Italy MEA Whey Protein Ingredients Industry Volume (K Tons) Forecast, by Application 2020 & 2033
- Table 45: Spain MEA Whey Protein Ingredients Industry Revenue (Million) Forecast, by Application 2020 & 2033
- Table 46: Spain MEA Whey Protein Ingredients Industry Volume (K Tons) Forecast, by Application 2020 & 2033
- Table 47: Russia MEA Whey Protein Ingredients Industry Revenue (Million) Forecast, by Application 2020 & 2033
- Table 48: Russia MEA Whey Protein Ingredients Industry Volume (K Tons) Forecast, by Application 2020 & 2033
- Table 49: Benelux MEA Whey Protein Ingredients Industry Revenue (Million) Forecast, by Application 2020 & 2033
- Table 50: Benelux MEA Whey Protein Ingredients Industry Volume (K Tons) Forecast, by Application 2020 & 2033
- Table 51: Nordics MEA Whey Protein Ingredients Industry Revenue (Million) Forecast, by Application 2020 & 2033
- Table 52: Nordics MEA Whey Protein Ingredients Industry Volume (K Tons) Forecast, by Application 2020 & 2033
- Table 53: Rest of Europe MEA Whey Protein Ingredients Industry Revenue (Million) Forecast, by Application 2020 & 2033
- Table 54: Rest of Europe MEA Whey Protein Ingredients Industry Volume (K Tons) Forecast, by Application 2020 & 2033
- Table 55: Global MEA Whey Protein Ingredients Industry Revenue Million Forecast, by Product Type 2020 & 2033
- Table 56: Global MEA Whey Protein Ingredients Industry Volume K Tons Forecast, by Product Type 2020 & 2033
- Table 57: Global MEA Whey Protein Ingredients Industry Revenue Million Forecast, by Application 2020 & 2033
- Table 58: Global MEA Whey Protein Ingredients Industry Volume K Tons Forecast, by Application 2020 & 2033
- Table 59: Global MEA Whey Protein Ingredients Industry Revenue Million Forecast, by Country 2020 & 2033
- Table 60: Global MEA Whey Protein Ingredients Industry Volume K Tons Forecast, by Country 2020 & 2033
- Table 61: Turkey MEA Whey Protein Ingredients Industry Revenue (Million) Forecast, by Application 2020 & 2033
- Table 62: Turkey MEA Whey Protein Ingredients Industry Volume (K Tons) Forecast, by Application 2020 & 2033
- Table 63: Israel MEA Whey Protein Ingredients Industry Revenue (Million) Forecast, by Application 2020 & 2033
- Table 64: Israel MEA Whey Protein Ingredients Industry Volume (K Tons) Forecast, by Application 2020 & 2033
- Table 65: GCC MEA Whey Protein Ingredients Industry Revenue (Million) Forecast, by Application 2020 & 2033
- Table 66: GCC MEA Whey Protein Ingredients Industry Volume (K Tons) Forecast, by Application 2020 & 2033
- Table 67: North Africa MEA Whey Protein Ingredients Industry Revenue (Million) Forecast, by Application 2020 & 2033
- Table 68: North Africa MEA Whey Protein Ingredients Industry Volume (K Tons) Forecast, by Application 2020 & 2033
- Table 69: South Africa MEA Whey Protein Ingredients Industry Revenue (Million) Forecast, by Application 2020 & 2033
- Table 70: South Africa MEA Whey Protein Ingredients Industry Volume (K Tons) Forecast, by Application 2020 & 2033
- Table 71: Rest of Middle East & Africa MEA Whey Protein Ingredients Industry Revenue (Million) Forecast, by Application 2020 & 2033
- Table 72: Rest of Middle East & Africa MEA Whey Protein Ingredients Industry Volume (K Tons) Forecast, by Application 2020 & 2033
- Table 73: Global MEA Whey Protein Ingredients Industry Revenue Million Forecast, by Product Type 2020 & 2033
- Table 74: Global MEA Whey Protein Ingredients Industry Volume K Tons Forecast, by Product Type 2020 & 2033
- Table 75: Global MEA Whey Protein Ingredients Industry Revenue Million Forecast, by Application 2020 & 2033
- Table 76: Global MEA Whey Protein Ingredients Industry Volume K Tons Forecast, by Application 2020 & 2033
- Table 77: Global MEA Whey Protein Ingredients Industry Revenue Million Forecast, by Country 2020 & 2033
- Table 78: Global MEA Whey Protein Ingredients Industry Volume K Tons Forecast, by Country 2020 & 2033
- Table 79: China MEA Whey Protein Ingredients Industry Revenue (Million) Forecast, by Application 2020 & 2033
- Table 80: China MEA Whey Protein Ingredients Industry Volume (K Tons) Forecast, by Application 2020 & 2033
- Table 81: India MEA Whey Protein Ingredients Industry Revenue (Million) Forecast, by Application 2020 & 2033
- Table 82: India MEA Whey Protein Ingredients Industry Volume (K Tons) Forecast, by Application 2020 & 2033
- Table 83: Japan MEA Whey Protein Ingredients Industry Revenue (Million) Forecast, by Application 2020 & 2033
- Table 84: Japan MEA Whey Protein Ingredients Industry Volume (K Tons) Forecast, by Application 2020 & 2033
- Table 85: South Korea MEA Whey Protein Ingredients Industry Revenue (Million) Forecast, by Application 2020 & 2033
- Table 86: South Korea MEA Whey Protein Ingredients Industry Volume (K Tons) Forecast, by Application 2020 & 2033
- Table 87: ASEAN MEA Whey Protein Ingredients Industry Revenue (Million) Forecast, by Application 2020 & 2033
- Table 88: ASEAN MEA Whey Protein Ingredients Industry Volume (K Tons) Forecast, by Application 2020 & 2033
- Table 89: Oceania MEA Whey Protein Ingredients Industry Revenue (Million) Forecast, by Application 2020 & 2033
- Table 90: Oceania MEA Whey Protein Ingredients Industry Volume (K Tons) Forecast, by Application 2020 & 2033
- Table 91: Rest of Asia Pacific MEA Whey Protein Ingredients Industry Revenue (Million) Forecast, by Application 2020 & 2033
- Table 92: Rest of Asia Pacific MEA Whey Protein Ingredients Industry Volume (K Tons) Forecast, by Application 2020 & 2033
Frequently Asked Questions
1. What is the projected Compound Annual Growth Rate (CAGR) of the MEA Whey Protein Ingredients Industry?
The projected CAGR is approximately 5.75%.
2. Which companies are prominent players in the MEA Whey Protein Ingredients Industry?
Key companies in the market include Arla Foods Ingredients, Frieslandcampina, Abbott Laboratories*List Not Exhaustive, Lactalis Ingredients, The Agropur Dairy Cooperative, Erie Foods International Inc, Fonterra Co-operative Group Limited, Carbery Group, Glanbia Nutritionals, Ingredients Solutions Inc..
3. What are the main segments of the MEA Whey Protein Ingredients Industry?
The market segments include Product Type, Application.
4. Can you provide details about the market size?
The market size is estimated to be USD 500 Million as of 2022.
5. What are some drivers contributing to market growth?
Increasing demand for sports nutritional supplements.
6. What are the notable trends driving market growth?
Increasing Health and Fitness Club Memberships In The Region.
7. Are there any restraints impacting market growth?
Rising demand for plant-based protein.
8. Can you provide examples of recent developments in the market?
2021: Arla Foods Ingredients expands its whey protein production capacity in Saudi Arabia.
9. What pricing options are available for accessing the report?
Pricing options include single-user, multi-user, and enterprise licenses priced at USD 3800, USD 4500, and USD 5800 respectively.
10. Is the market size provided in terms of value or volume?
The market size is provided in terms of value, measured in Million and volume, measured in K Tons.
11. Are there any specific market keywords associated with the report?
Yes, the market keyword associated with the report is "MEA Whey Protein Ingredients Industry," which aids in identifying and referencing the specific market segment covered.
12. How do I determine which pricing option suits my needs best?
The pricing options vary based on user requirements and access needs. Individual users may opt for single-user licenses, while businesses requiring broader access may choose multi-user or enterprise licenses for cost-effective access to the report.
13. Are there any additional resources or data provided in the MEA Whey Protein Ingredients Industry report?
While the report offers comprehensive insights, it's advisable to review the specific contents or supplementary materials provided to ascertain if additional resources or data are available.
14. How can I stay updated on further developments or reports in the MEA Whey Protein Ingredients Industry?
To stay informed about further developments, trends, and reports in the MEA Whey Protein Ingredients Industry, consider subscribing to industry newsletters, following relevant companies and organizations, or regularly checking reputable industry news sources and publications.
Methodology
Step 1 - Identification of Relevant Samples Size from Population Database


Step 2 - Approaches for Defining Global Market Size (Value, Volume* & Price*)

Note*: In applicable scenarios
Step 3 - Data Sources
Primary Research
- Web Analytics
- Survey Reports
- Research Institute
- Latest Research Reports
- Opinion Leaders
Secondary Research
- Annual Reports
- White Paper
- Latest Press Release
- Industry Association
- Paid Database
- Investor Presentations

Step 4 - Data Triangulation
Involves using different sources of information in order to increase the validity of a study
These sources are likely to be stakeholders in a program - participants, other researchers, program staff, other community members, and so on.
Then we put all data in single framework & apply various statistical tools to find out the dynamic on the market.
During the analysis stage, feedback from the stakeholder groups would be compared to determine areas of agreement as well as areas of divergence

