

Key Insights
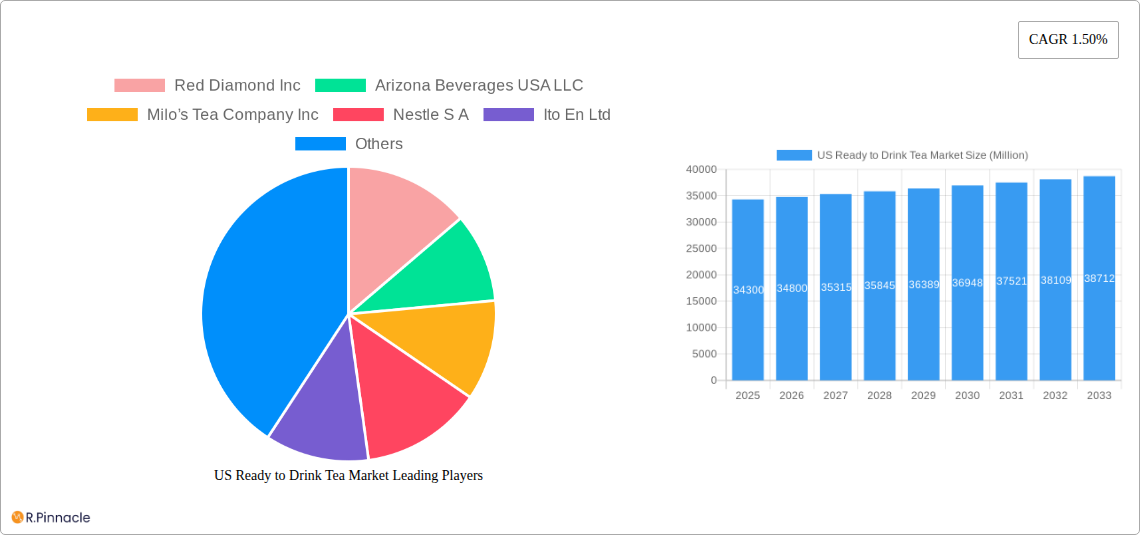
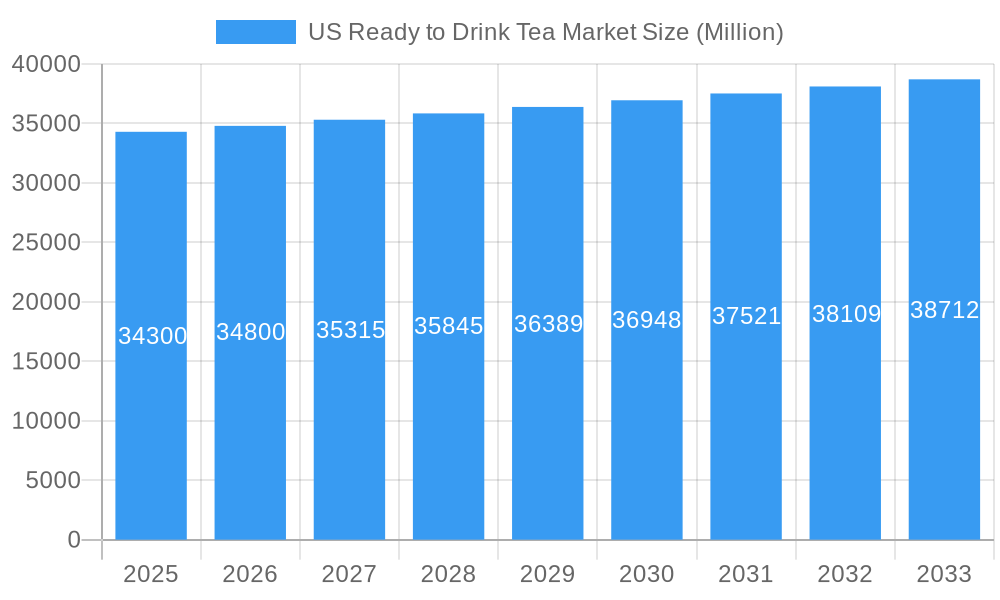
The US Ready-to-Drink (RTD) tea market, valued at $9.3 billion in 2025, is poised for sustained growth. This expansion is propelled by escalating consumer preference for convenient and health-conscious beverage choices. The market's projected Compound Annual Growth Rate (CAGR) of 2.6% from 2025 to 2033 signifies consistent market development. Key growth drivers include the burgeoning popularity of functional beverages, heightened consumer awareness of health benefits leading to a shift from sugary alternatives, and ongoing product innovation in flavors and packaging. The RTD tea sector encompasses diverse tea varieties such as green, herbal, and iced tea, offered in flexible packaging formats including PET bottles, cans, and aseptic containers to meet varied consumer needs and distribution strategies. Further market expansion is anticipated through enhanced presence in both on-trade and off-trade channels, notably in supermarkets, convenience stores, and foodservice outlets. Potential market restraints may encompass intense competition from other beverage categories, raw material price volatility, and evolving consumer preferences.
US Ready to Drink Tea Market Market Size (In Billion)
Market segmentation reveals distinct growth avenues. PET bottles are anticipated to remain the leading packaging format due to their cost-effectiveness and convenience. The on-trade segment, including restaurants and cafes, presents substantial growth potential, particularly with the rising demand for artisanal tea-based beverages. Leading industry players such as PepsiCo, Coca-Cola, and Nestle are capitalizing on their extensive distribution networks and strong brand equity. Regional growth disparities are expected, with the Northeast and West regions potentially demonstrating accelerated expansion, influenced by higher disposable incomes and advanced health and wellness consciousness. The forecast period of 2025-2033 indicates a positive trajectory for the US RTD tea market, driven by continuous innovation and strategic investments. Agility in adapting to evolving consumer demands will be crucial for maintaining a competitive advantage in this dynamic market.
US Ready to Drink Tea Market Company Market Share
US Ready to Drink Tea Market Report: 2019-2033
This comprehensive report provides a detailed analysis of the US Ready to Drink (RTD) Tea market, offering invaluable insights for industry professionals, investors, and strategic decision-makers. Covering the period from 2019 to 2033, with a focus on 2025, this report unveils the market's structure, dynamics, dominant segments, and future trajectory. The report includes detailed market sizing, growth projections, and competitive landscaping, enabling you to make informed decisions in this dynamic market.
US Ready to Drink Tea Market Market Structure & Innovation Trends
This section analyzes the competitive landscape, innovative trends, and regulatory environment of the US RTD tea market. We delve into market concentration, identifying key players and their market share, and examining mergers and acquisitions (M&A) activities. The analysis includes:
- Market Concentration: The US RTD tea market exhibits a moderately consolidated structure, with several large players holding significant market share. For example, the top 5 companies, including Coca-Cola, PepsiCo, Nestle, and others, are estimated to hold xx% of the market in 2025.
- Innovation Drivers: Health and wellness trends, coupled with demand for convenient beverages, drive innovation. This includes the rise of functional teas, organic options, and unique flavor profiles.
- Regulatory Framework: FDA regulations regarding labeling, ingredients, and safety standards significantly influence market dynamics. Changes in these regulations can impact product formulation and marketing strategies.
- Product Substitutes: Other beverages like bottled water, juices, and sports drinks compete with RTD tea. Understanding these substitutes and their market penetration is crucial for competitive analysis.
- End-User Demographics: The key demographic segments are young adults, health-conscious consumers, and those seeking convenient refreshment options. Market segmentation by age, income, and lifestyle preferences provide valuable insights into consumer behavior.
- M&A Activities: The market has witnessed several M&A activities in recent years, with deal values totaling an estimated USD xx Million in the period 2019-2024. These activities impact market consolidation and competitive dynamics. Examples include [Specific M&A examples if available, otherwise omit this point].
US Ready to Drink Tea Market Market Dynamics & Trends
This section examines the key factors driving market growth, including technological advancements, evolving consumer preferences, and competitive dynamics. We project a Compound Annual Growth Rate (CAGR) of xx% during the forecast period (2025-2033), driven by:
- Health and Wellness Trends: Growing consumer awareness of health benefits associated with tea consumption is a major driver.
- Convenience Factor: RTD tea offers convenience compared to traditional tea brewing, appealing to busy lifestyles.
- Premiumization: Premium RTD teas with unique flavors, ingredients, and packaging attract high-value consumers.
- Technological Advancements: Innovations in packaging (e.g., aseptic packaging for extended shelf life) and distribution influence market growth.
- Changing Consumer Preferences: Demand for natural, organic, and functional teas is impacting product development and market segmentation.
- Competitive Dynamics: Intense competition between established brands and emerging players shapes pricing strategies, product innovation, and market penetration. Market penetration of RTD tea is projected to reach xx% by 2033.
Dominant Regions & Segments in US Ready to Drink Tea Market
This section identifies the leading regions and segments within the US RTD tea market. Key findings include:
Leading Region: [Insert leading region based on data analysis, e.g., the South East] leads due to [mention specific reasons, e.g., higher per capita consumption, favorable climate].
Dominant Segments:
Soft Drink Type: Iced tea holds the largest market share, followed by other RTD teas (herbal, green tea etc.). Detailed analysis of the segment size and growth projections for each type is provided in the full report.
Packaging Type: PET Bottles dominate due to cost-effectiveness and convenience. Glass bottles hold a niche market for premium products.
Distribution Channel: Off-trade (grocery stores, supermarkets) constitutes the major distribution channel. The On-trade segment (restaurants, cafes) contributes a significant, but smaller, share.
Key Drivers:
- Strong consumer demand for convenient beverages.
- Extensive distribution network covering retail and foodservice channels.
- Favorable economic conditions and rising disposable incomes in target regions.
US Ready to Drink Tea Market Product Innovations
The US RTD tea market is witnessing continuous product innovation, driven by consumer demand for healthier and more exciting beverages. Key trends include functional teas infused with vitamins or antioxidants, organic and sustainably sourced teas, and innovative flavor combinations to cater to diverse palates. The competitive advantage lies in delivering unique flavor profiles, leveraging health and wellness claims, and adopting sustainable packaging practices.
Report Scope & Segmentation Analysis
This report segments the US RTD tea market based on soft drink type (Iced Tea, Green Tea, Herbal Tea, Other RTD Tea), packaging type (Aseptic packages, Glass Bottles, Metal Can, PET Bottles), and distribution channel (Off-trade, On-trade). Each segment is analyzed for market size, growth projections, and competitive dynamics. For example, the Iced Tea segment is expected to experience significant growth due to its wide appeal, while the demand for premium packaging like glass bottles is growing, albeit at a slower pace.
Key Drivers of US Ready to Drink Tea Market Growth
The growth of the US RTD tea market is driven by several key factors: increasing consumer preference for convenient and healthy beverages, rising disposable incomes, technological advancements in packaging and production, and supportive government regulations. The health and wellness trend continues to fuel demand for functional teas with added benefits.
Challenges in the US Ready to Drink Tea Market Sector
The US RTD tea market faces challenges such as intense competition from other beverage categories, fluctuating raw material costs impacting profitability, and evolving consumer preferences requiring continuous product innovation. Furthermore, supply chain disruptions and environmental concerns related to packaging waste pose additional obstacles.
Emerging Opportunities in US Ready to Drink Tea Market
Emerging opportunities include the rising popularity of functional and organic teas, the potential for expansion into new market segments (e.g., specialized tea blends for specific health needs), and the growing demand for sustainable and eco-friendly packaging options. These opportunities present significant potential for market expansion and growth.
Leading Players in the US Ready to Drink Tea Market Market
- Red Diamond Inc
- Arizona Beverages USA LLC
- Milo’s Tea Company Inc
- Nestle S A
- Ito En Ltd
- PepsiCo Inc
- Hawaiian Sun Products Inc
- Keurig Dr Pepper Inc
- The Coca-Cola Company
- Del Monte Foods Inc
- Reily Foods Company
- Walmart Inc
Key Developments in US Ready to Drink Tea Market Industry
- January 2023: Milo's Tea Company announced a USD 130 Million investment in a new plant and distribution center, reflecting significant brand growth.
- January 2023: Lipton Tea partnered with Full Cart to enhance access to heart-friendly nutrition, showcasing a commitment to social responsibility.
- December 2022: Pure Leaf launched a limited-edition Merry Mint Iced Tea, successfully leveraging a movie tie-in and social media marketing.
Future Outlook for US Ready to Drink Tea Market Market
The US RTD tea market is poised for continued growth, driven by sustained consumer demand for healthy and convenient beverages. Strategic opportunities lie in product diversification, exploring new flavor profiles and functional benefits, adopting sustainable packaging, and leveraging digital marketing to engage consumers. Further market expansion is expected, particularly within the premium and functional segments.
US Ready to Drink Tea Market Segmentation
-
1. Soft Drink Type
- 1.1. Green Tea
- 1.2. Herbal Tea
- 1.3. Iced Tea
- 1.4. Other RTD Tea
-
2. Packaging Type
- 2.1. Aseptic packages
- 2.2. Glass Bottles
- 2.3. Metal Can
- 2.4. PET Bottles
-
3. Distribution Channel
-
3.1. Off-trade
- 3.1.1. Convenience Stores
- 3.1.2. Online Retail
- 3.1.3. Supermarket/Hypermarket
- 3.1.4. Others
- 3.2. On-trade
-
3.1. Off-trade
US Ready to Drink Tea Market Segmentation By Geography
-
1. North America
- 1.1. United States
- 1.2. Canada
- 1.3. Mexico
-
2. South America
- 2.1. Brazil
- 2.2. Argentina
- 2.3. Rest of South America
-
3. Europe
- 3.1. United Kingdom
- 3.2. Germany
- 3.3. France
- 3.4. Italy
- 3.5. Spain
- 3.6. Russia
- 3.7. Benelux
- 3.8. Nordics
- 3.9. Rest of Europe
-
4. Middle East & Africa
- 4.1. Turkey
- 4.2. Israel
- 4.3. GCC
- 4.4. North Africa
- 4.5. South Africa
- 4.6. Rest of Middle East & Africa
-
5. Asia Pacific
- 5.1. China
- 5.2. India
- 5.3. Japan
- 5.4. South Korea
- 5.5. ASEAN
- 5.6. Oceania
- 5.7. Rest of Asia Pacific
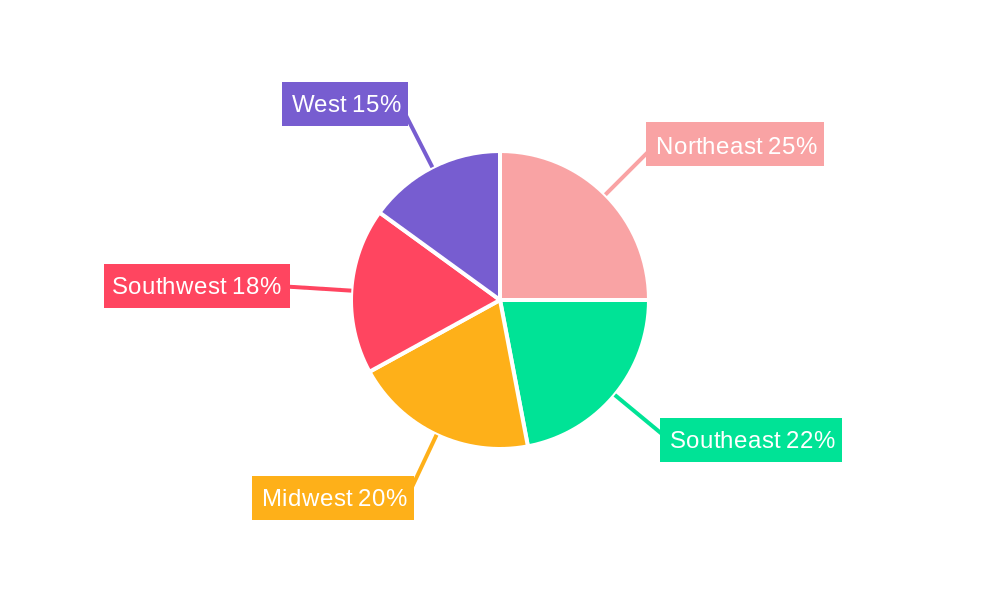
US Ready to Drink Tea Market Regional Market Share
Geographic Coverage of US Ready to Drink Tea Market
US Ready to Drink Tea Market REPORT HIGHLIGHTS
| Aspects | Details |
|---|---|
| Study Period | 2020-2034 |
| Base Year | 2025 |
| Estimated Year | 2026 |
| Forecast Period | 2026-2034 |
| Historical Period | 2020-2025 |
| Growth Rate | CAGR of 2.6% from 2020-2034 |
| Segmentation |
|
Table of Contents
- 1. Introduction
- 1.1. Research Scope
- 1.2. Market Segmentation
- 1.3. Research Objective
- 1.4. Definitions and Assumptions
- 2. Executive Summary
- 2.1. Market Snapshot
- 3. Market Dynamics
- 3.1. Market Drivers
- 3.2. Market Restrains
- 3.3. Market Trends
- 3.4. Market Opportunities
- 4. Market Factor Analysis
- 4.1. Porters Five Forces
- 4.1.1. Bargaining Power of Suppliers
- 4.1.2. Bargaining Power of Buyers
- 4.1.3. Threat of New Entrants
- 4.1.4. Threat of Substitutes
- 4.1.5. Competitive Rivalry
- 4.2. PESTEL analysis
- 4.3. BCG Analysis
- 4.3.1. Stars (High Growth, High Market Share)
- 4.3.2. Cash Cows (Low Growth, High Market Share)
- 4.3.3. Question Mark (High Growth, Low Market Share)
- 4.3.4. Dogs (Low Growth, Low Market Share)
- 4.4. Ansoff Matrix Analysis
- 4.5. Supply Chain Analysis
- 4.6. Regulatory Landscape
- 4.7. Current Market Potential and Opportunity Assessment (TAM–SAM–SOM Framework)
- 4.8. PRI Analyst Note
- 4.1. Porters Five Forces
- 5. Market Analysis, Insights and Forecast 2021-2033
- 5.1. Market Analysis, Insights and Forecast - by Soft Drink Type
- 5.1.1. Green Tea
- 5.1.2. Herbal Tea
- 5.1.3. Iced Tea
- 5.1.4. Other RTD Tea
- 5.2. Market Analysis, Insights and Forecast - by Packaging Type
- 5.2.1. Aseptic packages
- 5.2.2. Glass Bottles
- 5.2.3. Metal Can
- 5.2.4. PET Bottles
- 5.3. Market Analysis, Insights and Forecast - by Distribution Channel
- 5.3.1. Off-trade
- 5.3.1.1. Convenience Stores
- 5.3.1.2. Online Retail
- 5.3.1.3. Supermarket/Hypermarket
- 5.3.1.4. Others
- 5.3.2. On-trade
- 5.3.1. Off-trade
- 5.4. Market Analysis, Insights and Forecast - by Region
- 5.4.1. North America
- 5.4.2. South America
- 5.4.3. Europe
- 5.4.4. Middle East & Africa
- 5.4.5. Asia Pacific
- 5.1. Market Analysis, Insights and Forecast - by Soft Drink Type
- 6. Global US Ready to Drink Tea Market Analysis, Insights and Forecast, 2021-2033
- 6.1. Market Analysis, Insights and Forecast - by Soft Drink Type
- 6.1.1. Green Tea
- 6.1.2. Herbal Tea
- 6.1.3. Iced Tea
- 6.1.4. Other RTD Tea
- 6.2. Market Analysis, Insights and Forecast - by Packaging Type
- 6.2.1. Aseptic packages
- 6.2.2. Glass Bottles
- 6.2.3. Metal Can
- 6.2.4. PET Bottles
- 6.3. Market Analysis, Insights and Forecast - by Distribution Channel
- 6.3.1. Off-trade
- 6.3.1.1. Convenience Stores
- 6.3.1.2. Online Retail
- 6.3.1.3. Supermarket/Hypermarket
- 6.3.1.4. Others
- 6.3.2. On-trade
- 6.3.1. Off-trade
- 6.1. Market Analysis, Insights and Forecast - by Soft Drink Type
- 7. North America US Ready to Drink Tea Market Analysis, Insights and Forecast, 2020-2032
- 7.1. Market Analysis, Insights and Forecast - by Soft Drink Type
- 7.1.1. Green Tea
- 7.1.2. Herbal Tea
- 7.1.3. Iced Tea
- 7.1.4. Other RTD Tea
- 7.2. Market Analysis, Insights and Forecast - by Packaging Type
- 7.2.1. Aseptic packages
- 7.2.2. Glass Bottles
- 7.2.3. Metal Can
- 7.2.4. PET Bottles
- 7.3. Market Analysis, Insights and Forecast - by Distribution Channel
- 7.3.1. Off-trade
- 7.3.1.1. Convenience Stores
- 7.3.1.2. Online Retail
- 7.3.1.3. Supermarket/Hypermarket
- 7.3.1.4. Others
- 7.3.2. On-trade
- 7.3.1. Off-trade
- 7.1. Market Analysis, Insights and Forecast - by Soft Drink Type
- 8. South America US Ready to Drink Tea Market Analysis, Insights and Forecast, 2020-2032
- 8.1. Market Analysis, Insights and Forecast - by Soft Drink Type
- 8.1.1. Green Tea
- 8.1.2. Herbal Tea
- 8.1.3. Iced Tea
- 8.1.4. Other RTD Tea
- 8.2. Market Analysis, Insights and Forecast - by Packaging Type
- 8.2.1. Aseptic packages
- 8.2.2. Glass Bottles
- 8.2.3. Metal Can
- 8.2.4. PET Bottles
- 8.3. Market Analysis, Insights and Forecast - by Distribution Channel
- 8.3.1. Off-trade
- 8.3.1.1. Convenience Stores
- 8.3.1.2. Online Retail
- 8.3.1.3. Supermarket/Hypermarket
- 8.3.1.4. Others
- 8.3.2. On-trade
- 8.3.1. Off-trade
- 8.1. Market Analysis, Insights and Forecast - by Soft Drink Type
- 9. Europe US Ready to Drink Tea Market Analysis, Insights and Forecast, 2020-2032
- 9.1. Market Analysis, Insights and Forecast - by Soft Drink Type
- 9.1.1. Green Tea
- 9.1.2. Herbal Tea
- 9.1.3. Iced Tea
- 9.1.4. Other RTD Tea
- 9.2. Market Analysis, Insights and Forecast - by Packaging Type
- 9.2.1. Aseptic packages
- 9.2.2. Glass Bottles
- 9.2.3. Metal Can
- 9.2.4. PET Bottles
- 9.3. Market Analysis, Insights and Forecast - by Distribution Channel
- 9.3.1. Off-trade
- 9.3.1.1. Convenience Stores
- 9.3.1.2. Online Retail
- 9.3.1.3. Supermarket/Hypermarket
- 9.3.1.4. Others
- 9.3.2. On-trade
- 9.3.1. Off-trade
- 9.1. Market Analysis, Insights and Forecast - by Soft Drink Type
- 10. Middle East & Africa US Ready to Drink Tea Market Analysis, Insights and Forecast, 2020-2032
- 10.1. Market Analysis, Insights and Forecast - by Soft Drink Type
- 10.1.1. Green Tea
- 10.1.2. Herbal Tea
- 10.1.3. Iced Tea
- 10.1.4. Other RTD Tea
- 10.2. Market Analysis, Insights and Forecast - by Packaging Type
- 10.2.1. Aseptic packages
- 10.2.2. Glass Bottles
- 10.2.3. Metal Can
- 10.2.4. PET Bottles
- 10.3. Market Analysis, Insights and Forecast - by Distribution Channel
- 10.3.1. Off-trade
- 10.3.1.1. Convenience Stores
- 10.3.1.2. Online Retail
- 10.3.1.3. Supermarket/Hypermarket
- 10.3.1.4. Others
- 10.3.2. On-trade
- 10.3.1. Off-trade
- 10.1. Market Analysis, Insights and Forecast - by Soft Drink Type
- 11. Asia Pacific US Ready to Drink Tea Market Analysis, Insights and Forecast, 2020-2032
- 11.1. Market Analysis, Insights and Forecast - by Soft Drink Type
- 11.1.1. Green Tea
- 11.1.2. Herbal Tea
- 11.1.3. Iced Tea
- 11.1.4. Other RTD Tea
- 11.2. Market Analysis, Insights and Forecast - by Packaging Type
- 11.2.1. Aseptic packages
- 11.2.2. Glass Bottles
- 11.2.3. Metal Can
- 11.2.4. PET Bottles
- 11.3. Market Analysis, Insights and Forecast - by Distribution Channel
- 11.3.1. Off-trade
- 11.3.1.1. Convenience Stores
- 11.3.1.2. Online Retail
- 11.3.1.3. Supermarket/Hypermarket
- 11.3.1.4. Others
- 11.3.2. On-trade
- 11.3.1. Off-trade
- 11.1. Market Analysis, Insights and Forecast - by Soft Drink Type
- 12. Competitive Analysis
- 12.1. Company Profiles
- 12.1.1 Red Diamond Inc
- 12.1.1.1. Company Overview
- 12.1.1.2. Products
- 12.1.1.3. Company Financials
- 12.1.1.4. SWOT Analysis
- 12.1.2 Arizona Beverages USA LLC
- 12.1.2.1. Company Overview
- 12.1.2.2. Products
- 12.1.2.3. Company Financials
- 12.1.2.4. SWOT Analysis
- 12.1.3 Milo’s Tea Company Inc
- 12.1.3.1. Company Overview
- 12.1.3.2. Products
- 12.1.3.3. Company Financials
- 12.1.3.4. SWOT Analysis
- 12.1.4 Nestle S A
- 12.1.4.1. Company Overview
- 12.1.4.2. Products
- 12.1.4.3. Company Financials
- 12.1.4.4. SWOT Analysis
- 12.1.5 Ito En Ltd
- 12.1.5.1. Company Overview
- 12.1.5.2. Products
- 12.1.5.3. Company Financials
- 12.1.5.4. SWOT Analysis
- 12.1.6 PepsiCo Inc
- 12.1.6.1. Company Overview
- 12.1.6.2. Products
- 12.1.6.3. Company Financials
- 12.1.6.4. SWOT Analysis
- 12.1.7 Hawaiian Sun Products Inc
- 12.1.7.1. Company Overview
- 12.1.7.2. Products
- 12.1.7.3. Company Financials
- 12.1.7.4. SWOT Analysis
- 12.1.8 Keurig Dr Pepper Inc
- 12.1.8.1. Company Overview
- 12.1.8.2. Products
- 12.1.8.3. Company Financials
- 12.1.8.4. SWOT Analysis
- 12.1.9 The Coca-Cola Company
- 12.1.9.1. Company Overview
- 12.1.9.2. Products
- 12.1.9.3. Company Financials
- 12.1.9.4. SWOT Analysis
- 12.1.10 Del Monte Foods Inc
- 12.1.10.1. Company Overview
- 12.1.10.2. Products
- 12.1.10.3. Company Financials
- 12.1.10.4. SWOT Analysis
- 12.1.11 Reily Foods Company
- 12.1.11.1. Company Overview
- 12.1.11.2. Products
- 12.1.11.3. Company Financials
- 12.1.11.4. SWOT Analysis
- 12.1.12 Walmart Inc
- 12.1.12.1. Company Overview
- 12.1.12.2. Products
- 12.1.12.3. Company Financials
- 12.1.12.4. SWOT Analysis
- 12.1.1 Red Diamond Inc
- 12.2. Market Entropy
- 12.2.1 Company's Key Areas Served
- 12.2.2 Recent Developments
- 12.3. Company Market Share Analysis 2025
- 12.3.1 Top 5 Companies Market Share Analysis
- 12.3.2 Top 3 Companies Market Share Analysis
- 12.4. List of Potential Customers
- 13. Research Methodology
List of Figures
- Figure 1: Global US Ready to Drink Tea Market Revenue Breakdown (billion, %) by Region 2025 & 2033
- Figure 2: Global US Ready to Drink Tea Market Volume Breakdown (K Tons, %) by Region 2025 & 2033
- Figure 3: North America US Ready to Drink Tea Market Revenue (billion), by Soft Drink Type 2025 & 2033
- Figure 4: North America US Ready to Drink Tea Market Volume (K Tons), by Soft Drink Type 2025 & 2033
- Figure 5: North America US Ready to Drink Tea Market Revenue Share (%), by Soft Drink Type 2025 & 2033
- Figure 6: North America US Ready to Drink Tea Market Volume Share (%), by Soft Drink Type 2025 & 2033
- Figure 7: North America US Ready to Drink Tea Market Revenue (billion), by Packaging Type 2025 & 2033
- Figure 8: North America US Ready to Drink Tea Market Volume (K Tons), by Packaging Type 2025 & 2033
- Figure 9: North America US Ready to Drink Tea Market Revenue Share (%), by Packaging Type 2025 & 2033
- Figure 10: North America US Ready to Drink Tea Market Volume Share (%), by Packaging Type 2025 & 2033
- Figure 11: North America US Ready to Drink Tea Market Revenue (billion), by Distribution Channel 2025 & 2033
- Figure 12: North America US Ready to Drink Tea Market Volume (K Tons), by Distribution Channel 2025 & 2033
- Figure 13: North America US Ready to Drink Tea Market Revenue Share (%), by Distribution Channel 2025 & 2033
- Figure 14: North America US Ready to Drink Tea Market Volume Share (%), by Distribution Channel 2025 & 2033
- Figure 15: North America US Ready to Drink Tea Market Revenue (billion), by Country 2025 & 2033
- Figure 16: North America US Ready to Drink Tea Market Volume (K Tons), by Country 2025 & 2033
- Figure 17: North America US Ready to Drink Tea Market Revenue Share (%), by Country 2025 & 2033
- Figure 18: North America US Ready to Drink Tea Market Volume Share (%), by Country 2025 & 2033
- Figure 19: South America US Ready to Drink Tea Market Revenue (billion), by Soft Drink Type 2025 & 2033
- Figure 20: South America US Ready to Drink Tea Market Volume (K Tons), by Soft Drink Type 2025 & 2033
- Figure 21: South America US Ready to Drink Tea Market Revenue Share (%), by Soft Drink Type 2025 & 2033
- Figure 22: South America US Ready to Drink Tea Market Volume Share (%), by Soft Drink Type 2025 & 2033
- Figure 23: South America US Ready to Drink Tea Market Revenue (billion), by Packaging Type 2025 & 2033
- Figure 24: South America US Ready to Drink Tea Market Volume (K Tons), by Packaging Type 2025 & 2033
- Figure 25: South America US Ready to Drink Tea Market Revenue Share (%), by Packaging Type 2025 & 2033
- Figure 26: South America US Ready to Drink Tea Market Volume Share (%), by Packaging Type 2025 & 2033
- Figure 27: South America US Ready to Drink Tea Market Revenue (billion), by Distribution Channel 2025 & 2033
- Figure 28: South America US Ready to Drink Tea Market Volume (K Tons), by Distribution Channel 2025 & 2033
- Figure 29: South America US Ready to Drink Tea Market Revenue Share (%), by Distribution Channel 2025 & 2033
- Figure 30: South America US Ready to Drink Tea Market Volume Share (%), by Distribution Channel 2025 & 2033
- Figure 31: South America US Ready to Drink Tea Market Revenue (billion), by Country 2025 & 2033
- Figure 32: South America US Ready to Drink Tea Market Volume (K Tons), by Country 2025 & 2033
- Figure 33: South America US Ready to Drink Tea Market Revenue Share (%), by Country 2025 & 2033
- Figure 34: South America US Ready to Drink Tea Market Volume Share (%), by Country 2025 & 2033
- Figure 35: Europe US Ready to Drink Tea Market Revenue (billion), by Soft Drink Type 2025 & 2033
- Figure 36: Europe US Ready to Drink Tea Market Volume (K Tons), by Soft Drink Type 2025 & 2033
- Figure 37: Europe US Ready to Drink Tea Market Revenue Share (%), by Soft Drink Type 2025 & 2033
- Figure 38: Europe US Ready to Drink Tea Market Volume Share (%), by Soft Drink Type 2025 & 2033
- Figure 39: Europe US Ready to Drink Tea Market Revenue (billion), by Packaging Type 2025 & 2033
- Figure 40: Europe US Ready to Drink Tea Market Volume (K Tons), by Packaging Type 2025 & 2033
- Figure 41: Europe US Ready to Drink Tea Market Revenue Share (%), by Packaging Type 2025 & 2033
- Figure 42: Europe US Ready to Drink Tea Market Volume Share (%), by Packaging Type 2025 & 2033
- Figure 43: Europe US Ready to Drink Tea Market Revenue (billion), by Distribution Channel 2025 & 2033
- Figure 44: Europe US Ready to Drink Tea Market Volume (K Tons), by Distribution Channel 2025 & 2033
- Figure 45: Europe US Ready to Drink Tea Market Revenue Share (%), by Distribution Channel 2025 & 2033
- Figure 46: Europe US Ready to Drink Tea Market Volume Share (%), by Distribution Channel 2025 & 2033
- Figure 47: Europe US Ready to Drink Tea Market Revenue (billion), by Country 2025 & 2033
- Figure 48: Europe US Ready to Drink Tea Market Volume (K Tons), by Country 2025 & 2033
- Figure 49: Europe US Ready to Drink Tea Market Revenue Share (%), by Country 2025 & 2033
- Figure 50: Europe US Ready to Drink Tea Market Volume Share (%), by Country 2025 & 2033
- Figure 51: Middle East & Africa US Ready to Drink Tea Market Revenue (billion), by Soft Drink Type 2025 & 2033
- Figure 52: Middle East & Africa US Ready to Drink Tea Market Volume (K Tons), by Soft Drink Type 2025 & 2033
- Figure 53: Middle East & Africa US Ready to Drink Tea Market Revenue Share (%), by Soft Drink Type 2025 & 2033
- Figure 54: Middle East & Africa US Ready to Drink Tea Market Volume Share (%), by Soft Drink Type 2025 & 2033
- Figure 55: Middle East & Africa US Ready to Drink Tea Market Revenue (billion), by Packaging Type 2025 & 2033
- Figure 56: Middle East & Africa US Ready to Drink Tea Market Volume (K Tons), by Packaging Type 2025 & 2033
- Figure 57: Middle East & Africa US Ready to Drink Tea Market Revenue Share (%), by Packaging Type 2025 & 2033
- Figure 58: Middle East & Africa US Ready to Drink Tea Market Volume Share (%), by Packaging Type 2025 & 2033
- Figure 59: Middle East & Africa US Ready to Drink Tea Market Revenue (billion), by Distribution Channel 2025 & 2033
- Figure 60: Middle East & Africa US Ready to Drink Tea Market Volume (K Tons), by Distribution Channel 2025 & 2033
- Figure 61: Middle East & Africa US Ready to Drink Tea Market Revenue Share (%), by Distribution Channel 2025 & 2033
- Figure 62: Middle East & Africa US Ready to Drink Tea Market Volume Share (%), by Distribution Channel 2025 & 2033
- Figure 63: Middle East & Africa US Ready to Drink Tea Market Revenue (billion), by Country 2025 & 2033
- Figure 64: Middle East & Africa US Ready to Drink Tea Market Volume (K Tons), by Country 2025 & 2033
- Figure 65: Middle East & Africa US Ready to Drink Tea Market Revenue Share (%), by Country 2025 & 2033
- Figure 66: Middle East & Africa US Ready to Drink Tea Market Volume Share (%), by Country 2025 & 2033
- Figure 67: Asia Pacific US Ready to Drink Tea Market Revenue (billion), by Soft Drink Type 2025 & 2033
- Figure 68: Asia Pacific US Ready to Drink Tea Market Volume (K Tons), by Soft Drink Type 2025 & 2033
- Figure 69: Asia Pacific US Ready to Drink Tea Market Revenue Share (%), by Soft Drink Type 2025 & 2033
- Figure 70: Asia Pacific US Ready to Drink Tea Market Volume Share (%), by Soft Drink Type 2025 & 2033
- Figure 71: Asia Pacific US Ready to Drink Tea Market Revenue (billion), by Packaging Type 2025 & 2033
- Figure 72: Asia Pacific US Ready to Drink Tea Market Volume (K Tons), by Packaging Type 2025 & 2033
- Figure 73: Asia Pacific US Ready to Drink Tea Market Revenue Share (%), by Packaging Type 2025 & 2033
- Figure 74: Asia Pacific US Ready to Drink Tea Market Volume Share (%), by Packaging Type 2025 & 2033
- Figure 75: Asia Pacific US Ready to Drink Tea Market Revenue (billion), by Distribution Channel 2025 & 2033
- Figure 76: Asia Pacific US Ready to Drink Tea Market Volume (K Tons), by Distribution Channel 2025 & 2033
- Figure 77: Asia Pacific US Ready to Drink Tea Market Revenue Share (%), by Distribution Channel 2025 & 2033
- Figure 78: Asia Pacific US Ready to Drink Tea Market Volume Share (%), by Distribution Channel 2025 & 2033
- Figure 79: Asia Pacific US Ready to Drink Tea Market Revenue (billion), by Country 2025 & 2033
- Figure 80: Asia Pacific US Ready to Drink Tea Market Volume (K Tons), by Country 2025 & 2033
- Figure 81: Asia Pacific US Ready to Drink Tea Market Revenue Share (%), by Country 2025 & 2033
- Figure 82: Asia Pacific US Ready to Drink Tea Market Volume Share (%), by Country 2025 & 2033
List of Tables
- Table 1: Global US Ready to Drink Tea Market Revenue billion Forecast, by Soft Drink Type 2020 & 2033
- Table 2: Global US Ready to Drink Tea Market Volume K Tons Forecast, by Soft Drink Type 2020 & 2033
- Table 3: Global US Ready to Drink Tea Market Revenue billion Forecast, by Packaging Type 2020 & 2033
- Table 4: Global US Ready to Drink Tea Market Volume K Tons Forecast, by Packaging Type 2020 & 2033
- Table 5: Global US Ready to Drink Tea Market Revenue billion Forecast, by Distribution Channel 2020 & 2033
- Table 6: Global US Ready to Drink Tea Market Volume K Tons Forecast, by Distribution Channel 2020 & 2033
- Table 7: Global US Ready to Drink Tea Market Revenue billion Forecast, by Region 2020 & 2033
- Table 8: Global US Ready to Drink Tea Market Volume K Tons Forecast, by Region 2020 & 2033
- Table 9: Global US Ready to Drink Tea Market Revenue billion Forecast, by Soft Drink Type 2020 & 2033
- Table 10: Global US Ready to Drink Tea Market Volume K Tons Forecast, by Soft Drink Type 2020 & 2033
- Table 11: Global US Ready to Drink Tea Market Revenue billion Forecast, by Packaging Type 2020 & 2033
- Table 12: Global US Ready to Drink Tea Market Volume K Tons Forecast, by Packaging Type 2020 & 2033
- Table 13: Global US Ready to Drink Tea Market Revenue billion Forecast, by Distribution Channel 2020 & 2033
- Table 14: Global US Ready to Drink Tea Market Volume K Tons Forecast, by Distribution Channel 2020 & 2033
- Table 15: Global US Ready to Drink Tea Market Revenue billion Forecast, by Country 2020 & 2033
- Table 16: Global US Ready to Drink Tea Market Volume K Tons Forecast, by Country 2020 & 2033
- Table 17: United States US Ready to Drink Tea Market Revenue (billion) Forecast, by Application 2020 & 2033
- Table 18: United States US Ready to Drink Tea Market Volume (K Tons) Forecast, by Application 2020 & 2033
- Table 19: Canada US Ready to Drink Tea Market Revenue (billion) Forecast, by Application 2020 & 2033
- Table 20: Canada US Ready to Drink Tea Market Volume (K Tons) Forecast, by Application 2020 & 2033
- Table 21: Mexico US Ready to Drink Tea Market Revenue (billion) Forecast, by Application 2020 & 2033
- Table 22: Mexico US Ready to Drink Tea Market Volume (K Tons) Forecast, by Application 2020 & 2033
- Table 23: Global US Ready to Drink Tea Market Revenue billion Forecast, by Soft Drink Type 2020 & 2033
- Table 24: Global US Ready to Drink Tea Market Volume K Tons Forecast, by Soft Drink Type 2020 & 2033
- Table 25: Global US Ready to Drink Tea Market Revenue billion Forecast, by Packaging Type 2020 & 2033
- Table 26: Global US Ready to Drink Tea Market Volume K Tons Forecast, by Packaging Type 2020 & 2033
- Table 27: Global US Ready to Drink Tea Market Revenue billion Forecast, by Distribution Channel 2020 & 2033
- Table 28: Global US Ready to Drink Tea Market Volume K Tons Forecast, by Distribution Channel 2020 & 2033
- Table 29: Global US Ready to Drink Tea Market Revenue billion Forecast, by Country 2020 & 2033
- Table 30: Global US Ready to Drink Tea Market Volume K Tons Forecast, by Country 2020 & 2033
- Table 31: Brazil US Ready to Drink Tea Market Revenue (billion) Forecast, by Application 2020 & 2033
- Table 32: Brazil US Ready to Drink Tea Market Volume (K Tons) Forecast, by Application 2020 & 2033
- Table 33: Argentina US Ready to Drink Tea Market Revenue (billion) Forecast, by Application 2020 & 2033
- Table 34: Argentina US Ready to Drink Tea Market Volume (K Tons) Forecast, by Application 2020 & 2033
- Table 35: Rest of South America US Ready to Drink Tea Market Revenue (billion) Forecast, by Application 2020 & 2033
- Table 36: Rest of South America US Ready to Drink Tea Market Volume (K Tons) Forecast, by Application 2020 & 2033
- Table 37: Global US Ready to Drink Tea Market Revenue billion Forecast, by Soft Drink Type 2020 & 2033
- Table 38: Global US Ready to Drink Tea Market Volume K Tons Forecast, by Soft Drink Type 2020 & 2033
- Table 39: Global US Ready to Drink Tea Market Revenue billion Forecast, by Packaging Type 2020 & 2033
- Table 40: Global US Ready to Drink Tea Market Volume K Tons Forecast, by Packaging Type 2020 & 2033
- Table 41: Global US Ready to Drink Tea Market Revenue billion Forecast, by Distribution Channel 2020 & 2033
- Table 42: Global US Ready to Drink Tea Market Volume K Tons Forecast, by Distribution Channel 2020 & 2033
- Table 43: Global US Ready to Drink Tea Market Revenue billion Forecast, by Country 2020 & 2033
- Table 44: Global US Ready to Drink Tea Market Volume K Tons Forecast, by Country 2020 & 2033
- Table 45: United Kingdom US Ready to Drink Tea Market Revenue (billion) Forecast, by Application 2020 & 2033
- Table 46: United Kingdom US Ready to Drink Tea Market Volume (K Tons) Forecast, by Application 2020 & 2033
- Table 47: Germany US Ready to Drink Tea Market Revenue (billion) Forecast, by Application 2020 & 2033
- Table 48: Germany US Ready to Drink Tea Market Volume (K Tons) Forecast, by Application 2020 & 2033
- Table 49: France US Ready to Drink Tea Market Revenue (billion) Forecast, by Application 2020 & 2033
- Table 50: France US Ready to Drink Tea Market Volume (K Tons) Forecast, by Application 2020 & 2033
- Table 51: Italy US Ready to Drink Tea Market Revenue (billion) Forecast, by Application 2020 & 2033
- Table 52: Italy US Ready to Drink Tea Market Volume (K Tons) Forecast, by Application 2020 & 2033
- Table 53: Spain US Ready to Drink Tea Market Revenue (billion) Forecast, by Application 2020 & 2033
- Table 54: Spain US Ready to Drink Tea Market Volume (K Tons) Forecast, by Application 2020 & 2033
- Table 55: Russia US Ready to Drink Tea Market Revenue (billion) Forecast, by Application 2020 & 2033
- Table 56: Russia US Ready to Drink Tea Market Volume (K Tons) Forecast, by Application 2020 & 2033
- Table 57: Benelux US Ready to Drink Tea Market Revenue (billion) Forecast, by Application 2020 & 2033
- Table 58: Benelux US Ready to Drink Tea Market Volume (K Tons) Forecast, by Application 2020 & 2033
- Table 59: Nordics US Ready to Drink Tea Market Revenue (billion) Forecast, by Application 2020 & 2033
- Table 60: Nordics US Ready to Drink Tea Market Volume (K Tons) Forecast, by Application 2020 & 2033
- Table 61: Rest of Europe US Ready to Drink Tea Market Revenue (billion) Forecast, by Application 2020 & 2033
- Table 62: Rest of Europe US Ready to Drink Tea Market Volume (K Tons) Forecast, by Application 2020 & 2033
- Table 63: Global US Ready to Drink Tea Market Revenue billion Forecast, by Soft Drink Type 2020 & 2033
- Table 64: Global US Ready to Drink Tea Market Volume K Tons Forecast, by Soft Drink Type 2020 & 2033
- Table 65: Global US Ready to Drink Tea Market Revenue billion Forecast, by Packaging Type 2020 & 2033
- Table 66: Global US Ready to Drink Tea Market Volume K Tons Forecast, by Packaging Type 2020 & 2033
- Table 67: Global US Ready to Drink Tea Market Revenue billion Forecast, by Distribution Channel 2020 & 2033
- Table 68: Global US Ready to Drink Tea Market Volume K Tons Forecast, by Distribution Channel 2020 & 2033
- Table 69: Global US Ready to Drink Tea Market Revenue billion Forecast, by Country 2020 & 2033
- Table 70: Global US Ready to Drink Tea Market Volume K Tons Forecast, by Country 2020 & 2033
- Table 71: Turkey US Ready to Drink Tea Market Revenue (billion) Forecast, by Application 2020 & 2033
- Table 72: Turkey US Ready to Drink Tea Market Volume (K Tons) Forecast, by Application 2020 & 2033
- Table 73: Israel US Ready to Drink Tea Market Revenue (billion) Forecast, by Application 2020 & 2033
- Table 74: Israel US Ready to Drink Tea Market Volume (K Tons) Forecast, by Application 2020 & 2033
- Table 75: GCC US Ready to Drink Tea Market Revenue (billion) Forecast, by Application 2020 & 2033
- Table 76: GCC US Ready to Drink Tea Market Volume (K Tons) Forecast, by Application 2020 & 2033
- Table 77: North Africa US Ready to Drink Tea Market Revenue (billion) Forecast, by Application 2020 & 2033
- Table 78: North Africa US Ready to Drink Tea Market Volume (K Tons) Forecast, by Application 2020 & 2033
- Table 79: South Africa US Ready to Drink Tea Market Revenue (billion) Forecast, by Application 2020 & 2033
- Table 80: South Africa US Ready to Drink Tea Market Volume (K Tons) Forecast, by Application 2020 & 2033
- Table 81: Rest of Middle East & Africa US Ready to Drink Tea Market Revenue (billion) Forecast, by Application 2020 & 2033
- Table 82: Rest of Middle East & Africa US Ready to Drink Tea Market Volume (K Tons) Forecast, by Application 2020 & 2033
- Table 83: Global US Ready to Drink Tea Market Revenue billion Forecast, by Soft Drink Type 2020 & 2033
- Table 84: Global US Ready to Drink Tea Market Volume K Tons Forecast, by Soft Drink Type 2020 & 2033
- Table 85: Global US Ready to Drink Tea Market Revenue billion Forecast, by Packaging Type 2020 & 2033
- Table 86: Global US Ready to Drink Tea Market Volume K Tons Forecast, by Packaging Type 2020 & 2033
- Table 87: Global US Ready to Drink Tea Market Revenue billion Forecast, by Distribution Channel 2020 & 2033
- Table 88: Global US Ready to Drink Tea Market Volume K Tons Forecast, by Distribution Channel 2020 & 2033
- Table 89: Global US Ready to Drink Tea Market Revenue billion Forecast, by Country 2020 & 2033
- Table 90: Global US Ready to Drink Tea Market Volume K Tons Forecast, by Country 2020 & 2033
- Table 91: China US Ready to Drink Tea Market Revenue (billion) Forecast, by Application 2020 & 2033
- Table 92: China US Ready to Drink Tea Market Volume (K Tons) Forecast, by Application 2020 & 2033
- Table 93: India US Ready to Drink Tea Market Revenue (billion) Forecast, by Application 2020 & 2033
- Table 94: India US Ready to Drink Tea Market Volume (K Tons) Forecast, by Application 2020 & 2033
- Table 95: Japan US Ready to Drink Tea Market Revenue (billion) Forecast, by Application 2020 & 2033
- Table 96: Japan US Ready to Drink Tea Market Volume (K Tons) Forecast, by Application 2020 & 2033
- Table 97: South Korea US Ready to Drink Tea Market Revenue (billion) Forecast, by Application 2020 & 2033
- Table 98: South Korea US Ready to Drink Tea Market Volume (K Tons) Forecast, by Application 2020 & 2033
- Table 99: ASEAN US Ready to Drink Tea Market Revenue (billion) Forecast, by Application 2020 & 2033
- Table 100: ASEAN US Ready to Drink Tea Market Volume (K Tons) Forecast, by Application 2020 & 2033
- Table 101: Oceania US Ready to Drink Tea Market Revenue (billion) Forecast, by Application 2020 & 2033
- Table 102: Oceania US Ready to Drink Tea Market Volume (K Tons) Forecast, by Application 2020 & 2033
- Table 103: Rest of Asia Pacific US Ready to Drink Tea Market Revenue (billion) Forecast, by Application 2020 & 2033
- Table 104: Rest of Asia Pacific US Ready to Drink Tea Market Volume (K Tons) Forecast, by Application 2020 & 2033
Frequently Asked Questions
1. What is the projected Compound Annual Growth Rate (CAGR) of the US Ready to Drink Tea Market?
The projected CAGR is approximately 2.6%.
2. Which companies are prominent players in the US Ready to Drink Tea Market?
Key companies in the market include Red Diamond Inc, Arizona Beverages USA LLC, Milo’s Tea Company Inc, Nestle S A, Ito En Ltd, PepsiCo Inc, Hawaiian Sun Products Inc, Keurig Dr Pepper Inc, The Coca-Cola Company, Del Monte Foods Inc, Reily Foods Company, Walmart Inc.
3. What are the main segments of the US Ready to Drink Tea Market?
The market segments include Soft Drink Type, Packaging Type, Distribution Channel.
4. Can you provide details about the market size?
The market size is estimated to be USD 9.3 billion as of 2022.
5. What are some drivers contributing to market growth?
Increasing demand for meat alternatives.
6. What are the notable trends driving market growth?
OTHER KEY INDUSTRY TRENDS COVERED IN THE REPORT.
7. Are there any restraints impacting market growth?
Presence of numerous alternatives in the plant proteins.
8. Can you provide examples of recent developments in the market?
January 2023: Milo's Tea Company has announced an initial investment of over USD 130 million to construct a new plant and distribution centre in Spartanburg County, South Carolina. This new investment is a direct response to the growth of Milo's brand. Milo expects to start producing its famous tea and lemonade in the fall of 2024.January 2023: Lipton Tea partnered with Full Cart, a program within the nonprofit U.S. Hunger, and a virtual food pantry, to enhance access to heart-friendly nutrition and grocery assistance.December 2022: Pure Leaf rolled out a limited-edition Merry Mint Iced Tea, coinciding with the release of the Christmas movie 'Christmas Class Reunion'. This mint-flavored iced tea was simultaneously launched through a social media giveaway, enhancing the movie-watching experience for consumers.
9. What pricing options are available for accessing the report?
Pricing options include single-user, multi-user, and enterprise licenses priced at USD 3800, USD 4500, and USD 5800 respectively.
10. Is the market size provided in terms of value or volume?
The market size is provided in terms of value, measured in billion and volume, measured in K Tons.
11. Are there any specific market keywords associated with the report?
Yes, the market keyword associated with the report is "US Ready to Drink Tea Market," which aids in identifying and referencing the specific market segment covered.
12. How do I determine which pricing option suits my needs best?
The pricing options vary based on user requirements and access needs. Individual users may opt for single-user licenses, while businesses requiring broader access may choose multi-user or enterprise licenses for cost-effective access to the report.
13. Are there any additional resources or data provided in the US Ready to Drink Tea Market report?
While the report offers comprehensive insights, it's advisable to review the specific contents or supplementary materials provided to ascertain if additional resources or data are available.
14. How can I stay updated on further developments or reports in the US Ready to Drink Tea Market?
To stay informed about further developments, trends, and reports in the US Ready to Drink Tea Market, consider subscribing to industry newsletters, following relevant companies and organizations, or regularly checking reputable industry news sources and publications.
Methodology
Step 1 - Identification of Relevant Samples Size from Population Database


Step 2 - Approaches for Defining Global Market Size (Value, Volume* & Price*)

Note*: In applicable scenarios
Step 3 - Data Sources
Primary Research
- Web Analytics
- Survey Reports
- Research Institute
- Latest Research Reports
- Opinion Leaders
Secondary Research
- Annual Reports
- White Paper
- Latest Press Release
- Industry Association
- Paid Database
- Investor Presentations

Step 4 - Data Triangulation
Involves using different sources of information in order to increase the validity of a study
These sources are likely to be stakeholders in a program - participants, other researchers, program staff, other community members, and so on.
Then we put all data in single framework & apply various statistical tools to find out the dynamic on the market.
During the analysis stage, feedback from the stakeholder groups would be compared to determine areas of agreement as well as areas of divergence